
Forex analysis review |
- Fractal analysis of major currency pairs on May 30
- Euro and INSTEX
- Bitcoin analysis for May, 29.2019
- GBP/USD analysis for May, 29.05.2019
- Technical analysis for EURUSD for May 29, 2019
- Technical analysis for Gold for May 29, 2019
- Analysis of Gold for May, 29.2019
- May 29, 2019 : GBP/USD Intraday technical analysis and trade recommendations.
- May 29, 2019 : EUR/USD Intraday technical analysis and trade recommendations.
- GBP/USD. May 29. Results of the day. The main contender for the post of Prime Minister in the UK will appear before the court
- EUR/USD. May 29. Results of the day. Problems with Italy – a new reason for traders to get rid of the euro
- The flames of the trade war may spread to the currency market
- EUR and GBP: the euro is falling under the pressure of weak data on Germany, and the pound is waiting for clarity with the
- How to make money on the imminent fall of AUD/USD?
- The dollar should fall, instead of increasing
- Technical analysis of USD/CHF for May 29, 2019
- Technical analysis of AUD/USD for May 29, 2019
- GBP/USD: plan for the US session on May 29. The lull before the election of the Prime Minister of Great Britain can harm
- EUR/USD: plan for the US session on May 29. The rise in unemployment in Germany has affected the euro
- Gold scares dollar recession
- "Loonie" is waiting for the decision of the Bank of Canada and the euro looks forward to the final alignment of the new political
- Trading Plan for EUR / USD pair on 05/29/2019
- Bitcoin dips towards $8,500 area; bullish trend may continue: May 29, 2019
- Trading concerns and falling yields are pushing the yen upwards
- Burning forecast EURUSD 05/29/2019
| Fractal analysis of major currency pairs on May 30 Posted: 29 May 2019 06:21 PM PDT Forecast for May 30: Analytical review of H1-scale currency pairs: For the euro / dollar pair, the key levels on the H1 scale are: 1.1171, 1.1157, 1.1146, 1.1123, 1.1115, 1.1099, 1.1080 and 1.1067. Here, we are following the development of the downward structure of May 27. Continuation of the movement to the bottom is expected after the price passes the noise range 1.1123 - 1.1115. In this case, the target is 1.1099, wherein price consolidation is near this level. The breakdown of the level of 1.1099 will lead to a movement to the level of 1.1080. For the potential value for the bottom, we consider the level of 1.1067. Upon reaching which, we expect a consolidation in the corridor of 1.1080 - 1.1067. Short-term upward movement is possible in the range of 1.1146 - 1.1157. The breakdown of the last value will lead to a prolonged correction. Here, the target is 1.1171. This level is a key support for the bottom. The main trend is the downward structure of May 27. Trading recommendations: Buy 1.1146 Take profit: 1.1156 Buy 1.1158 Take profit: 1.1170 Sell: 1.1115 Take profit: 1.1100 Sell: 1.1097 Take profit: 1.1083 For the pound / dollar pair, the key levels on the H1 scale are: 1.2811, 1.2737, 1.2693, 1.2612, 1.2553, 1.2478 and 1.2428. Here, we mainly expect the development of a downward local structure of May 21. Continuation of the movement to the bottom is expected after the breakdown of 1.2612. Here, the target is -1.2553. The breakdown of which must be accompanied by a pronounced downward movement. In this case, the target is 1.2478. We consider the level of 1.2428 to be a potential value for the bottom. Upon reaching this level, we expect a consolidation in the range of 1.2478 - 1.2428, as well as a departure to a correction. Short-term upward movement is possible in the range of 1.2693 - 1.2737. The breakdown of the latter value will have to form an upward movement. Here, the target is 1.2811. The main trend is the downward structure of May 21. Trading recommendations: Buy: 1.2693 Take profit: 1.2735 Buy: 1.2738 Take profit: 1.2810 Sell: 1.2612 Take profit: 1.2555 Sell: 1.2550 Take profit: 1.2478 For the dollar / franc pair, the key levels on the H1 scale are: 1.0137, 1.0118, 1.0094, 1.0082, 1.0057, 1.0048 and 1.0034. Here, we are following the development of the ascending structure of May 24. Short-term upward movement is expected in the range of 1.0082 - 1.0094. The breakdown of the last value should be accompanied by a pronounced upward movement. In this case, the target is 1.0118. For the potential value for the top, we consider the level of 1.0137. The movement to which is expected after the breakdown of 1.0120. Short-term downward movement is possible in the range of 1.0057 - 1.0048. The breakdown of the last value will lead to a prolonged correction. Here, the goal is 1.0034. This level is a key support for the upward structure. The main trend is the ascending structure of May 24. Trading recommendations: Buy : 1.0082 Take profit: 1.0094 Buy : 1.0096 Take profit: 1.0118 Sell: 1.0057 Take profit: 1.0048 Sell: 1.0046 Take profit: 1.0036 For the dollar / yen pair, the key levels on the scale are : 110.21, 109.94, 109.73, 109.36, 109.14, 108.98 and 108.51. Here, the price forms the medium-term initial conditions for the downward cycle of May 21. Continuation of the movement to the bottom is expected after the breakdown 109.36. In this case, the goal is 109.14, wherein consolidation is near this level. The price pass of the noise range of 109.14 - 108.98 should be accompanied by a pronounced downward movement. Here, the goal is 108.51, wherein near this level, we expect a consolidation and possible rollback to the correction. Short-term upward movement is possible in the range of 109.73 - 109.94. The breakdown of the latter value will lead to in-depth correction. Here, the goal is 110.21. This level is a key support for the downward cycle. The main trend: the formation of medium-term initial conditions for the downward cycle of May 21. Trading recommendations: Buy: 109.73 Take profit: 109.92 Buy: 109.95 Take profit: 110.20 Sell: 109.36 Take profit: 109.15 Sell: 108.98 Take profit: 108.51 For the Canadian dollar / US dollar pair, the key levels on the H1 scale are: 1.3651, 1.3611, 1.3556, 1.3491, 1.3464 and 1.3428. Here, we continue to follow the development of the ascending structure of May 22. Short-term upward movement is expected in the range of 1.3534 - 1.3556. The breakdown of the last value should be accompanied by a pronounced upward movement. In this case, the target is 1.3611. For the potential value for the top, we consider the level of 1.3651. After reaching which, we expect to go into correction. Short-term downward movement is possible in the range of 1.3491 - 1.3464. The breakdown of the latter value will lead to a prolonged correction. Here, the target is 1.3428. This level is a key support for the top. The main trend is the upward cycle of May 22. Trading recommendations: Buy: 1.3534 Take profit: 1.3555 Buy : 1.3558 Take profit: 1.3610 Sell: 1.3490 Take profit: 1.3466 Sell: 1.3462 Take profit: 1.3433 For the Australian dollar / US dollar pair, the key levels on the H1 scale are : 0.7013, 0.6994, 0.6965, 0.6955, 0.6941, 0.6910, 0.6897, 0.6882 and 0.6863. Here, the price forms the expressed initial conditions for the top of May 23. Continuation of the movement to the top is expected after the breakdown of 0.6941. Here, the first goal is 0.6955, wherein near this level is a price consolidation. The price passage of the noise range of 0.6955 - 0.6965 should be accompanied by a pronounced upward movement. In this case, the target is 0.6994. For the potential value for the top, we consider the level of 0.7013. After reaching which, we expect a rollback to the bottom. Short-term downward movement is possible in the range of 0.6910 - 0.6897. The breakdown of the latter value will lead to a prolonged movement. Here, the target is 0.6882. This level is a key support for the upward structure. The main trend is the formation of initial conditions for the top of May 23. Trading recommendations: Buy: 0.6941 Take profit: 0.6955 Buy: 0.6967 Take profit: 0.6992 Sell : 0.6910 Take profit : 0.6898 Sell: 0.6895 Take profit: 0.6884 For the euro / yen pair, the key levels on the H1 scale are: 122.72, 122.42, 122.23, 121.76, 121.54, 120.96 and 120.59. Here, we are following the development of the mid-term downward structure of May 21. Short-term downward movement is expected in the range of 121.76 - 121.54. The breakdown of the last value should be accompanied by a pronounced downward movement. Here, the goal is 120.96. For the potential value for the bottom, we consider the level of 120.59. After reaching which, we expect a consolidation, as well as a rollback to the correction. Short-term upward trend is possible in the range of 122.23 - 122.42. The breakdown of the last value will lead to a prolonged correction. Here, the goal is 122.72. This level is a key support for the downward structure. Before it, we expect clearance of the initial conditions for the top. The main trend is a mid-term downward structure of May 21. Trading recommendations: Buy: 122.23 Take profit: 122.40 Buy: 122.44 Take profit: 122.70 Sell: 121.76 Take profit: 121.56 Sell: 121.50 Take profit: 121.00 For the pound / yen pair, the key levels on the H1 scale are : 140.18, 139.63, 139.14, 138.76, 138.11, 137.49, 136.85 and 136.00. Here, we are following the development of the downward structure of May 21. Continuation of the movement to the bottom is expected after the breakdown of the level of 138.10. In this case, the goal is 137.49, wherein near which a price consolidation is possible. The breakdown of the level of 137.49 will allow us to count on a move to 136.85. From this level there is a high probability of going into a correction. For the potential value for the bottom, we consider the level of 136.00. Short-term upward movement is possible in the range of 138.76 - 139.14. The breakdown of the latter value will lead to a prolonged correction. Here, the goal is 139.63. This level is a key support for the downward structure. Its price will have the formation of the initial conditions for the upward movement. In this case, the potential target is 140.18. The main trend is a local downward structure of May 21. Trading recommendations: Buy: 138.76 Take profit: 139.12 Buy: 139.16 Take profit: 139.60 Sell: 138.10 Take profit: 137.55 Sell: 137.46 Take profit: 136.90 The material has been provided by InstaForex Company - www.instaforex.com |
| Posted: 29 May 2019 05:00 PM PDT The single currency was under pressure again - this time because of the sharp statements of Italian politicians, as well as because of the prospects for sanctions pressure from the United States. On the other side of the scale, Brexit unexpectedly appeared, or rather, a statement by the Prime Minister of Ireland, Leo Varadkar, who allowed the option of another delay for London. Also, traders closely monitor the process of political struggle for key positions in the EU structure - especially in the context of the early departure of Mario Draghi from the post of head of the ECB. In addition to all the above, a very weak macroeconomic statistics was published in Europe yesterday, which also put additional pressure on the euro. Such a mixed fundamental background did not allow the EUR / USD bulls to develop a correction, and thus, the price went to the base of the 11th figure again. A new round of geopolitical tensions has become apparent on the conventional US-EU-Iran conditional line. It all started with the creation of a financial mechanism INSTEX (Instrument of Support for Trade Exchanges). This mechanism is a joint development of the British, Germans and French. It was coined for trading with Iran without the use of US dollars and US banking institutions. It is worth recalling that in November last year, the States introduced new sanctions against Iran: Trump unilaterally withdrew from the "Nuclear Deal" and accused Tehran that Iranians secretly continue to develop nuclear weapons. The objects of sanctions are primarily the Iranian oil sector, as well as other sectors of the economy - the banking industry, shipbuilding, shipping and so on. At the same time, the Trump Administration made a list of "beneficiaries" - Washington provided special exemptions for 8 countries (China, India, Greece, Italy, Taiwan, Japan, Turkey and South Korea), allowing them to temporarily import Iranian oil even after the imposition of sanctions. But in May of this year, the United States banned these countries from having trade relations with Tehran. In addition, Iran was disconnected from the SWIFT international payment system, after which any financial relations of the Iranian business with foreign partners faced serious difficulties. Against the background of such events, the key countries of Europe (Germany, France, Britain) announced the creation of a special mechanism for settlements with Tehran, which makes it possible to bypass large-scale sanctions from the United States. The mechanism was created in January, but since then the Europeans have not dared to switch to its practical application (by the way, the Iranians have often criticized Brussels for this indecision). Americans also calmly reacted to the creation of INSTEX, although they expressed some concern. However, this week, the story got an unexpected continuation. American journalists got access to the memorandum of US Deputy Secretary of the Treasury Sigal Mandelker, who oversees counter-terrorism and financial intelligence issues at the White House. The general conclusion of this document is that Washington is ready to impose sanctions on any official or businessman who is somehow connected with the activities of INSTEX. The document stipulates that restrictive measures can be taken in the event that the use of this financial mechanism begins. The USA, in particular, threatened to exclude all officials involved in the creation of INSTEX from its financial system. Given the fact that this information is unofficial, Brussels did not respond to its publication. But the market reacted accordingly, getting rid of the single currency. It is worth noting that the euro is quite sharply responding to such rumors, given the volume of trade between the EU and the United States. Suffice it to recall the recent panic over the increase in American duties on the import of European cars. At the last moment, Trump decided to postpone this issue for 6 months, allowing the working group to continue negotiations. But in the case of INSTEX, the situation is different: there will be no concessions here, especially considering the recent events in the Persian Gulf. That is why the single currency showed a decline across the market yesterday. After all, if the Europeans still insist on the functioning of this financial mechanism, the Americans will inevitably launch the flywheel of sanctions. Macroeconomic reports also put additional pressure on the Euro yesterday. First of all, the German data was disappointing: the unemployment rate unexpectedly rose to 5% (while for two months in a row it went out at around 4.9%), and the number of unemployed jumped immediately to 60 thousand, while experts predicted a decline of 8 thousand. The French figures were also disappointed: the growth of inflation in France slowed down, while the GDP indicator in quarterly terms came out at the level of previous periods, although experts expected a more substantial growth. Thus, the EUR/USD pair has every chance to test the area of annual minimums again, declining to the level of 1.1105. For an attempt on the 10th figure, a more compelling reason is needed. Therefore, the bears will most likely limit themselves to this level of support. The material has been provided by InstaForex Company - www.instaforex.com |
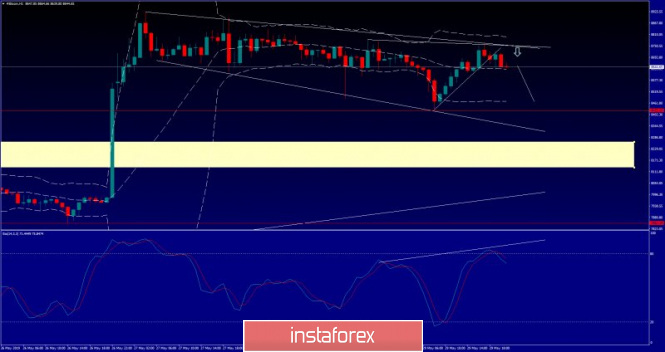
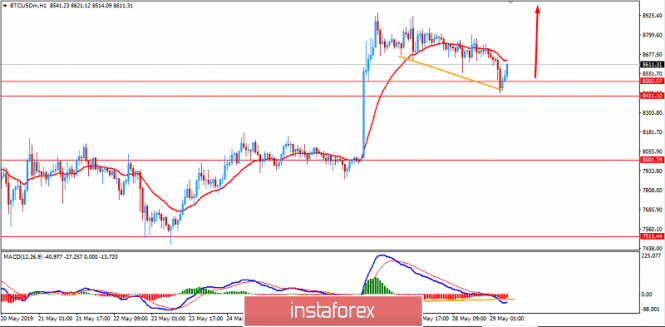
| Bitcoin analysis for May, 29.2019 Posted: 29 May 2019 11:34 AM PDT BTC did reject from the upper diagonal of the downward channel at $8.750, which influenced sellers. There is potential for down plan and potential test of $8.422.
White lines – Downward channel Red line – Support 1 White rectangle – Support 2 BTC did successful test of the resistance and also did successful breakout of the upward trend line, which is sign that sellers are in control. We found the bearish divergence on the Stochastic oscillator, which is another sign of the weakness. As long as the BTC is trading below the $8.926, we are bearish. Support levels are seen at $8.422 and $8.230. The material has been provided by InstaForex Company - www.instaforex.com |
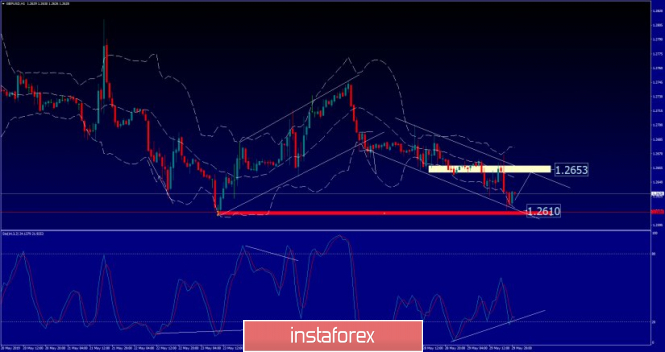
| GBP/USD analysis for May, 29.05.2019 Posted: 29 May 2019 11:28 AM PDT GBP/USD did trade lower as we expected. The price tested our second downward target at 1.2615. Selling looks risky at this stage cuuse the major low is very close. Watch for potential rally.
White lines – Downward channel Red rectangle – Support White rectangle – Resistance GBP price did test and reject from our key support at 1.2615, which is sign that sellers lost momentum on downside and that rally may start. Short-term resistance is at 1.2653 and breaking above it will open the way for a move towards the resistance at 1.2670. Buy divergence is present on the stochastic oscillator, watch for potential buying opportunities. The material has been provided by InstaForex Company - www.instaforex.com |
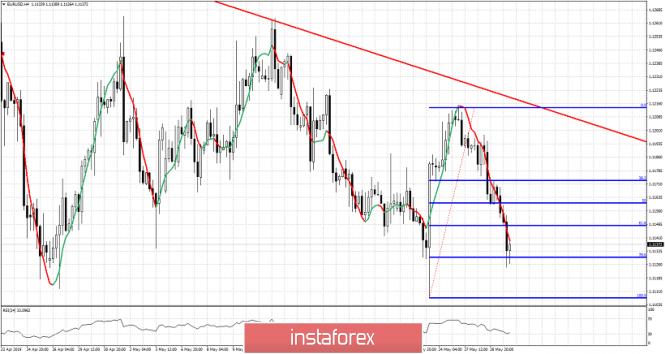
| Technical analysis for EURUSD for May 29, 2019 Posted: 29 May 2019 11:26 AM PDT EURUSD is moving below 1.1150 short-term support pushing below the 61.8% Fibonacci retracement. This is a weakness sign that implies there are increased chances of breaking below 1.11 soon. Bears remain in control of the trend.
EURUSD has pushed towards the 78.6% Fibonacci retracement. The longer price stays below 1.1150 the higher the chances of breaking below 1.11 soon. Bulls were not strong enough to break above 1.1230 and resistance remains intact. Bears remain in control of the trend as price continues to make lower lows and lower highs since January. Last Thursday's bullish reversal candle could soon be canceled. We warned that a rejection at 1.12-1.1230 would be a bearish signal and so far this has come true. Bulls need to act now and close the day above 1.1150 in order to continue to have hopes for a move back towards 1.12 or higher. The material has been provided by InstaForex Company - www.instaforex.com |
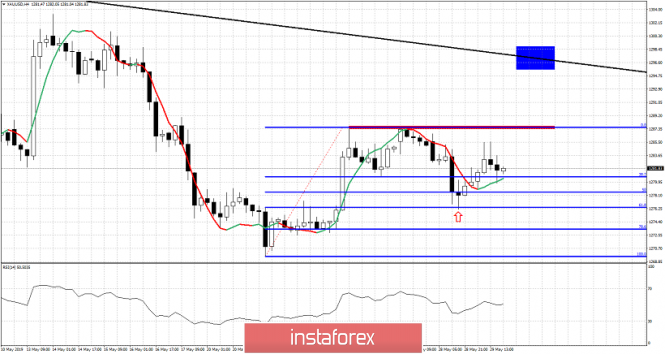
| Technical analysis for Gold for May 29, 2019 Posted: 29 May 2019 11:21 AM PDT Gold price bounced off the 61.8% Fibonacci retracement towards the short-term resistance at $1,290-$1,300 area but bulls remain weak. Price is pulling back lower as Dollar strengthens. Trend remains bearish as long as price is below $1,300.
Blue rectangle - target if short-term resistance is broken Gold price pushed towards $1,286 but bulls could not even push price towards or above $1,290. Even the short-term resistance was not seriously challenged today. This is a sign of weakness. Support is found at $1,276 and next at $1,266 which is major support. Major resistance is found at $1,295-$1,300. As long as price is below this level trend will remain bearish. Bulls need to break above $1,288-90 in order to challenge $1,295-$1,300 major resistance. The material has been provided by InstaForex Company - www.instaforex.com |
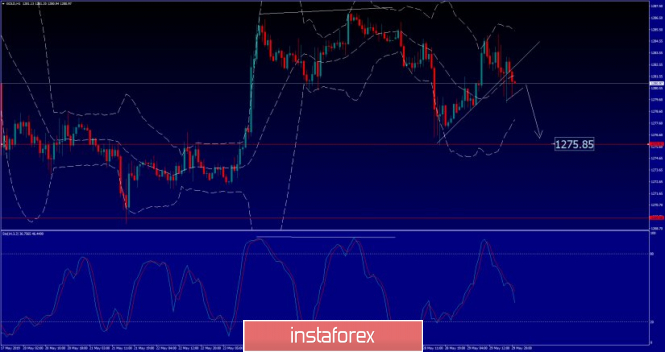
| Analysis of Gold for May, 29.2019 Posted: 29 May 2019 11:16 AM PDT Gold price has made an important break of the supportat the price of $1.281 . As long as we trade below $1.287, bears will be expecting a move lower to $1.275-$1.269. Breaking above the $1.287 opens the way for $1.300 and higher.
Upward white line - important short-term support (broken) Red line – Support 1 and downward target Red line 2 – Support 2 and downward target 2 Gold price did break the support tendline in the backgorund and on that way confimred bearish control. Short-term resistance is at $1,288 and breaking above it will open the way for a move towards the major resistance and round number $1.300. Stochascit oscillator did top and we may expect further downside. The material has been provided by InstaForex Company - www.instaforex.com |
| May 29, 2019 : GBP/USD Intraday technical analysis and trade recommendations. Posted: 29 May 2019 11:01 AM PDT
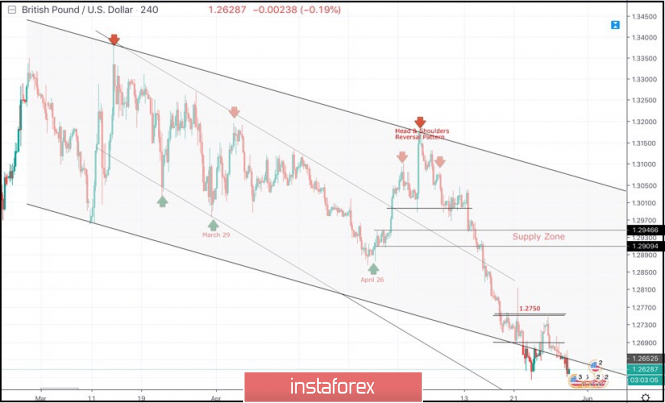
On March 29, a visit towards the price levels of 1.2980 (the lower limit of the newly-established bearish movement channel) could bring the GBPUSD pair again towards the upper limit of the minor bearish channel around (1.3160-1.3180). Since then, Short-term outlook has turned into bearish with intermediate-term bearish targets projected towards 1.2900 and 1.2850. On April 26, another bullish pullback was initiated towards 1.3000 (the same bottom of March 29) which has been breached to the upside until May 13 when a bearish Head and Shoulders pattern was demonstrated on the H4 chart with neckline located around 1.2980-1.3020. Bearish persistence below 1.2980 enhanced further bearish decline. Initial bearish Targets were already reached around 1.2900-1.2870 (the backside of the broken channel) which failed to provide any bullish support for the pair. Further bearish decline was demonstrated towards the lower limit of the long-term channel around (1.2700-1.2650). The GBPUSD pair looks oversold around the current price levels (1.2650-1.2700). That's why, SELL signals shouldn't be considered at such low prices. On the other hand, bullish persistence above 1.2690 and 1.2750 is needed to enhance the bullish side of the market towards 1.2870 (Bottom of April 26). Trade Recommendations: Conservative traders should wait for another bullish pullback towards 1.2870-1.2905 (newly-established supply zone) to look for valid sell entries. S/L should be placed above 1.2950. Counter-trend traders can consider any bullish breakout above 1.2690-1.2700 as a signal to look for a valid BUY entry. T/P level to be located around 1.2750 and 1.2820. S/L to be located below 1.2630. The material has been provided by InstaForex Company - www.instaforex.com |
| May 29, 2019 : EUR/USD Intraday technical analysis and trade recommendations. Posted: 29 May 2019 09:32 AM PDT
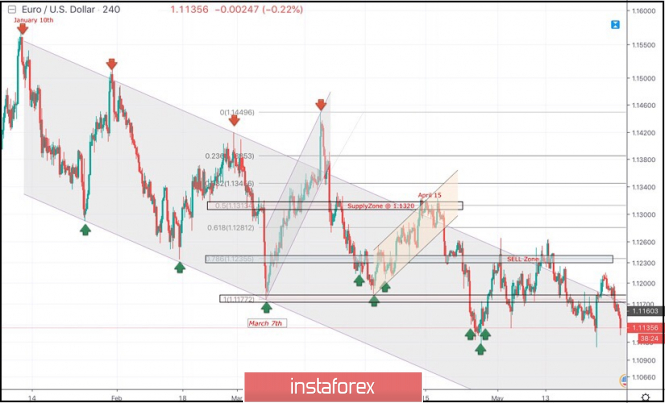
Since January 10, the EURUSD pair has been moving within the depicted channel with slight bearish tendency. Few weeks ago, a bullish Head and Shoulders reversal pattern was demonstrated around 1.1200. This enhanced further bullish advancement towards 1.1300-1.1315 (supply zone) where significant bearish rejection was demonstrated on April 15. For Intraday traders, the price zone around 1.1235 (78.6% Fibonacci) stood as a temporary demand area which paused the ongoing bearish momentum for a while before bearish breakdown could be executed on April 23. Short-term outlook turned to become bearish towards 1.1175 (a previous weekly bottom which has been holding prices above for a while) On May 17-20, a bearish breakdown below 1.1175 was temporarily achieved. As expected, further bearish decline was expected towards 1.1115. This is where significant bullish recovery was demonstrated by the end of Thursday's consolidations bringing the EURUSD pair back above 1.1175. Recently, The EURUSD pair was trapped between the depicted price zones (1.1150-1.1235) until Yesterday when another bearish breakdown was demonstrated below 1.1150. This should enhance the bearish side of the market towards 1.1115. However, conservative traders shouldn't consider any SELL signals at such low prices The material has been provided by InstaForex Company - www.instaforex.com |
| Posted: 29 May 2019 08:30 AM PDT 4-hour timeframe The amplitude of the last 5 days (high-low): 95p – 79p – 86p – 81p – 54p. The average amplitude over the last 5 days: 79p (94p). The volatility of the British pound in recent days fell to 50 points per day. There is no news, as in the case of the euro/dollar pair. This refers to the really important news. Today, the most interesting event was the call to the Westminster Court of the main contender for the post of leader of the Conservative party and the seat of British Prime Minister Boris Johnson. The lawsuit against Boris Johnson was filed by private businessman Marcus Ball, who previously collected 200,000 pounds of donations for the trial, which claims that Johnson lied within the Brexit company in 2016 that the country pays the European Union about 350 million pounds weekly. Immediately in 2016, the UK Statistics Agency denied this information. However, now, after three years, a criminal case may be initiated, since the crime may be classified as official. And according to British law, the punishment for such a crime can even serve a life sentence. Ball's lawyers note that the case does not concern Brexit as such. It's about honesty and openness of high-ranking officials. Johnson's defense claims it's a political stunt. If you dig a little deeper, then this version may be true, since Johnson is the main contender for the Prime Minister's chair, as well as the main opponent of "soft" Brexit and "deal" of Theresa May. Johnson himself claims that in fact the UK had to deduct even more than 350 million pounds a week. The pound sterling has not yet responded to this information. However, in the context of medium and long-term prospects, such information is unlikely to help the British pound and support the bulls in the market. Trading recommendations: The pound/dollar currency pair overcame the Kijun-Sen line and is trying to resume a downward trend. Therefore, it is now recommended to sell the pound sterling with targets at 1.2604 and 1.2576, before the MACD indicator turns up. Long positions can be considered very small lots if the price is fixed back above the Kijun-Sen line with the first target level of 1.2734. In addition to the technical picture should also take into account the fundamental data and the time of their release. Explanation of illustration: Ichimoku Indicator: Tenkan-Sen – red line. Kijun-Sen – blue line. Senkou Span A – light brown dotted line. Senkou Span B – light purple dotted line. Chinkou Span – green line. Bollinger Bands Indicator: 3 yellow lines. MACD Indicator: A red line and a histogram with white bars in the indicator window. The material has been provided by InstaForex Company - www.instaforex.com |
| Posted: 29 May 2019 08:30 AM PDT 4-hour timeframe The amplitude of the last 5 days (high-low): 31p – 81p – 38p – 29p – 39p. The average amplitude over the last 5 days: 44p (45p). The third trading day of the week for the euro/dollar pair is no different from the previous two. No important macroeconomic data, no important reports from world leaders, the euro continues to depreciate against the US dollar. Thus, from a fundamental point of view, there is essentially nothing to analyze. No new details about the course of the trade war between China and the United States, no new threats about the introduction of duties on European imports from the American side. But the euro is still falling. What does this mean? About the same, about which we already wrote previously. Traders continue to look hard to the South, as there is no reason to expect an improvement in the economic situation in the eurozone. Moreover, Europe cannot solve the situation with the release of the UK. Though it is more a problem of the United Kingdom. The situation with the high national debt of Italy also has a negative impact on the reputation of the EU and its investment attractiveness, and Rome, meanwhile, could fall under a heavy fine for failure to fulfill obligations to Brussels. It is unlikely that the Italian side will like it, there may be new conflicts, refusal to pay a fine, and in the future even Itexit ("Italy Exit"). This is, of course, too radical an option, but the very fact that there are problems with Italy cannot be denied. Thus, the bears continue to get rid of the euro, the EUR/USD pair is again approaching the annual lows and this time can successfully overcome them, which, in turn, will open the way for the pair to further fall. Tomorrow, the US will release a preliminary GDP value for the first quarter, which can greatly affect all pairs in which there is a dollar. A high value of the indicator may cause additional demand for the US currency. Trading recommendations: The EUR/USD pair continues its downward movement and overcame the Kijun-Sen line. Thus, sell orders with targets at 1.1138 and 1.1102 are relevant now. Long positions can be considered if traders manage to gain a foothold back above the Kijun-Sen line. In this case, the nearest targets for euro purchases will be the resistance levels of 1.1190 and 1.1244. In addition to the technical picture should also take into account the fundamental data and the time of their release. Explanation of illustration: Ichimoku Indicator: Tenkan-Sen – red line. Kijun-Sen – blue line. Senkou Span A – light brown dotted line. Senkou Span B – light purple dotted line. Chinkou Span – green line. Bollinger Bands Indicator: 3 yellow lines. MACD Indicator: A red line and a histogram with white bars in the indicator window. The material has been provided by InstaForex Company - www.instaforex.com |
| The flames of the trade war may spread to the currency market Posted: 29 May 2019 07:06 AM PDT Against the background of increasing tension in trade relations between Beijing and Washington, the opinion is growing that "military actions" can spread to the foreign exchange market. It is assumed that as compensation for US tariffs, China will begin to devalue the yuan and fold its portfolio of US government bonds. Markets are now considering the mark of 7.0 for the pair USD/CNY as the extreme limit, which the Celestial Empire should not cross to avoid retaliation from the United States both in the foreign exchange market and in the trade sphere. The Chinese national currency is moving in this direction since the beginning of this month, the head of the White House, Donald Trump, announced an increase in duties on imported goods to America from China. In recent months, the currency pair USD/CNY was in the range of 6.7-6.75. It is currently trading near the mark of 6.9. According to some estimates, to compensate for the new tariffs, the yuan should fall to $7.10. Most analysts doubt that China will devalue the national currency in response to the new US tariffs, as this will not only cause a negative reaction from Washington but also accelerate the outflow of capital from China, as well as cause a serious blow to the efforts within the framework of the internationalization of the yuan. Experts also reject the idea that Beijing will start selling US Treasury securities. They proceed from the fact that any sale that affects the value of the US government debt will cause damage to China itself, since the remaining share of treasury bonds at its disposal will be cheaper. In addition, even if the Celestial Empire begins to fold bonds, there will be no shortage of buyers, as the yield of 10-year treasuries over the past few months has decreased from 3 to 2.2%. D. trump took the fall of the yuan as a manipulation of the exchange rate and as a sign that Beijing wants to conclude a trade deal with Washington. "China will pump money into its economy and probably lower interest rates in order to compensate for the loss of its business. If the Federal Reserve retaliates, the game will be over, we will win!"- said the American President. D. Trump would be happy if the Fed gave in to his pressure, lowered interest rates, resumed the program of asset repurchase, thereby reducing the value of the dollar. Some analysts are now wondering whether Washington will raise and expand tariffs on Chinese imports if the USD/CNY pair crosses the mark of 7.0. In this scenario, the yuan could drop to $7.40, as the currency war should intensify as the trade conflict escalates. At the end of last week, the US administration proposed a rule allowing the United States to automatically set tariffs for States suspected of manipulating exchange rates in order to obtain trade advantages. The irony is that if the Fed does not go about D. Trump and will not adjust its policy, the dollar will come out of this conflict as a winner because it is being strengthened as an asset of a "safe haven". At the same time, currencies of emerging markets in a tandem with the yuan will fall in price. The material has been provided by InstaForex Company - www.instaforex.com |
| Posted: 29 May 2019 07:06 AM PDT The European currency ignored the data on the French economy, where GDP coincided with the forecasts of economists, but closer to the middle of the European session, the pressure on EURUSD returned after the release of a weak report on the German labor market. Quite a lot has already been said that the prospects for the German economy are gradually deteriorating, and this was confirmed by a sharp increase in the number of applications for unemployment benefits in May this year, which analysts did not expect. According to the report of the Federal Employment Agency of Germany, in May of this year, the number of unemployed in Germany increased by 60,000 compared with April. Economists, on the contrary, predicted a decline of 8,000. Such a sharp increase in new applications occurred after an inspection was conducted of the employment status of people eligible for unemployment benefits. Another 10,000 new applications came from people who recently lost their jobs due to the economic situation in the country. It did not pass without a trace for the unemployment rate in Germany, which rose to 5.0% in May, after a test of a record high of 4.9% in April of this year. The number of registered vacancies in Germany in May was 792,000. As noted above, the French GDP data was ignored by the market, since all reports almost coincided with economists' forecasts. According to the data, the French economy in the 1st quarter of this year grew by 0.3% compared to the 4th quarter of 2018. In annual terms, growth was 1.2%. Consumer spending in France in April showed growth again and turned out to be better than economists' forecasts, which allows concluding that economic growth continued in the 2nd quarter. According to the statistics agency, spending rose by 0.8% in April, while economists had expected a growth of only 0.3% compared with March. As for the same period in 2018, consumer spending increased by 1.2% with a growth forecast of 0.9%. As for inflation, preliminary data on consumer price growth in France are far from the objectives of the European Central Bank. According to the report, the preliminary CPI in France in May 2019 rose by 0.2% and 1.0% per annum, while the consumer price index was expected to rise in May at the level of 0.2% and 1.1%, respectively. As for the consumer price index harmonized by EU standards, it rose by 1.1% per annum in May compared to 1.5% in April of this year. Maintaining the growth of inflation in the eurozone is one of the main tasks of the European Central Bank because without reaching the target level in the region of 2.0%, there will be no talk about raising interest rates. As for the technical picture of the EURUSD pair, the bears continue to push risky assets down to the support area of 1.1140, the breakthrough of which will easily return the trading instrument to the minimum of this month in the area of 1.1110. As for the British pound, the breakthrough of support 1.2640 did not lead to its big sale. This once again confirms the fact that the major players prefer to stand aside until clarity with the election for the post of British Prime Minister. If the Conservative Party of Great Britain elects its leader as a supporter of hard Brexit, the pound will resume its major downward trend and return to the December minimum around 1.2480. However, the further medium-term downward movement will depend on a parliamentary vote on the subject of Brexit already under the new Prime Minister. The material has been provided by InstaForex Company - www.instaforex.com |
| How to make money on the imminent fall of AUD/USD? Posted: 29 May 2019 07:06 AM PDT
The focus of traders' attention is still the tension in the US-China relationship. Any threats from Donald Trump against Beijing have a strong influence on the market. China is ready to use rare earth elements as weapons in the trade war with America. Metals are used in many industries, including the production of high-tech consumer electronics and military equipment. A week earlier, market participants took Xi Jinping's visit to the JL MAG Rare-Earth Company plant as a hint at how Beijing's response to Washington's new duties could be. The aggravation of rhetoric is a kind of reaction to the harsh statements of Donald Trump, who during his visit to Tokyo made it clear that the Chinese had to grasp the proposed deal with their hands and feet. It's too late now because the US has changed its mind. The long-running trade conflict, whose degree is constantly increasing, aggravates not only the position of the euro but also the Australian dollar. Due to the tight trade relations with China, the "Australian" risks to be one of the main currency assets – the beneficiaries of the economic difficulties of China. As you know, the Chinese financial system is bursting at the seams. The chain of corporate defaults, which hit the Chinese market in January-April, reached the banking sector. A bank collapsed in the country, and it happened for the first time in two decades. Recently, the Central Bank of China announced the beginning of the rehabilitation of Baoshang Bank, whose total assets amount to $83 billion. The Reserve Bank of Australia has taken a policy of easing monetary policy, as it foresees a significant slowdown in the Chinese economy. JP Morgan expects the Central Bank to reduce the rate by 100 basis points by the middle of next year, to 0.50% from the current level of 1.50% by the middle of next year. It should be noted that the first decline will occur at the meeting of the regulator next Tuesday, June 4. According to the markets, only soft monetary policy can be an assistant to the RBA in achieving macroeconomic goals. Otherwise, inflation and GDP growth rates will continue to lag behind the targets. Thus, a promising idea for the next two weeks may well be the sale of the AUD/USD pair. On Wednesday, "Aussie" in conjunction with the US competitor is trading just above the mark of 0.69. As for the euro, it remains under pressure and continues the negative movement taken at the beginning of the week. In addition to concerns about the escalation of the conflict, the situation of the euro is aggravated by Italian problems with public debt. At the end of the year, the indicator may reach 3.4%, while the ceiling for all regions is set at 3% of GDP. Members of the EC consider the issue of penalties. Rome has already been warned, but political leaders seem to want to run into a conflict with Brussels. The yield spread of 10-year state bonds of Germany and Italy reached its highest level in 3 months, which is a negative factor for the euro. |
| The dollar should fall, instead of increasing Posted: 29 May 2019 07:06 AM PDT Yields on 10-year US Treasury bonds fall to 2-year lows, there is a signal of an imminent recession. In the first quarter, the US economy did not grow as fast as we would like (3% against 3.2% in the first reading), the risks of a single rate cut this year increased. It would seem that all this is not favorable to the dollar, and it is simply obliged to fall, but greenback feels quite confident. So what is its strength? Maybe the weakness of other major currencies, for example, the euro. There are rumors in the market that in the near future, the EU may bring Italy to administrative responsibility for violation of the limits of public debt and budget deficit. The amount of the fine is likely to be 3 billion euros. The ECB representative and Governor of the Bank of Spain Pablo Hernandez de Cos warned of the risks of a slowdown in the European economy. He also questioned the forecast for accelerating inflation in the region due to wage growth. The European currency declined, while the "American" strengthened due to its weakness. Another return of quotes under the level of $1.1180 indicates a weakness of buyers, and the risk of resuming the downward movement is also growing. The trade conflict between the US and China not only continues but also intensifies. From this, the eurozone only gets worse as exports suffer. On the eve, the Chinese press hinted at a secret weapon. We are talking about rare earth metals, which are used in many industries, including the release of high-tech consumer electronics and military equipment. China is known to be one of the main suppliers of rare earth elements to the United States, and rising prices for them can cause serious pain to US consumers. It is worth noting that Washington this time did not declare China a currency manipulator, so as not to aggravate relations. However, the Ministry of Finance has changed the criteria, and the list of suspects now is not 12 countries, but 21. The States intend to monitor regions with foreign trade from $40 billion or more. A currency manipulator can be called one who often intervenes in the financial market, and also has a trade surplus with the United States of $20 billion. Those who have a surplus above 2% of GDP fall out of favor, earlier it was about 3%. Now, on the blacklist along with China, Japan, Germany, and South Korea are such countries as Italy, Ireland, Malaysia, Singapore, and Vietnam. The support of "euromedical" on the eve was provided by the growth of the US consumer confidence index. The value of the indicator approached 18-year highs. This makes you think that in the second quarter, the situation will not be as bad as predicted in Macroeconomic advisors, expecting a rise of 1.7%. The leading indicator from the Atlanta Federal Reserve Bank indicates a 1.3% signal, J.P. Morgan insists on 1%. Now, the EUR/USD pair is trading in a narrow range and is unlikely to go far from the 1.12 mark. The fact is that traders are waiting for the publication of the second estimate of US GDP growth in the first quarter. Market participants are also not in a hurry to force things, because they want to see a report on business activity in China. The material has been provided by InstaForex Company - www.instaforex.com |
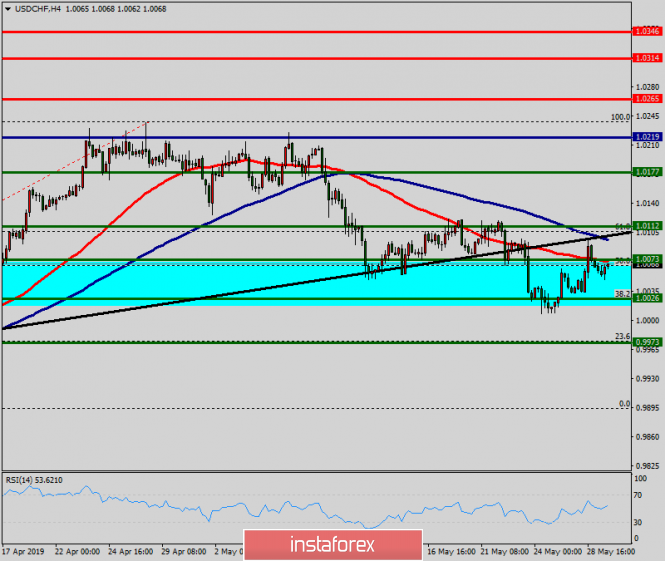
| Technical analysis of USD/CHF for May 29, 2019 Posted: 29 May 2019 06:13 AM PDT The USD/CHF pair continues moving in a bullish trend from the support levels of 1.0123 and 1.0177. Currently, the price is in an upward channel. This is confirmed by the RSI indicator signaling that the pair is still in a bullish trend. As the price is still above the moving average (100), immediate support is seen at 1.0177. Consequently, the first support is set at the level of 1.0177. So, the market is likely to show signs of a bullish trend around 1.0177. In other words, buy orders are recommended above the level of 1.0177 with the first target at the level of 1.0265. Furthermore, if the trend is able to breakout through the first resistance level of 1.0265, we should see the pair climbing towards the point of 1.0314. On the other hand, it would also be wise to consider where to place a stop loss; this should be set below the second support of 1.0126. The material has been provided by InstaForex Company - www.instaforex.com |
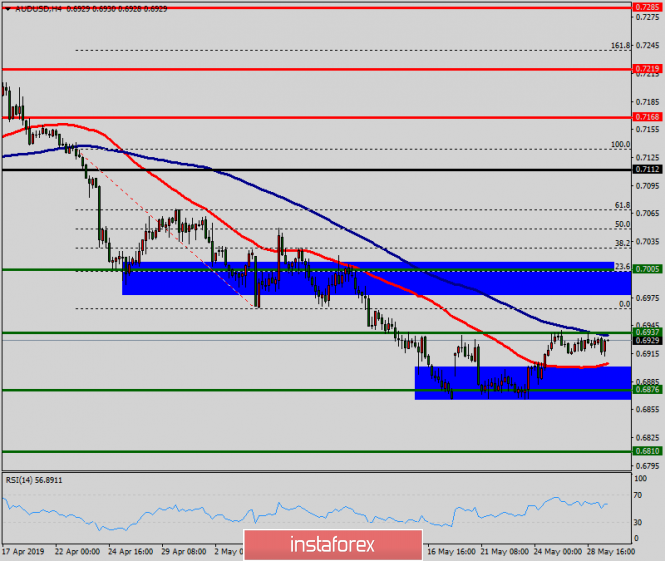
| Technical analysis of AUD/USD for May 29, 2019 Posted: 29 May 2019 06:07 AM PDT The AUD/USD pair is set above strong support at the levels of 0.7046 and 0.7168. This support has been rejected four times confirming the uptrend. The major support is seen at the level of 0.7046, because the trend is still showing strength above it. Accordingly, the pair is still in the uptrend in the area of 0.7046 and 0.7168. The AUD/USD pair is trading in the bullish trend from the last support line of 0.7112 towards thae first resistance level of 0.7168 in order to test it. This is confirmed by the RSI indicator signaling that we are still in the bullish trending market. Now, the pair is likely to begin an ascending movement to the point of 0.7168 and further to the level of 0.7290. The level of 0.7389 will act as the major resistance and the double top is already set at the point of 0.7389. At the same time, if there is a breakout at the support levels of 0.7112 and 0.7046, this scenario may be invalidated The material has been provided by InstaForex Company - www.instaforex.com |
| Posted: 29 May 2019 05:10 AM PDT To open long positions on GBP/USD, you need: Buyers missed the support level of 1.2648, but a major sell-off has not yet occurred, which leaves a chance for an upward correction. However, this requires a return to 1.2648, which will return the demand for GBP/USD and lead to an update of the resistance of 1.2969. This will allow us to count on the rapid growth of the pair to the highs of 1.2744 and 1.2800, where I recommend fixing the profits. With a further decrease in the pound, it is possible to open long positions on a false breakdown from a minimum of 1.2607 or on a rebound from larger monthly support of 1.2564. To open short positions on GBP/USD, you need: The bears achieved their goal and broke below the support of 1.2648. As long as the trade is conducted below this level, the pressure on the pound will continue. However, the main task of the bears is the support of 1.2607, a breakthrough of which will plunge the pair into a new downward peak with the building of a trend and updating of the lows around 1.2564 and 1.2500, where I recommend fixing the profit. With the growth scenario above 1.2648 in the second half of the day, you can return to sales of the pound immediately to rebound from the maximum of 1.2696. Indicator signals: Moving Averages Trading is below 30 and 50 moving averages, indicating a return to the market of the sellers of the pound. Bollinger Bands However, the main problem of a downward trend is low volatility, which does not give signals to enter the market. Description of indicators
|
| Posted: 29 May 2019 05:10 AM PDT To open long positions on EURUSD, you need: The euro continued its downward momentum, formed earlier this week after the data on the growth of unemployment in Germany to 5.0%. To return the upward impulse, buyers need to get above the resistance of 1.1170, where the demand for the euro will increase, which will lead to an update of the highs of 1.1196 and 1.1218, where I recommend fixing the profit. In the event of a decline in the euro further along with the trend, support will be provided by the area of 1.1143, however, to open long positions from it is best provided that a false breakdown is formed. I recommend buying EUR/USD on the rebound only after the test of the minimum of 1.1112. To open short positions on EURUSD, you need: While the trade is below the resistance of 1.1170, the pressure on the euro will remain, but the main task of the bears will be to test a large support level of 1.1143, which will increase the pressure on the pair and lead to an update of the minimum of the month in the area of 1.112, where I recommend fixing the profit. The release of important fundamental data for the US is not planned for the second half of the day, therefore, in case of EUR/USD growth above the resistance of 1.1170, it is best to consider short positions after updating the maximum of 1.1196 or to rebound from the larger level of 1.1218. Indicator signals: Moving Averages Trading is below 30 and 50 moving averages, which indicates the bearish nature of the market. Bollinger Bands In the case of the growth of the euro in the second half of the day, an upward correction will be limited to the upper border of the indicator in the area of 1.1175. Description of indicators
|
| Posted: 29 May 2019 04:28 AM PDT Gold continues to trade in the range of $1270-1310 per ounce, sensitively reacting to the behavior of the dollar, US Treasury bonds, and US stock indices. Despite the fall in rates on 10-year bonds to its lowest level since September 2017, the US currency shows signs of strengthening. It is again perceived by investors as a safe-haven asset, which in the conditions of maintaining trade tensions between Washington and Beijing, deprives the precious metal of an important trump card. During his visit to Japan, Donald Trump said that the States are not ready to deal with China, Beijing is attacking the WTO, arguing that the US is manipulating its national security in order to introduce illegal tariffs, and the Chinese press talks about weapons of retaliation. They can be 17 rare earth metals, which are used in the production of a wide range of goods, including military equipment. Their main supplier to the American market is China, and the rise in prices will hit the consumer's pocket. Obviously, a trade war is a serious and lasting one. The question is who will take better advantage of it: gold, which traditionally grows during the escalation of various conflicts, or the US dollar, which in 2018 intercepted the status of the main asset-shelter not only from the precious metal but also from the yen and the franc. American macroeconomic indicators can give a hint. If last year the economy expanded under the influence of a large-scale fiscal stimulus, this year may be deflated due to weak external demand. The fall in the yield curve of the US in the red zone is increasing the risks of a recession. And this is not the only negative signal. The differential price of gold and silver reached its highest level since 1991 when the States were in a recession. In contrast to XAU/USD, the XAG/USD bulls are experiencing problems due to the slowdown in the global industry under the influence of trade wars. Dynamics of gold and silver Investors will closely monitor the statistics on US GDP and Chinese business activity. According to Bloomberg experts, the US economy expanded not by 3.2%, but by 3%. In April-June, it may be even worse: the leading indicator from the Atlanta Federal Reserve Bank signals a modest growth in the gross domestic product by 1.3%. The peak of purchasing managers' indices in China may strengthen anti-risk sentiment and contribute to the correction of the S&P 500, which should be considered as a "bullish" factor for XAU/USD. Unlike the futures market for gold, the physical asset indicates the untapped potential of falling prices. Swiss net exports in April rose to 142 tons, 80% of the total supply went to Asia. India imported 58.6 tons from this European country, which is the highest figure in two years. As a rule, when gold flows from West to East, the market is dominated by "bears". Technically, consolidation in the range of $1270-1310 per ounce becomes more pronounced. The breakthrough of the lower limit activates the pattern AB=CD with a target of 161.8%. On the contrary, a successful assault on the resistance at $1288 and $1304 will return the bulls hope for the implementation of the "Wolfe Wave" model. The material has been provided by InstaForex Company - www.instaforex.com |
| Posted: 29 May 2019 03:34 AM PDT In this month, the USD/CAD pair has repeatedly tried to subdue the 1.35 mark, but so far, it has not managed to consolidate above this level. Despite a rather positive statistical data from Canada, the USD / CAD pair has been trading upward over the past six weeks. Today, the results of the next meeting of the Bank of Canada (BoC) on monetary policy will be announced. Investors tend to expect cautious rhetoric from the regulator. If they turn out to be right and the Central Bank ignores both of the strengthening of the labor market and the growth of retail sales in the country, then another attempt to storm the 1.35 bulls could be crowned with success. According to the latest data, the Canadian economy is in good shape. In April, the number of jobs in the country increased by a record of 106.5 thousand, reaching the highest level since 1976. The situation also improved in the housing market and growth in manufacturing activity has accelerated. Inflation declined on a monthly basis but returned to the 2% mark in annual terms. At the time of the April BoC meeting, the Canadian economy also showed significant improvement. However, the regulator completely ignored the strong data and lowered its economic forecasts. In addition, the Central Bank expressed concern about the growth prospects of the global economy and the trade war between the United States and China. Since then, the economy of the Maple Leaf has continued to strengthen but trade relations between Washington and Beijing have deteriorated significantly. Oil quotes have declined by more than 10% and stock markets have passed local highs. The Middle Kingdom is the second most important trading partner of Canada after the United States and the prospect of slowing economic growth in both countries poses a greater threat to the six-month BoC forecast. If the regulator goes too far with concern, it may be enough for the USD / CAD pair to close above 1.35 for the first time since the beginning of the year. Meanwhile, the EUR/USD pair continues to decline in anticipation of the final placement of the new political forces in the EU after the recent elections to the European Parliament. "Although the absence of a more dramatic shift to the right is in itself positive for the euro, the growing political division of the Old World could be a burden for the single European currency," said Stefan Bielmeier, chief economist at DZ Bank. According to him, the greatest risks for the euro are the new political crisis in Italy and the collapse of the ruling coalition in Germany. "The initial relief from the fact that populists did not receive a tangible advantage in the elections to the European Parliament was replaced by fears about the lack of a clear majority among the centrists that could lead to political paralysis," said John Hardy, currency strategist at Saxo Bank. "The elections to the European Parliament have ended relatively successfully for the single European currency. However, it remains vulnerable amid sluggish economic growth in the EU and concerns about a possible deterioration in the trade relations between Washington and Brussels," said Jane Foley from Rabobank. "Another risk factor for the euro is to strengthen the position of the Italian eurosceptics, encouraged by the success in the past elections," she added. According to Rabobank's forecast, the EUR / USD pair can sink to the level of 1.10 in the next three months. |
| Trading Plan for EUR / USD pair on 05/29/2019 Posted: 29 May 2019 03:20 AM PDT The euro is under pressure and the US market is rather looking down. Yet, the economy remains strong. There is no reason for a crisis right now. On the market is a stop period. All major topics are deadlocked. The resignation of Prime Minister May in Britain has stopped the situation on Brexit for at least a month. The US-China trade negotiations also halted. The euro is under pressure and the US market is rather looking down. Yet, the economy remains strong. There is no reason for a crisis right now. EUR/USD: Returns to range Moving up and down is equally is expected. We are ready to buy euros from 1.1220. We are ready to sell the euro from 1.1105. |
| Bitcoin dips towards $8,500 area; bullish trend may continue: May 29, 2019 Posted: 29 May 2019 02:01 AM PDT Bitcoin has been bearish with the recent rejection off the $9,000 area which lead the price to reside at the edge of $8,500. However, the bullish bias is still quite strong and expected to continue pushing the price higher with target towards $10,000 in the coming days. As per candlestick arrangements, Bitcoin is within a bullish breakout pattern, thanks to May 26th price spike that temporarily placed BTC at $9,000. Since yesterday's bar closure above $8,500 was confirmed, there is an opportunity to buy at spot rates with the target as aforementioned. It's now abundantly clear that bitcoin and other cryptocurrencies are in a firm uptrend, posting consistent gains on a weekly basis. Every minor pullback acts as fuel for further gains. It now appears that BTC doesn't have any significant resistance until the coveted $10,000 region, which may signal that further gains are imminent. It is important to note that although Bitcoin is currently showing a significant amount of strength at its current price levels, it has not been able to break into the $9,000 region yet. It may signal that the cryptocurrency is going to require a significant influx of buying pressure for it to extend its upwards momentum. As of the current scenario, bitcoin is expected to move higher quite impulsively, and it seems that the upward movement has started and the preceding bullish trend is in place. The price has recently formed the Bullish Divergence as well while it was forming a throwback towards $8,500. As per current price formation and bullish momentum building up, the price is expected to push higher towards $9,000 and later towards $10,000 area in the coming days. SUPPORT: 8,000, 8,400, 8,500 RESISTANCE: 9,000, 9,300, 9,500, 10,000 BIAS: BULLISH MOMENTUM: VOLATILE
|
| Trading concerns and falling yields are pushing the yen upwards Posted: 29 May 2019 01:54 AM PDT The Japanese yen has every chance to continue climbing. The currency strengthened to a two-week high against the dollar amid fears of a further escalation of the trade conflict between the United States and China. Another "surge" sent investors to a safe haven. The reason for this was unexpectedly aggressive rhetoric in the pages of the People's Daily newspaper, which is the official mouthpiece of the ruling Communist Party of China. As a result, the yen rose to 109.15 yen against the dollar, which is the highest level since May 15 this year. However, this is the only sparring where the dollar loses, as it steadily grows against other currencies. Now, investors are considering the dollar as an ideal instrument in the transition period, when global growth is weakening amid trade disputes and political uncertainty. The American currency received an additional impetus after the publication of a report by the US Treasury Department, which states that the agency considered the monetary policy of more than 21 major US trading partners and found that nine of them require close attention due to currency fraud, namely China, Germany, Ireland, Italy, Japan, South Korea, Malaysia, Singapore and Vietnam. According to the United States, these countries deliberately holding back the growth of the value of national currencies. The material has been provided by InstaForex Company - www.instaforex.com |
| Burning forecast EURUSD 05/29/2019 Posted: 29 May 2019 01:44 AM PDT There is no important news on the market today. EURUSD: Growth has stopped. The euro fell again under the inexorable pressure of sellers and retreated to 1.1150. The growth has stopped, and we return to the range. However, the exit from the long range and the trend is inevitable. We are ready to buy the euro from 1.1220. We are ready to sell the euro from 1.1105. |


| You are subscribed to email updates from Forex analysis review. To stop receiving these emails, you may unsubscribe now. | Email delivery powered by Google |
| Google, 1600 Amphitheatre Parkway, Mountain View, CA 94043, United States | |
No comments:
Post a Comment