
2017-08-29

Monthly Outlook
In January 2015, the EUR/USD pair moved below the major demand levels near 1.2100 (multiple previous bottoms set in July 2012 and June 2010). Hence, a long-term bearish target was projected toward 0.9450.
In March 2015, EUR/USD bears challenged the monthly demand level around 1.0500, which had been previously reached in August 1997.
In the longer term, the level of 0.9450 remains a projected target if any monthly candlestick achieves bearish closure below the depicted monthly demand level of 1.0500.
However, the EUR/USD pair has been trapped within the depicted consolidation range (1.0500-1.1450) until the current bullish breakout was executed above 1.1450.
The current bullish breakout above 1.1450 allows a quick bullish advance towards 1.2100 where price action should be watched for evident bearish rejection and a valid SELL Entry.

Daily Outlook
In January 2017, the previous downtrend reversed when the Head and Shoulders pattern was established around 1.0500. Since then, evident bullish momentum has been expressed on the chart.
As anticipated, the ongoing bullish momentum allowed the EUR/USD pair to pursue further bullish advance towards 1.1415-1.1520 (Previous Daily Supply-Zone).
The daily supply zone failed to pause the ongoing bullish momentum. Instead, an evident bullish breakout is being witnessed on the chart. The nearest supply level to meet the pair is located around 1.2080-1.2100 (Level of previous multiple bottoms) where bearish rejection can be anticipated.
On the other hand, the price zone of 1.1415-1.1520 should be watched for a valid BUY entry if a bearish pullback occurs soon.
NZD/USD Intraday technical levels and trading recommendations for August 29, 2017
2017-08-29

Daily Outlook
In February 2017, the depicted short-term downtrend was initiated around the depicted supply zone (0.7310-0.7380).
However, a recent bullish breakout above the downtrend line took place on May 22. Since then, the market has been bullish as depicted on the chart.
The price zone of 0.7150-0.7230 (Key-Zone) stood as a temporary resistance zone until a bullish breakout was expressed above 0.7230.
This resulted in a quick bullish advance towards the next supply zone around 0.7310-0.7380 which was temporarily breached to the upside.
The recent bearish pullback was executed towards the price zone of 0.7310-0.7380 (newly-established demand-zone) which failed to offer enough bullish support for the NZD/USD pair.
Re-consolidation below the price level of 0.7300 enhances the bearish side of the market. This brings the NZD/USD pair again towards 0.7230-0.7150 (Key-Zone) where recent weak bullish recovery was manifested on August 16.
On the other hand, an atypical Head and Shoulders pattern is being expressed on the depicted chart indicating a high probability of bearish reversal.
Breakdown of the neckline 0.7150 confirms the reversal pattern. Expected bearish targets are located around 0.7050, 0.6925 and eventually 0.6800.
Technical analysis of USD/CHF for August 29, 2017
2017-08-29
Overview:
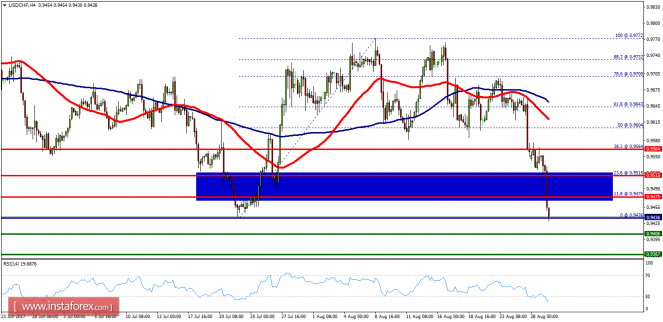
The USD/CHF pair has faced strong resistances at the levels of 0.9475 because support had become resistance on August 29, 2017. So, the strong resistance has been already formed at the level of 0.9475 and the pair is likely to try to approach it in order to test it again. However, if the pair fails to pass through the level of 0.9475, the market will indicate a bearish opportunity below the new strong resistance level of 0.9475. Moreover, the RSI starts signaling a downward trend, as the trend is still showing strength above the moving average (100) and (50). Thus, the market is indicating a bearish opportunity below the area of 0.9475/0.9500 so it will be good to sell at 0.9475 with the first target of 0.9406. It will also call for a downtrend in order to continue towards 0.9367. The daily strong support is seen at 0.9367. However, the stop loss should always be taken into account, for that it will be reasonable to set your stop loss at the level of 0.9515.
The USD/CHF pair has faced strong resistances at the levels of 0.9475 because support had become resistance on August 29, 2017. So, the strong resistance has been already formed at the level of 0.9475 and the pair is likely to try to approach it in order to test it again. However, if the pair fails to pass through the level of 0.9475, the market will indicate a bearish opportunity below the new strong resistance level of 0.9475. Moreover, the RSI starts signaling a downward trend, as the trend is still showing strength above the moving average (100) and (50). Thus, the market is indicating a bearish opportunity below the area of 0.9475/0.9500 so it will be good to sell at 0.9475 with the first target of 0.9406. It will also call for a downtrend in order to continue towards 0.9367. The daily strong support is seen at 0.9367. However, the stop loss should always be taken into account, for that it will be reasonable to set your stop loss at the level of 0.9515.


No comments:
Post a Comment