

Our target which we predicted in Yesterday's analysis has been hit. The pair is still under pressure and expected to continue its downside movement. Despite the recent rebound from 0.7185, the pair is still trading below the declining 50-period moving average, which plays a resistance role. The upside potential should be limited by the key resistance at 0.7230.
Hence, as long as this key level is not surpassed, look for a further decline to 0.7150 and even to 0.7135 in extension.
The black line shows the pivot point. Currently, the price is above the pivot point, which indicates the bullish position. If it remains below the pivot point, it will indicate the short position. The red lines show the support levels and the green line indicates the resistance levels. These levels can be used to enter and exit trades.
Resistance levels: 0.7280, 0.7300, and 0.7325
Support levels: 0.7190, 0.7150, and 0.7100
Technical analysis of GBP/JPY for August 31, 2017
2017-08-31
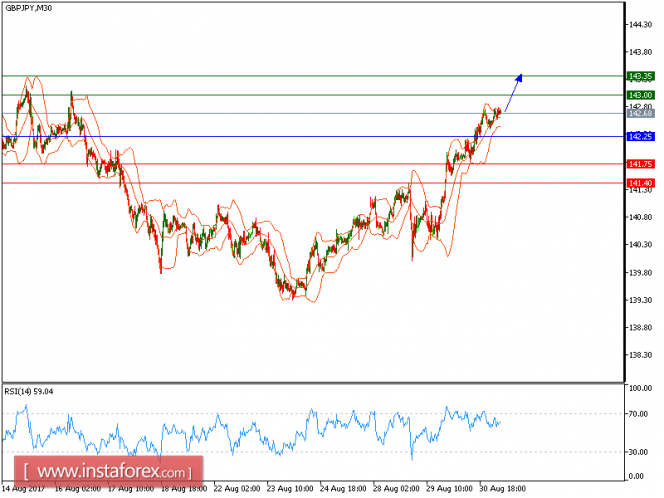
Our targets which we predicted in yesterday's analysis has been hit. we are still long on GBP/JPY as it is expected to trade with a bullish outlook. The intraday outlook remains positive on the prices. A support base at 130.95 has formed and has allowed for a temporary stabilization. In addition, the relative strength index is turning up and also broke above its neutrality area at 50, confirming a bullish outlook.
To sum up, as long as 142.25 is a support level, look for further advance to 143 and 143.35 in extension.
Alternatively, if the price moves in the direction opposite to the forecast, a short position is recommended below 142.25 with the target at 141.75.
Strategy: BUY, Stop Loss: 142.25, Take Profit: 143.00.
Chart Explanation: the black line shows the pivot point. The price above the pivot point indicates the bullish position; and when it is below the pivot points, it indicates a short position. The red lines show the support levels and the green line indicates the resistance levels. These levels can be used to enter and exit trades.
Resistance levels: 143.000, 143.35, and 143.85
Support levels: 141.75, 141.40, and 141.00
Technical analysis of USD/CHF for August 31, 2017
2017-08-31

USD/CHF is expected to continue its upside movement. The technical picture of the pair is positive as the prices recorded higher tops and higher bottoms. The relative strength index is bullish and calls for a further upside.
The U.S. Commerce Department reported that GDP grew at a 3.0% annual rate in the second quarter, higher than +2.6% estimated previously and the strongest growth since the first quarter of 2015.
Besides, payroll processor Automatic Data Processing (ADP) reported that the U.S. private sector added 237,000 jobs in August (vs. +185,000 jobs expected), the biggest monthly increase in five months.
To conclude, as long as 0.9575 is not broken, look for a new challenge to 0.9670 and even to 0.9700 in extension.
Chart Explanation: The black line shows the pivot point. The present price above the pivot point indicates the bullish position, and the price below the pivot points indicates the short position. The red lines show the support levels and the green line indicates the resistance levels. These levels can be used to enter and exit trades.
Strategy: BUY, Stop Loss: 0.9575, Take Profit: 0.9670
Resistance levels: 0.9670, 0.9700, and 0.9745
Support levels: 0.9535, 0.9505, and 0.9475
Technical analysis of USD/JPY for August 31, 2017
2017-08-31

USD/JPY is expected to continue its upside movement. The pair is holding on the upside and is trading above its ascending 20-period and 50-period moving averages, which play support roles. The relative strength index is bullish and calls for a further advance.
To conclude, as long as 109.85 is not broken, look for a new rise to 110.85 and even to 111.25 in extension.
Alternatively, if the price moves in the opposite direction, a short position is recommended below 109.85 with a target at 109.50.
Chart Explanation: The black line shows the pivot point. The current price above the pivot point indicates a bullish position, while the price below the pivot point is a signal for a short position. The red lines show the support levels and the green line indicates the resistance level. These levels can be used to enter and exit trades.
Strategy: BUY, Stop Loss: 109.85, Take Profit: 110.85
Resistance levels: 110.85, 111.25, and 111.70
Support Levels: 109.50, 109.00, 108.45


No comments:
Post a Comment