
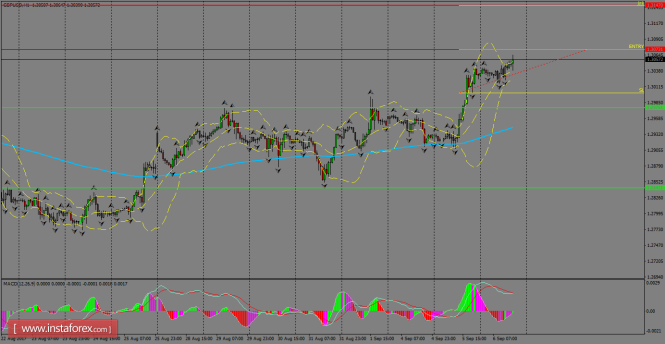
MACD indicator is entering the positive territory, favoring to the bulls.
Show full picture H1 chart's resistance levels: 1.3073 / 1.3147
H1 chart's support levels: 1.2976 / 1.2842
Trading recommendations for today: Based on the H1 chart, buy (long) orders only if the GBP/USD pair breaks a bullish candlestick; the resistance level is at 1.3073, take profit is at 1.3147 and stop loss is at 1.3000.
The price is approaching major resistance at 1.3053 (Multiple Fibonacci extensions, horizontal overlap resistance) and we expect a strong reaction off this level to push the price down to at least 1.2913 support (Fibonacci retracement, horizontal swing low support). Stochastic (34,5,3) is seeing major resistance at 93% where we expect a corresponding drop from. Sell below 1.3053. Stop loss is at 1.3120. Take profit is at 1.2913.
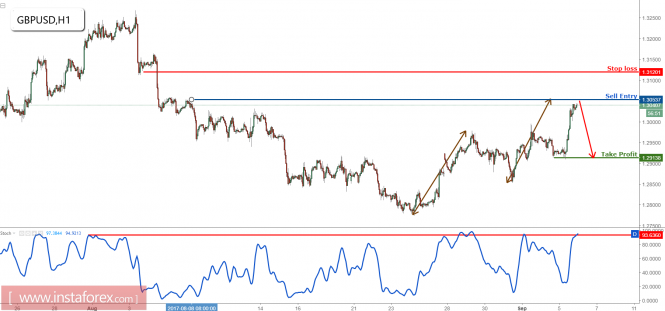
The price is approaching major resistance at 1.3053 (Multiple Fibonacci extensions, horizontal overlap resistance) and we expect a strong reaction off this level to push the price down to at least 1.2913 support (Fibonacci retracement, horizontal swing low support). Stochastic (34,5,3) is seeing major resistance at 93% where we expect a corresponding drop from. Sell below 1.3053. Stop loss is at 1.3120. Take profit is at 1.2913.


No comments:
Post a Comment