
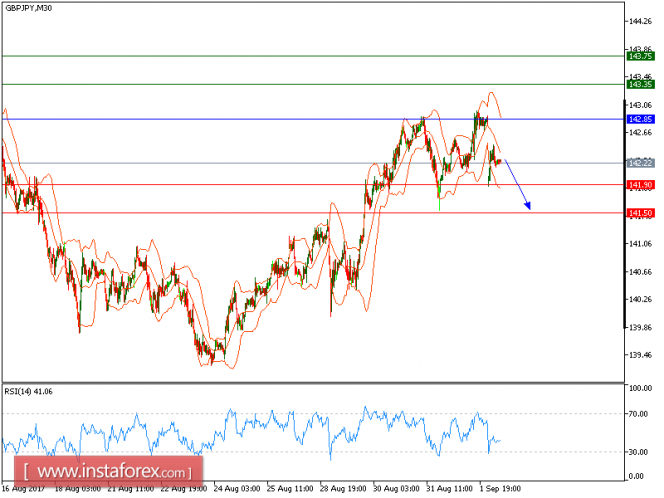
Show full picture GBP/JPY is under pressure and expected to trade with a bearish outlook. The pair remains capped by its falling 20-period and 50-period moving averages and is likely to post a further decline. The nearest key resistance at 142.85 maintains the strong selling pressure on the prices. Besides, the relative strength index is negative below its neutrality area at 50. Therefore, as long as 142.85 is not surpassed, look for a new pullback to 141.90 and 141.50 in extension. Alternatively, if the price moves in the direction opposite to the forecast, a long position is recommended below 142.85 with the target at 143.35.
Strategy: SELL, Stop Loss: 142.85, Take Profit: 141.90. Chart Explanation: the black line shows the pivot point. The price above the pivot point indicates the bullish position; and when it is below the pivot points, it indicates a short position. The red lines show the support levels and the green line indicates the resistance levels. These levels can be used to enter and exit trades. Resistance levels: 143.35, 143.75, and 144.35 Support levels: 141.90, 141.50, and 141.00
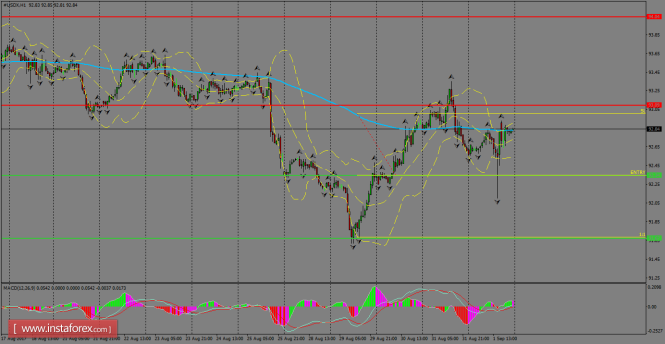
Technical analysis of USD/JPY for Sept 04, 2017
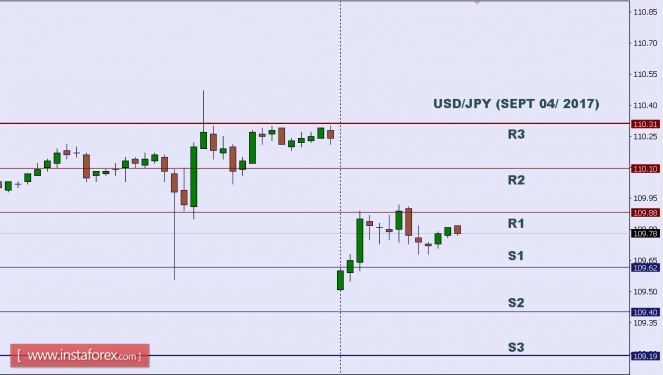
In Asia, Japan will release the Monetary Base y/y data, and today the US will not release any Economic Data. So, there is a probability the USD/JPY will move with low volatility during this day.
TODAY'S TECHNICAL LEVEL:
Resistance. 3: 110.31.
Resistance. 2: 110.10.
Resistance. 1: 109.88.
Support. 1: 109.62.
Support. 2: 109.40.
Support. 3: 109.19.
Disclaimer: Trading Forex (foreign exchange) on margin carries a high level of risk, and may not be suitable for all investors. The high degree of leverage can work against you as well as for you. Before deciding to invest in foreign exchange you should carefully consider your investment objectives, level of experience, and risk appetite. The possibility exists that you could sustain a loss of some or all of your initial investment and therefore you should not invest money that you cannot afford to lose. You should be aware of all the risks associated with foreign exchange trading, and seek advice from an independent financial advisor if you have any doubts.
Daily analysis of GBP/USD for September 04, 2017
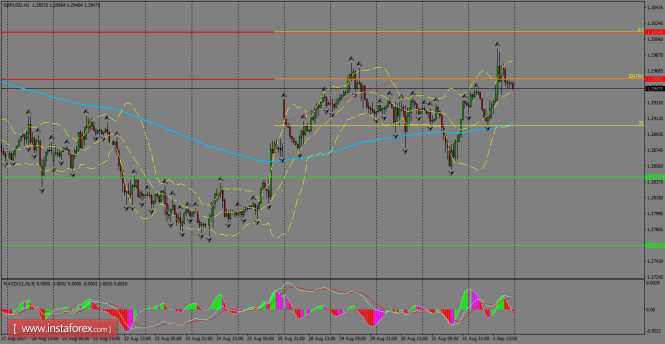
GBP/USD is still dominated by the bulls in the short-term amid USD weakness. Technically, the pair is consolidated above the 200 SMA at H1 chart and it's expected to continue higher in the near-term, at least towards the resistance zone of 1.3014. Bollinger bands are trying to expand and it's a sign that the pair is entering into overbought territory.
H1 chart's resistance levels: 1.2958 / 1.3013 H1 chart's support levels: 1.2842 / 1.2761 Trading recommendations for today: Based on the H1 chart, buy (long) orders only if the GBP/USD pair breaks a bullish candlestick; the resistance level is at 1.2958, take profit is at 1.3013 and stop loss is at 1.2903.
Technical analysis of EUR/USD for Sept 04, 2017
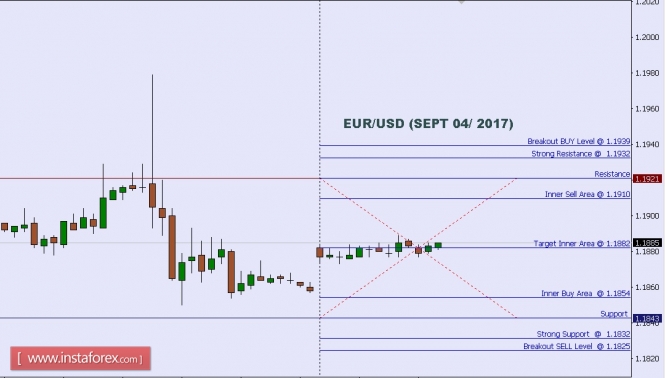
When the European market opens, some Economic Data will be released, such as PPI m/m, Sentix Investor Confidence, and Spanish Unemployment Change. Today the US will not release any Economic Data, so, amid the reports, EUR/USD will move in a low volatility during this day.
TODAY'S TECHNICAL LEVEL:
Breakout BUY Level: 1.1939.
Strong Resistance:1.1932.
Original Resistance: 1.1921.
Inner Sell Area: 1.1910.
Target Inner Area: 1.1882.
Inner Buy Area: 1.1854.
Original Support: 1.1843.
Strong Support: 1.1832.
Breakout SELL Level: 1.1825.
Disclaimer:
Trading Forex (foreign exchange) on margin carries a high level of risk, and may not be suitable for all investors. The high degree of leverage can work against you as well as for you. Before deciding to invest in foreign exchange you should carefully consider your investment objectives, level of experience, and risk appetite. The possibility exists that you could sustain a loss of some or all of your initial investment and therefore you should not invest money that you cannot afford to lose. You should be aware of all the risks associated with foreign exchange trading, and seek advice from an independent financial advisor if you have any doubts.
Daily analysis of USDX for September 04, 2017
USDX is hovering around the 200 SMA at H1 chart, but the outlook is still pointing to the downside for the short-term. Fractals have been formed in the recent higher and lower swings and that's why our preferred scenario is a sideways range established between the 93.09 and 92.34 levels at which the index could be moving during the first days of the week.
H1 chart's resistance levels: 93.09 / 94.04
H1 chart's support levels: 92.34 / 91.67
Trading recommendations for today: Based on the H1 chart, place sell (short) orders only if the USD Index breaks with a bearish candlestick; the support level is at 92.34, take profit is at 91.67 and stop loss is at 93.00.
InstaForex analytical reviews will make you fully aware of market trends! Being an InstaForex client, you are provided with a large number of free services for efficient trading.
The dollar will remain under pressure
The US dollar finished the week with a decline, failing to find a positive driver from the published macroeconomic data, as political risks in the eyes of investors clearly have a higher price. According to the US Department of Commerce, personal spending rose in July at the highest rate since February, and incomes - at its highest since April. These data are positive for the dollar and indicate a resumption of consumer activity. At the same time, the price index of spending on personal consumption has not changed, indicating weak inflationary pressures and endangering the Fed's plans to raise the rate again this year. The growth in the number of new jobs in the non-agricultural sector of the US slowed to 156, 000 in August from 189, 000 a month earlier. The result was significantly worse than expected, but still reflects a strong job market recovery. After the decline of unemployment to 4.3% and achieving, according to the Ministry of Labor, full employment, the pace of creating new jobs should objectively slow, so the August result can not be considered negative and will not affect the Fed's plans.
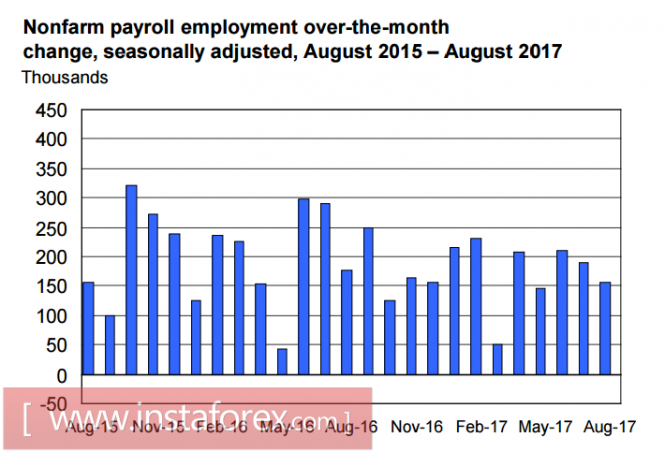
More important is the weak increase in average wages, which was able to show an increase of just 0.1% against 0.3% in July, and this is less than the expected + 0.2%. The annual growth rate of average earnings is 2.5% for 5 consecutive months, and the dynamics as a whole looks rather weak, since it does not allow to give a positive outlook on the growth of inflation. In general, the growth of the US economy does not cause concern. The GDP growth rate for the 2nd quarter was revised from 2.7% to 3.0%. PMI Markit index in the manufacturing sector increased to 52.8p in August, while the same index from the ISM shows a record growth of 58.8p, which is the highest since November 2014. While there is a slight decrease in the level of consumer confidence from 97.6 to 96.8p, according to the University of Michigan, it reflects the likelihood of escalating political risks, and not fears of citizens for their financial well-being. Thus, the Fed faces only one macroeconomic hurdle: low inflation. It may prevent the Fed from raising the rate in September and postpone this move until December, but it does not prevent the plan to begin a reduction in the balance sheet. US Treasury Secretary Steven Mnuchin said last week that the preparation of the tax reform is in full swing, as the reform plan is being distributed to members of the Congress, and its deliberation is planned before the end of this year. On Monday, Congress comes out of vacation, and there may be comments by Congressmen on the prospects for reform, which can cause additional volatility of the dollar. The Congress will have to solve many other pressing problems. There is the matter of September 29 - the deadline for approval of a new ceiling of the national debt. Without the resolution of this issue, the budget for the new 2018 fiscal year can not be approved. Mnuchin has already rushed to announce that the period of debate of the issue of state debt can be shifted to October due to the growth of unplanned expenses related to Hurricane Harvey. Thus, political risks and uncertainty on key issues, such as tax reform, the debt ceiling and the budget for the new financial year, do not allow bulls to seize the push in the dollar. On Monday in the US and Canada, due to the banking day off, trading activity will be low. On Tuesday - there is the publication of the report on production orders in July. On Wednesday, there is a need to pay attention to the ISM index in the service sector. Also, the impact of refined estimates of Hurricane Harvey's damage on the economy on the mood of investors will be seen. The dollar will remain under pressure. The growth of gold last week was primarily due to fears of further weakening of the dollar, since the head of the Federal Reserve, Janet Yellen, during the Jackson-Hole meeting, did not give a single strong signal, and until the new statements of Committee members, the bulls will have nothing to rely on. Pay attention to the speech on Friday the head of the Federal Reserve Bank of New York, William Dudley, who is considered very influential in terms of developing the monetary policy of the Fed.


No comments:
Post a Comment