
2017-10-11

Overview:
The USD/CHF pair broke resistance which turned to strong support at the level of 0.9708.
The level of 0.9708 coincides with the ratio of 23.6% of Fibonacci, which is expected to act as major support today.
The Relative Strength Index (RSI) is considered overbought because it is above 30. The RSI is still signaling that the trend is upward as it is still strong above the moving average (100).
This suggests the pair will probably go up in coming hours.
Accordingly, the market is likely to show signs of a bullish trend. In other words, buy orders are recommended above 0.9708 with the first target at the level of 0.9772.
From this point, the pair is likely to begin an ascending movement to the point of 0.9816 and further to the level of 0.9836.
The level of 0.9816 will act as strong resistance and the double top is already set at the point of 0.9836.
On the other hand, if a breakout happens at the support level of 0.9700, then this scenario may become invalidated.
Technical analysis of NZD/USD for October 11, 2017
2017-10-11

Overview:
The NZD/USD didn't make significant movement yesterday. There are no changes in my technical outlook. The bias remains bearish in the nearest term testing 0.7000 or higher. Immediate support is seen around 0.7087. The NZD/USD pair fell from the level of 0.7128 towards 0.7087. Now, the price is set at 0.7069 to act as a minor support. It should be noted that volatility is very high for that the NZD/USD pair is still moving between 0.7128 and 0.7040 in coming hours. Furthermore, the price has been set below the strong resistance at the levels of 0.7169 and 0.7220, which coincides with the 23.6% and 38.2% Fibonacci retracement level respectively. Additionally, the price is in a bearish channel now. Amid the previous events, the pair is still in a downtrend. From this point, the NZD/USD pair is continuing in a bearish trend from the new resistance of 0.7128. Thereupon, the price spot of 0.7128/0.7087 remains a significant resistance zone. Therefore, a possibility that the NZD/USD pair will have downside momentum is rather convincing and the structure of a fall does not look corrective. In order to indicate a bearish opportunity below 1.0020, sell below 0.7128 or 0.7087 with the first targets at 0.7040 and 0.7000 (support 3). However, the stop loss should be located above the level of 0.7169.
Technical analysis of USD/JPY for Oct 11, 2017
2017-10-11
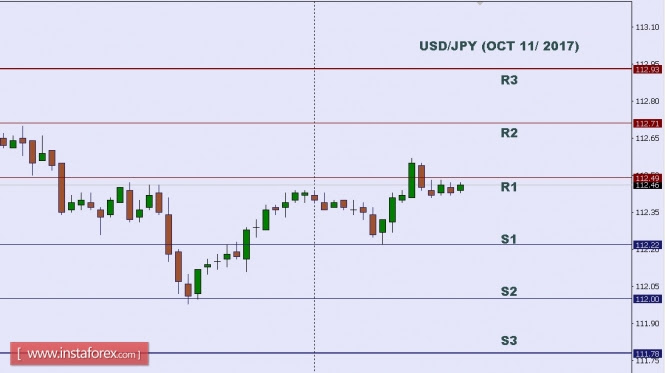
In Asia, Japan will release the Prelim Machine Tool Orders y/y, 30-y Bond Auction, and Core Machinery Orders m/m data, and the US will release some Economic Data, such as FOMC Meeting Minutes, 10-y Bond Auction, and JOLTS Job Openings. So, there is a probability the USD/JPY will move with low to medium volatility during this day.
TODAY'S TECHNICAL LEVEL:
Resistance. 3: 112.93.
Resistance. 2: 112.71.
Resistance. 1: 112.49.
Support. 1: 112.22.
Support. 2: 112.00.
Support. 3: 111.78.
Disclaimer: Trading Forex (foreign exchange) on margin carries a high level of risk, and may not be suitable for all investors. The high degree of leverage can work against you as well as for you. Before deciding to invest in foreign exchange you should carefully consider your investment objectives, level of experience, and risk appetite. The possibility exists that you could sustain a loss of some or all of your initial investment and therefore you should not invest money that you cannot afford to lose. You should be aware of all the risks associated with foreign exchange trading, and seek advice from an independent financial advisor if you have any doubts.
Technical analysis of EUR/USD for Oct 11, 2017
2017-10-11
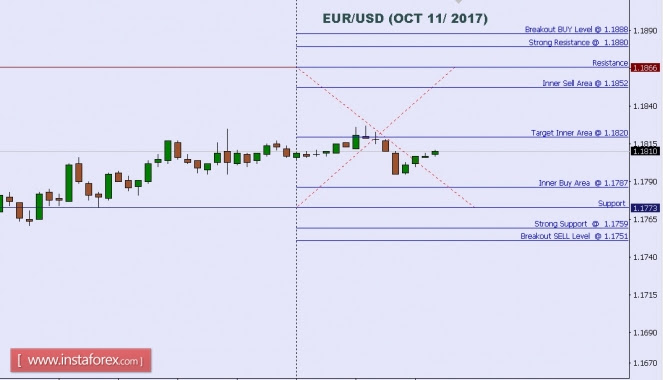
When the European market opens, there is no Economic Data will be released from the Euro Zone, but the US will release the Economic Data, such as FOMC Meeting Minutes, 10-y Bond Auction, and JOLTS Job Openings, so, amid the reports, EUR/USD will move in a low to medium volatility during this day.
TODAY'S TECHNICAL LEVEL:
Breakout BUY Level: 1.1888.
Strong Resistance:1.1880.
Original Resistance: 1.1866.
Inner Sell Area: 1.1852.
Target Inner Area: 1.1820.
Inner Buy Area: 1.1787.
Original Support: 1.1773.
Strong Support: 1.1759.
Breakout SELL Level: 1.1751.
Disclaimer: Trading Forex (foreign exchange) on margin carries a high level of risk, and may not be suitable for all investors. The high degree of leverage can work against you as well as for you. Before deciding to invest in foreign exchange you should carefully consider your investment objectives, level of experience, and risk appetite. The possibility exists that you could sustain a loss of some or all of your initial investment and therefore you should not invest money that you cannot afford to lose. You should be aware of all the risks associated with foreign exchange trading, and seek advice from an independent financial advisor if you have any doubts.
Elliott wave analysis of EUR/JPY for October 11, 2017
2017-10-11

Wave summary:
The break above minor resistance at 132.77 indicates that wave B still is developing and likely will spike higher to 133.25 before tuning lower towards 130.52 and likely even closer to 128.85. A break below support at 132.64 will indicate that wave C lower towards at least 130.52 is developing.
R3: 133.25
R2: 133.00
R1: 132.85
Pivot: 132.64
S1: 132.28
S2: 131.84
S3; 131.34
Trading recommendation:
Our stop at 132.80 was hit for a small profit. We will sell EUR again at 133.15 or upon a break below 132.64 with stop placed at 134.45.
Elliott wave analysis of EUR/NZD for October 11, 2017
2017-10-11

Wave summary:
EUR/NZD is currently testing the "old" top at 1.6690, but it should just be a matter of time before a break above here is seen as a continuation higher to 1.6712 and 1.7038 as the next upside targets.
Support is now seen at 1.6563, which should be able to protect the downside for the next rally higher.
R3: 1.6763
R2: 1.6712
R1: 1.6690
Pivot: 1.6650
S1: 1.6627
S2: 1.6600
S3: 1.6563
Trading recommendation:
We are long EUR from 1.6365 and we will move our stop higher to 1.6550. If you are not long EUR yet, then buy near 1.6630 or upon a break above 1.6690 and use the same stop at 1.6650.
Fundamental Analysis of GBP/USD for October 11, 2017
2017-10-11
GBP/USD has been in a non-volatile bearish trend recently and currently residing below the resistance level of 1.3220. There has been some tension growing about the Brexit process and Prime Minister May is going through tough times. Moreover, No-deal Eurozone talk is expected to hit the UK economy badly and lead to further weakness of Pound against USD in the coming days. Yesterday, GBP Manufacturing Production report was published with an unchanged figure of 0.4% which was expected to be decreased to 0.2%, Goods Trade Balance report was published with an increased deficit of -14.2B from the previous figure of -12.8B which was expected to show less deficit to -11.4B, Construction Output report was published with an increase to 0.6% from the negative value of -1.0% which was expected to be at 0.0% and Industrial Production report was published as expected at 0.2% which decreased from the previous value of 0.3%. Today there is no GBP news to be published whereas, on the USD side, FOMC Member Kaplan is going to speak about nation's key interest rates and future monetary policies which are expected to be neutral in nature and JOLTS Job Opening report is expected to decrease to 6.13M from the previous figure of 6.17M. Though due to holidays and worse economic reports published recently on USD, the pair is currently struggling to provide any directional movement, but USD is expected to gain momentum against GBP in the coming days.
Now let us look at the technical view, the price is currently residing below the resistance area of 1.3220-50 which is expected to proceed down towards 1.2850 in the coming days. As of the current situation, the bullish pressure has been skewed down around the resistance area which is expected to wear out as the bears step in the market to take the price lower towards the upcoming support level. As the price remains below the dynamic level of 20 EMA and resistance area of 1.3220-50 the bearish bias is expected to continue further.

Technical analysis of NZD/USD for October 11, 2017
2017-10-11

NZD/USD is expected to trade with a bearish outlook as the key resistance at 0.7095. The pair is under pressure below the key resistance at 0.7095. The relative strength index lacks upward momentum. The U.S. dollar continued to lose ground to the euro and the British pound which were boosted by upbeat economic data.
Therefore, as long as 0.7095 holds on the upside, a return to 0.7030 is expected. A break below this level would trigger a new drop to 0.7000.
The black line is showing the pivot point. Currently, the price is above the pivot point, which indicates long positions. If it remains below the pivot point, it will indicate short positions. The red lines are showing the support levels and the green line is indicating the resistance levels. These levels can be used to enter and exit trades.
Resistance levels: 0.7120, 0.7145, and 0.7170
Support levels: 0.7030, 0.7000, and 0.6955
Technical analysis of USD/CHF for October 11, 2017
2017-10-11

Our both targets which we predicted in yesterday's analysis has been hit. USD/CHF is still under pressure and still expected to move downwards. The pair is capped by a declining trend line since Oct. 9, which confirmed a bearish outlook. The downward momentum is further reinforced by both falling 20-period and 50-period moving averages. The relative strength index is bearish, calling for another downside.
U.S. government bonds showed signs of stabilization following recent declines, with the benchmark 10-year Treasury yield declining to 2.343% from 2.370% in the previous trading session.
The U.S. dollar continued to lose ground to the euro and the British pound which were boosted by upbeat economic data
Hence, below 0.9770, look for a new test with targets at 0.9710 and 0.9695 in extension.
Chart Explanation: The black line shows the pivot point. The present price above the pivot point indicates a bullish position, and the price below the pivot points indicates a short position. The red lines show the support levels and the green line indicates the resistance levels. These levels can be used to enter and exit trades.
Strategy: SELL, Stop Loss: 0.9770, Take Profit: 0.9710
Resistance levels: 0.9790, 0.9805, and 0.9845
Support levels: 0.9710, 0.9695, and 0.9650
Technical analysis of GBP/JPY for October 11, 2017
2017-10-11

GBP/JPY is expected to trade with a bullish outlook above 147.80. The pair has turned up and is likely to continue a new rebound. The rising 20-period and 50-period moving averages play well support roles. Besides, the relative strength index is bullish, calling for further upside.
Therefore, as long as 147.80 is not broken, look for a further advance to 149 and 149.50 in extension.
Alternatively, if the price moves in the direction opposite to the forecast, a short position is recommended below 147.80 with the target at 147.40.
Strategy: BUY, Stop Loss: 147.80, Take Profit: 149.0
Chart Explanation: the black line shows the pivot point. The price above the pivot point indicates long positions; and when it is below the pivot points, it indicates short positions. The red lines show the support levels and the green line indicates the resistance levels. These levels can be used to enter and exit trades.
Resistance levels: 149.00, 149.50 and 150.05
Support levels: 147.40, 146.90, and 146.10
Get Bonus No Deposite in your Trading Account now and add this currency pair to your forex portfolio, enjoy your trading with us!


No comments:
Post a Comment