2017-11-28

Wave summary:
Our preferred count remains bearish for a decline towards the ideal target at 123.43 in wave (E). The decline from 134.50 to 131.42 is counted as minor wave i and the following rally to 133.89 as wave ii. Wave iii is currently developing and should take us lower to at least 128.91 on the way lower to the ideal (E) wave target.
Short-term a break below minor support at 132.06 will add downside pressure, while a break below 131.14 will confirm the decline to 128.91.
R3: 133.89
R2: 133.24
R1: 132.72
Pivot: 132.06
S1: 131.80
S2: 131.61
S3: 131.14
Trading recommendation:
We we missed our EUR selling with just 1 pip yesterday, we will sell EUR again either at 132.45 or upon a break below 132.05.
Elliott wave analysis of EUR/NZD for November 28, 2017
2017-11-28

Wave summary:
The corrective rally from 1.7134 was stronger than expected but peaked at 1.7393 and renewed downside pressure towards 1.6619 is now expected. A break below support at 1.7134 will confirm the expected decline.
Short-term resistance is seen at 1.7296 that should be able to cap the upside for the break below important support at 1.7134.
R3: 1.7296
R2: 1.7249
R1: 1.7220
Pivot: 1.7134
S1: 1.7100
S2: 1.7045
S3: 1.7000
Trading recommendation:
We sold EUR at 1.7200 with our stop placed at 1.7415.
Analysis of USDPLN 28.11.2017
Tuesday, 28 November 2017

The price is below the moving average MA 200 and 20 MA, indicating the downward trend.
The MACD is below the zero level.
The oscillator Force Index is below the zero level.
If the level of support is broken, you shall follow recommendations below:
• Timeframe: H4
• Recommendation: Short Position
• Entry Level: Short Position 3.5100
• Take Profit Level: 3.4800 (300 pips)
If the price rebound from support level, you shall follow recommendations below:
• Timeframe: H4
• Recommendation: Long Position
• Entry Level: Long Position 3.5400
• Take Profit Level: 3.5500 (100 pips)
Ichimoku indicator analysis of gold for November 28, 2017
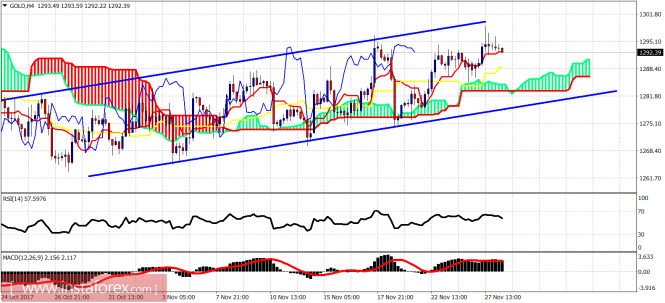
Gold price continues to trade inside the upward sloping trading range but in an overlapping price formation. Price reached the upper channel boundaries yesterday and got rejected. Gold will eventually break lower. My short-term target is at $1,250.

Blue lines - bullish channel
The MACD is below the zero level.
The oscillator Force Index is below the zero level.
If the level of support is broken, you shall follow recommendations below:
• Timeframe: H4
• Recommendation: Short Position
• Entry Level: Short Position 3.5100
• Take Profit Level: 3.4800 (300 pips)
If the price rebound from support level, you shall follow recommendations below:
• Timeframe: H4
• Recommendation: Long Position
• Entry Level: Long Position 3.5400
• Take Profit Level: 3.5500 (100 pips)
Ichimoku indicator analysis of gold for November 28, 2017
Gold price continues to trade inside the upward sloping trading range but in an overlapping price formation. Price reached the upper channel boundaries yesterday and got rejected. Gold will eventually break lower. My short-term target is at $1,250.

Blue lines - bullish channel
Gold price is trading above the 4-hour Kumo (cloud). Trend is bullish but very fragile as the rise is not impulsive. Price got rejected at the upper channel boundary at $1,298.50. Support is at $1,288 and next at $1,283. A close below the 4-hour Kumo (cloud) will be a bearish sign implying that the next leg down towards $1,250 has started.

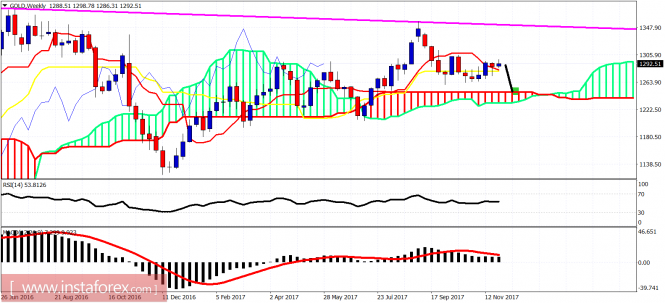
Gold price on a weekly basis is above the weekly Kumo (cloud). Price is expected to go towards the cloud support near $1,250-40 area. Support on a weekly basis is at $1,283. A weekly close below this level will confirm our view for $1,250. Longer-term I remain bullish but I believe a new major low should be expected.


No comments:
Post a Comment