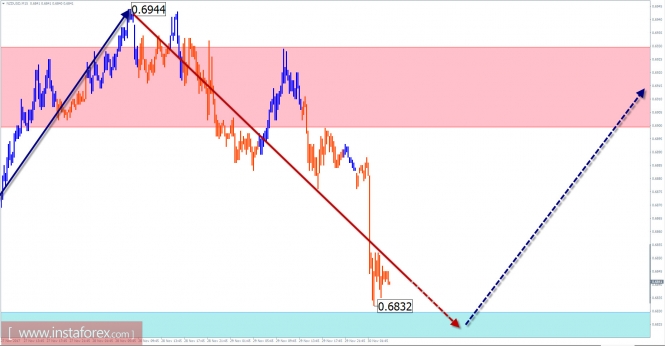
The wave level of the rising wave that started this month is not enough to change the trend. The formation of correction can be considered with a prospect of moving towards a large-scale movement.
Today, the reduction of quotations is expected to end. Breaking the lower boundary of the zone seems improbable. Then, the price is expected for a turn and the price will begin to rise.
Boundaries of resistance zones:
- 0.6900 / 0.6930
Boundaries of support zones:
- 0.6830 / 0.6800
USD / CAD review with current day forecast
The direction of the short-term trend of the major pair Canadian currency since early September was set by the rising wave. Since October 27, a counterwave has started, but not yet complete. In its formation for the past two weeks, the development of the middle part of the structure started. Judging by its configuration, the target recovery level should update the local high of the current bearish wave.
Today, the general upward trend of price fluctuations is expected. During the European trading session, a short-term decline is possible that will occur not beyond the boundaries of the support zone. The active phase of the movement is expected in the afternoon. The upper limit of daily volatility limits the resistance zone.
Boundaries of resistance zones:
- 1.2920 / 50
Boundaries of support zones:
- 1.2830 / 1.2800
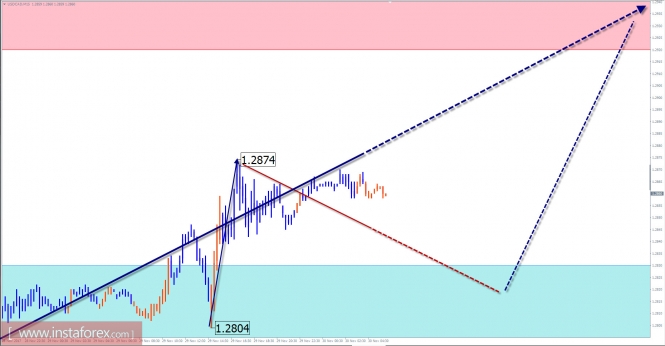
Explanations to the figures: For simplified wave analysis, a simple waveform is used that combines 3 parts (A; B; C). Of these waves, all kinds of correction are composed and most of the impulses. On each considered time frame the last and incomplete wave is analyzed.
The areas marked on the graphs are indicated by the calculation areas in which the probability of a change in the direction of motion is significantly increased. Arrows indicate the wave counting according to the technique used by the author. The solid background of the arrows indicates the structure formed, the dotted one indicates the expected wave motion.
Attention: The wave algorithm does not take into account the duration of the tool movements in time. The forecast is not a trading signal! To conduct a trade transaction, you need to confirm the signals of your trading systems.
Trading forecast EUR/GBP 11/30/2017
Yesterday, the pair reached the monthly short-term at 1.3528-1.3479, which requires closing most of the purchases. The probability of forming a correctional or reversal model is increasing
Medium-term plan.
The upward movement is a medium-term impulse, hence, searching for entry points of selling is possible only after the formation of the reversal model on the lower timeframe. Until this happens, the local monthly maximum can be updated more than once. When establishing a trading plan at the end of this week, it is important to consider the fact that the pair reached the monthly control zone (KZ) of November. This significantly increases the possibility of a large supply, which could lead to depreciation to the previous weekly short-term 1.3390-1.3358.
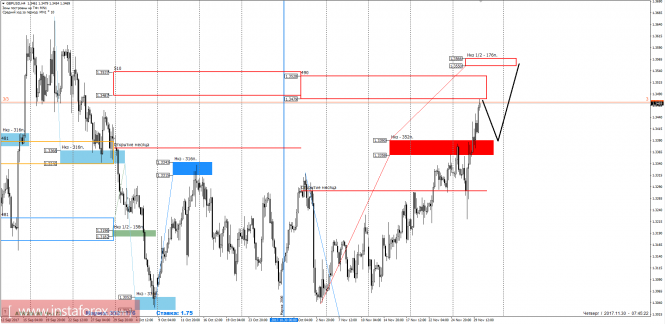
To form an alternative model, it is required to maintain the price at current marks and ascend to the Weekly control zone (NKZ) 1/2 of 1.3566-1.3550. It will make fixing the remainder of purchases possible and consider selling the instrument above the monthly KZ.
Intraday plan.
Yesterday, there was a consolidation above the weekly short-term 1.3390-1.3358, which focused on the continuation of growth, with a probability of 70%, reaching the target at NKZ 1/2 1.3566-1.3550. The closest support level is NKZ 1/4 1.3399-1.3391, and testing this level will allow obtaining favorable purchase prices towards the direction of the medium-term impulse. The maximum zone of correction movement is located within the limits of the NKZ 1/2 of 1.3319-1.3303. While the pair is trading above these levels, the upward movement will remain impulsive.
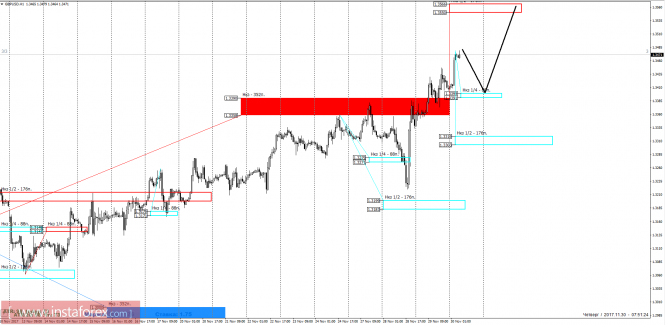
Daytime CP is the daytime control zone. The zone formed by important data from the futures market, which change several times a year.
Weekly CP is the weekly control zone. The zone formed by important futures market marks, which change several times a year.
Monthly CP is the monthly control zone. The zone is a reflection of the average volatility over the past year.
A number of data have influenced markets to varying degrees
The European currency managed to regain some of its positions against the US dollar after a good report on the growth rate of the US economy, which came out on Wednesday.
By the end of the US session, traders were closely following the speeches of representatives of the Fed.
Thus, the President of the Federal Reserve Bank of San Francisco, John Williams, said on Wednesday that future rate hikes will depend on the stability of economic growth and inflation, but a delay in raising rates creates risks of instability. Williams expects that inflation will reach 2% in 2018, which will contribute to the warmed-up labor market.
In general, the technical picture in the EURUSD pair remained without major changes.
A break above 1.1880 will lead to a larger upward trend in risky assets with an update of 1.1915 and 1.1960. In the event of maintaining pressure on the euro, we can expect the continuation of a downward correction towards the area of 1.1820 and 1.1780.
Oil quotes, despite falling inventories, declined after the report of the Energy Information Administration of the US Energy Ministry. According to the data, the drop in commercial oil reserves for the week was 3.4 million barrels, which was due to the suspension of the Keystone pipeline and the increase in the load of the refinery. Economists had expected that the decline in reserves would be 1.9 million barrels.
Demand for the British pound has muted and also dropped after the data on the deterioration of confidence of the British consumers in November of this year. According to the report of the research company Gfk, the consumer confidence index Gfk in November 2017 decreased by 2 points and amounted to -12 points.
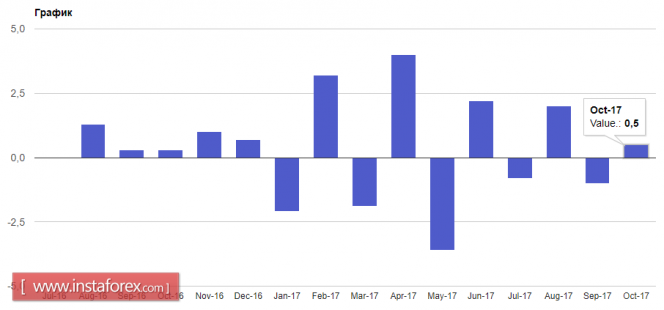
The Japanese yen continued to decline against the US dollar, despite good data on industrial production in Japan. According to a report from the Ministry of Economy of Japan, industrial production grew by 0.5% in October this year compared with September, while economists expected a 2.0% increase in production.
The New Zealand dollar collapsed against the US dollar after the release of the report on the decline in confidence in the business circles of New Zealand. According to ANZ, 39% of companies are pessimistic about the coming year, and the index in November this year fell by 29 points compared with October.
This failed to help commodity currencies and good data on manufacturing activity in China.
According to the report, the index of supply managers for the manufacturing sector in November rose to 51.8 points from 51.6 points in October. Economists had expected the index to be 51.5 in November. The index of new orders rose to 53.6 from 52.9, the production index rose to 54.3 from 53.4.
The European currency managed to regain some of its positions against the US dollar after a good report on the growth rate of the US economy, which came out on Wednesday.
By the end of the US session, traders were closely following the speeches of representatives of the Fed.
Thus, the President of the Federal Reserve Bank of San Francisco, John Williams, said on Wednesday that future rate hikes will depend on the stability of economic growth and inflation, but a delay in raising rates creates risks of instability. Williams expects that inflation will reach 2% in 2018, which will contribute to the warmed-up labor market.
In general, the technical picture in the EURUSD pair remained without major changes.
A break above 1.1880 will lead to a larger upward trend in risky assets with an update of 1.1915 and 1.1960. In the event of maintaining pressure on the euro, we can expect the continuation of a downward correction towards the area of 1.1820 and 1.1780.
Oil quotes, despite falling inventories, declined after the report of the Energy Information Administration of the US Energy Ministry. According to the data, the drop in commercial oil reserves for the week was 3.4 million barrels, which was due to the suspension of the Keystone pipeline and the increase in the load of the refinery. Economists had expected that the decline in reserves would be 1.9 million barrels.
Demand for the British pound has muted and also dropped after the data on the deterioration of confidence of the British consumers in November of this year. According to the report of the research company Gfk, the consumer confidence index Gfk in November 2017 decreased by 2 points and amounted to -12 points.
The Japanese yen continued to decline against the US dollar, despite good data on industrial production in Japan. According to a report from the Ministry of Economy of Japan, industrial production grew by 0.5% in October this year compared with September, while economists expected a 2.0% increase in production.

The New Zealand dollar collapsed against the US dollar after the release of the report on the decline in confidence in the business circles of New Zealand. According to ANZ, 39% of companies are pessimistic about the coming year, and the index in November this year fell by 29 points compared with October.
This failed to help commodity currencies and good data on manufacturing activity in China.
According to the report, the index of supply managers for the manufacturing sector in November rose to 51.8 points from 51.6 points in October. Economists had expected the index to be 51.5 in November. The index of new orders rose to 53.6 from 52.9, the production index rose to 54.3 from 53.4.


No comments:
Post a Comment