

The price is below the moving average MA 200 and 20 MA, indicating the downward trend.
The MACD is below the zero level.
The oscillator Force Index is below the zero level.
If the level of support is broken, you shall follow recommendations below:
• Timeframe: H4
• Recommendation: Short Position
• Entry Level: Short Position 111.00
• Take Profit Level: 109.00 (200 pips)
If the price rebound from support level, you shall follow recommendations below:
• Timeframe: H4
• Recommendation: Long Position
• Entry Level: Long Position 111.70
• Take Profit Level: 112.30 (60 pips)
GOLD
Possible long position at the breakout level 1295.00
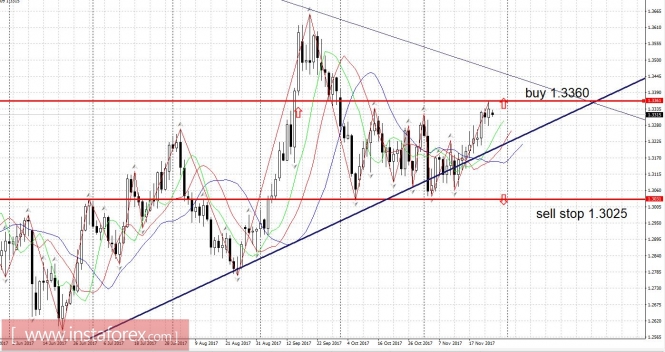
GBPUSD
Possible long position at the breakout level 1.3360
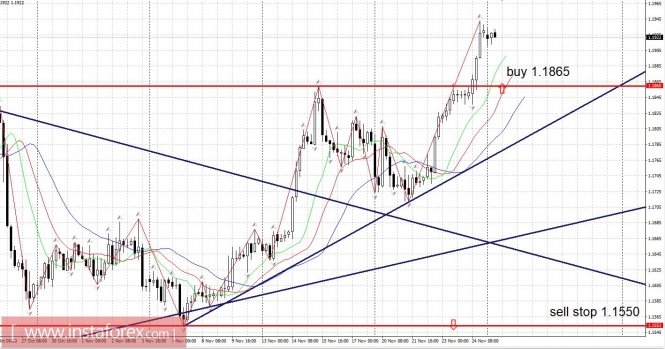
EURUSD
Possible long position at the breakout level 1.1955
USDCHF
Possible short position in the breakdown of the level 0.9770
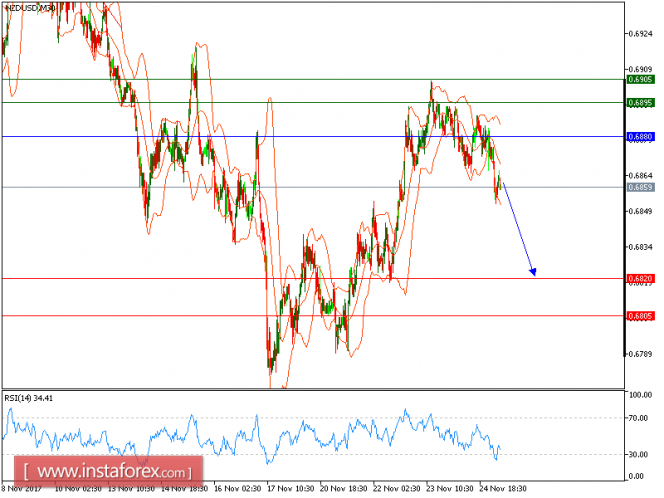
NZD/USD is expected to trade with a bearish bias below 0.6880. The pair failed to break above its key resistance at 0.6880 and is now turning down.
A bearish cross has been identified between the 20-period and 50-period moving averages, which should confirm a negative outlook.
Last but not least, the relative strength index has broken below its neutrality area at 50. In these perspectives, as long as 0.6880 holds on the upside, look for a new pullback to 0.6820 and 0.6805 in extension.
The black line shows the pivot point. Currently, the price is above the pivot point, which indicates long positions. If it remains below the pivot point, it will indicate short positions. The red lines are showing the support levels and the green line is indicating the resistance levels.
These levels can be used to enter and exit trades. Resistance levels: 0.6895, 0.6905, and 0.6950 Support levels: 0.6820, 0.6805, and 0.6770
The Dollar index has reached our short-term target area and the 61.8% Fibonacci retracement at 92.50. I expect a reversal from current levels to the upside. However we have still not seen any reversal sign.
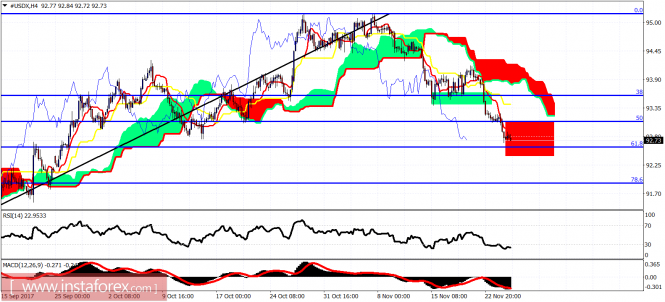
Green rectangle - support area (broken) Red rectangle - target area (reached) The Dollar index has finally reached our short-term target.
Trend is bearish as price remains below the 4 hour Kumo (cloud). Support is at the 61.8% Fibonacci retracement at 92.50 while resistance is at 93.40 and next at 93.90.
Trend is bearish as price remains below the 4 hour Kumo (cloud). Support is at the 61.8% Fibonacci retracement at 92.50 while resistance is at 93.40 and next at 93.90.
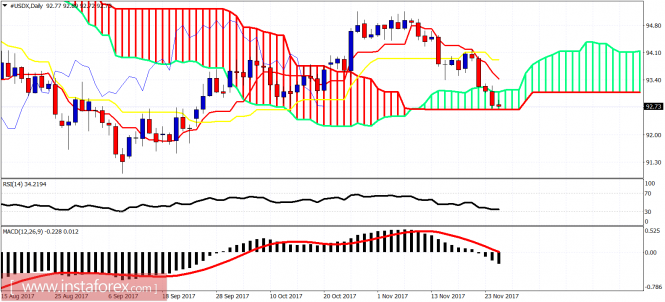
The Dollar index has entered the Ichimoku cloud area in the daily chart. A daily close below the cloud will be a bearish sign.
Trend is neutral but very close to turning bearish again on a daily basis. I expect the Dollar index to bounce from the cloud support.
Important Daily resistance at 94.10. Break above it and we could see more than just a bounce in the Dollar.
Ichimoku indicator analysis of gold for November 27, 2017
Gold price is in a short-term bullish trend as price is above the 4-hour Ichimoku cloud and is making higher highs and higher lows.
Price is steadily moving higher but on very slow pace. The form of the price rise has an overlapping price structure which suggests that this upward move is not impulsive.
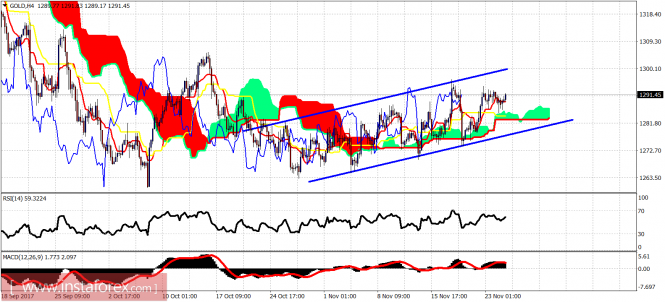
Blue lines - bullish channel Gold price is trading at $1,291.50 above both the tenkan- and kijun-sen indicators.
Price made an important low late October around $1,260 and ever since it is mainly moving sideways as price has not yet broken above the October high of $1,305. Support is at $1,281.
Breaking below that level will push price towards $1,270-$1,260 and eventually towards our short-term target of $1,250-45. Resistance is at $1,299-$1,305.
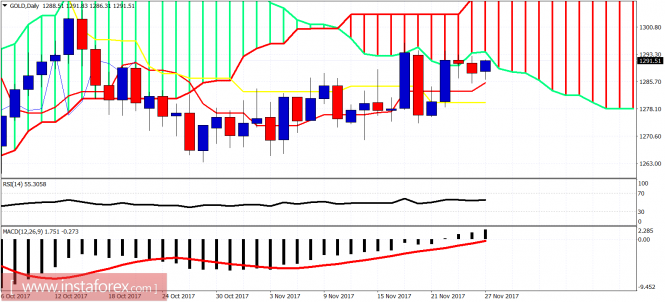
On a daily basis Gold price is testing the lower boundary of the Ichimoku cloud. Support is on Friday's low and resistance at $1,294-95. A rejection here will increase the chances of my bearish short-term scenario for a move towards $1,250 before the resumption of the up trend.
Trading Plan 11/27- 12/01/2017
Trading Plan 11/27- 12/01/2017 The general picture: Bitcoin broke through the ceiling, the euro rose and there is news this week. The focus of investors, of course, was on bitcoin. In the weekend, bitcoin rose by 20%, an unbelievable rally.
Trading Plan 11/27- 12/01/2017 The general picture: Bitcoin broke through the ceiling, the euro rose and there is news this week. The focus of investors, of course, was on bitcoin. In the weekend, bitcoin rose by 20%, an unbelievable rally.
Ruthlessly shortstopped - well, and rightly so, to climb on selling on such a schedule - this is for the common folk. On Monday morning, the price of bitcoin was at 9700 dollars. If it is serious- it is necessary to shortstop. Before the reversal, there will first be a strong pullback downward - not less than $ 2,000.
There are many who want to buy, they will buy and drag bitcoin into "last growth." And here one can start to sell gently, not far from the highs - but with a not very distant stop behind the high - and it's better to start the first selling for a high, but with a short stop.
EURUSD: Our recommendations were not ill-advised - you can lock in the profits right now. The Euro will probably continue to grow, but now it is very likely to rollback.
Buy euro from 1.1865 On Tuesday at 2.00 pm London time, Jerome Powell, the future head of the Federal Reserve, will speak at a hearing in the Senate Banking Committee.
On Wednesday, the report "The Beige Book" of the Fed (at 6.00 PM London time) and US GDP at 12.30 PM London time will be published. GBPUSD: Buy for a breakthrough of 1.3360
Breaking forecast 11.27.2017
Breaking forecast 11.27.2017 The euro is ready to continue its growth, but a rollback is highly probable.
Breaking forecast 11.27.2017 The euro is ready to continue its growth, but a rollback is highly probable.
German Chancellor Merkel with an iron hand extinguished the political crisis: The main opposition- the SPD party- is ready to support the Merkel government. The issue of new elections is at least postponed for a long time.
In the world economy and in the EU economy everything is still positive. The Fed has no desire to accelerate the rate hike - therefore there is no reason for the dollar's strengthening. The euro keeps its growth potential.
Still, there has already been a significant increase (on the morning of Monday, the price of EURUSD is at 1.1930) - ahead of a significant resistance zone 1.2050 - 1.2100 - there is high probability of a rollback. Buy euros from a rollback of 1.1865 and below.
Elliott wave analysis of EUR/JPY for November 27, 2017
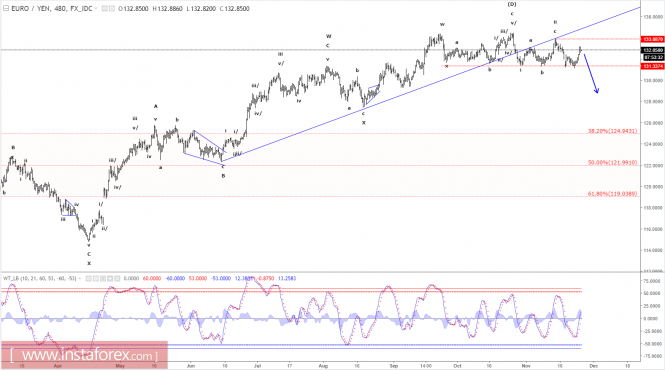
The corrective rally from 131.14 has extended beyond the expected target at 132.47. This larger corrective rally does not change our preferred view that more downside pressure remains expected in wave (E).
That said, the requirement for this count to remain the top count is, that resistance at 133.89 continues to cap the upside for a break below minor support at 132.11 and more importantly below support at 131.14 that calls for a decline towards 123.43 in wave (E).
R3: 134.50
R2: 133.87
R1: 133.34
Pivot: 132.35
S1: 132.11
S2: 131.61
S3: 131.14
Trading recommendation:
Our break-even stop at 133.10 has been hit. We will look for a new selling opportunity at 133.25 with a stop at 134.00.
Get Bonus No Deposite in your Trading Account now and add this currency pair to your forex portfolio, enjoy your trading with us!


No comments:
Post a Comment