
2017-12-11

Wave summary:
EUR/JPY remains lock inside the 131.14 - 134.50 range, which we think is a topping pattern developing. It will eventually resolve itself to the downside and a break below important support at 131.14 confirm that wave (D) has completed and wave (E) lower to the ideal target at 123.43 is developing.
That said, an unexpected break above 134.50 will shift the bias towards more upside pressure to 137.37 to complete wave (D).
R3: 134.50
R2: 134.17
R1: 133.97
Pivot: 133.41
S1: 133.11
S2: 132.69
S3: 132.23
Trading recommendation:
Our break-even stop at 133.75 has been hit. We will sell EUR again at 134.00 or upon a break below 133.41 with the stop placed at 134.60.
Elliott wave analysis of EUR/NZD for December 11, 2017
2017-12-11

Wave summary:
We have seen the expected decline and with the break below 1.7077 and continuation closer to 1.7000 is expected. Short-term resistance is now seen at 1.7105 and stronger resistance is seen at 1.7150, which should be able to cap the upside for the expected decline to 1.7000 and maybe even closer to 1.6922.
R3: 1.7220
R2: 1.7150
R1: 1.7105
Pivot: 1.7077
S1: 1.7050
S2: 1.7000
S3: 1.6981
Trading recommendation:
We are short EUR from 1.7200 and will move our stop lower to 1.7125.
Buyers encroaching
11 December 2017, USD/JPY

Technical Observation:
Last week's candle is a perfect bullish continuation candle. The week't candle opened at 112.74, went to the lows of 111.98 before recovering immensely to the upper side. I expect further rise even during this week towards 114.75, which is a key supply zone and should act as sell place. With that in mind, if you didn't go long based on last week's forecast, then wait for a breakout above 114.75, to buy, or a rebound from 114.75-113.98, then short Usd towards 105.00
Technical Levels
Resistance levels
R1: 113.1
R2: 114
R3: 116.04
Pivot
113.97
Support Levels
S1: 107.9
S2: 109.94
S3: 111.06
Trade Signal
Long with a take profit at 114.75
Ichimoku cloud indicator analysis of gold
Gold price remains in a bearish trend. However Gold is showing signs of at least a bounce in the short-term. Gold price is expected to bounce at least for a couple of days. Minimum bounce target is at $1,260.
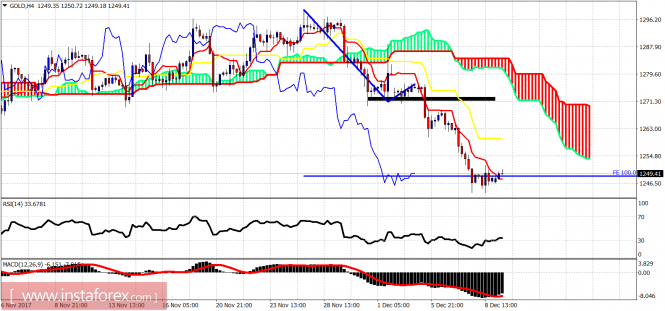
Gold price is trading above the 4-hour tenkan-sen (Red line indicator). Both MACD and the RSI are turning upwards from oversold levels. This suggests that today we should see a bounce. First important resistance is at $1,260 and next at $1,271. Support is at $1,242.
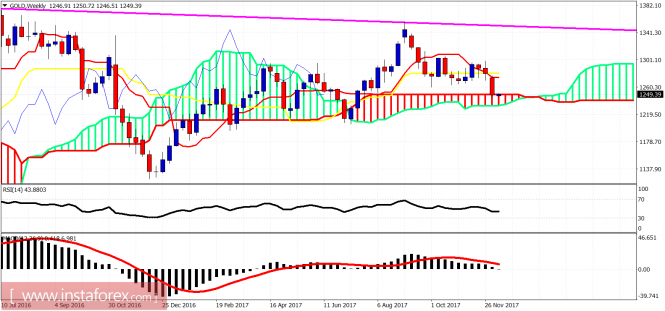
On a weekly basis Gold price has reached the Kumo support. This is an area where I do not prefer to be short. I expect a bounce from this area. Important weekly resistance is at $1,274-79. A weekly close above this area will turn trend to strongly bullish again.
113.97
Support Levels
S1: 107.9
S2: 109.94
S3: 111.06
Trade Signal
Long with a take profit at 114.75
Ichimoku cloud indicator analysis of gold
Gold price remains in a bearish trend. However Gold is showing signs of at least a bounce in the short-term. Gold price is expected to bounce at least for a couple of days. Minimum bounce target is at $1,260.
Gold price is trading above the 4-hour tenkan-sen (Red line indicator). Both MACD and the RSI are turning upwards from oversold levels. This suggests that today we should see a bounce. First important resistance is at $1,260 and next at $1,271. Support is at $1,242.
On a weekly basis Gold price has reached the Kumo support. This is an area where I do not prefer to be short. I expect a bounce from this area. Important weekly resistance is at $1,274-79. A weekly close above this area will turn trend to strongly bullish again.
Get Bonus No Deposite in your Trading Account now and add this currency pair to your forex portfolio, enjoy your trading with us!


No comments:
Post a Comment