
2018-02-22

Monthly Outlook
In January 2015, the EUR/USD pair moved below the major demand levels near 1.2050-1.2100 (multiple previous bottoms set in July 2012 and June 2010). Hence, a long-term bearish target was projected toward 0.9450.
In March 2015, EUR/USD bears challenged the monthly demand level around 1.0500, which had been previously reached in August 1997.
In the longer term, the level of 0.9450 remains a projected target if any monthly candlestick achieves bearish closure below the depicted monthly demand level of 1.0500.
However, the EUR/USD pair has been trapped within the depicted consolidation range (1.0500-1.1450) until the current bullish breakout was executed above 1.1450 and recently above 1.2075.
Another bullish breakout above 1.2250 was expressed on the chart. This hinders the bearish momentum allowing bullish advancement to occur towards 1.2750 provided that the price level of 1.2250 remains defended by the bulls.

Daily Outlook
In September, a bearish target for the depicted Head and Shoulders pattern was projected towards 1.1350. However, the market failed to apply significant bearish pressure against the mentioned zone (1.1415-1.1520).
Instead, In November, evident bullish recovery was manifested around the price zone of 1.1520-1.1415.
This hindered further bearish decline which allowed the current bullish momentum to occur towards the price level of 1.2100 which failed to pause the ongoing bullish momentum as well.
Daily persistence above 1.2470-1.2500 is needed to confirm a recent bullish flag continuation pattern with projected targets around the price level of 1.2750.
On the other hand, a recent bearish pullback is being expressed below the price level of 1.2450. This could extend towards 1.2070 if a bearish breakdown of the level of 1.2200 is achieved on a daily basis.
NZD/USD Intraday technical levels and trading recommendations for February 22, 2018
2018-02-22

Daily Outlook
In July 2017, an atypical Head and Shoulders pattern was expressed on the depicted chart which indicated an upcoming bearish reversal.
As expected, the price level of 0.7050 failed to offer enough bullish support for the NZD/USD pair. That's why the further bearish decline was expected towards 0.6800 (Reversal pattern bearish target).
Evident signs of bullish recovery were expressed around the depicted low (0.6780). An inverted Head and Shoulders pattern was expressed around these price levels.
The price zone of 0.7140-0.7250 (prominent Supply-Zone) failed to pause the ongoing bullish momentum. Instead, a bullish breakout above 0.7250 was expressed on January 11.
That's why a quick bullish movement was expected towards the depicted supply zone (0.7320-0.7390) where evident bearish rejection and a valid SELL entry were expected.
On February 2, a bearish engulfing daily candlestick was expressed. This enhances the bearish scenario towards the price levels of 0.7230 - 0.7165 where bullish recovery should be expressed.
Trade Recommendations:
The current price zone (0.7320-0.7390) remains a significant supply zone to offer a valid SELL entry.
Stop Loss should be set as a daily candlestick above 0.7450.
Bearish fixation below 0.7300 is needed to allow further bearish decline towards 0.7160 and 0.7090.
Technical analysis of USD/CHF for February 22, 2018
2018-02-22

Overview:
The USD/CHF pair broke resistance at 0.9361 which turned into strong support yesterday. This level coincides with 61.8% of Fibonacci retracement which is expected to act as major support today. Equally important, the RSI is still signaling that the trend is upward, while the moving average (100) is headed to the upside. Accordingly, the bullish outlook remains the same as long as the EMA 100 is pointing to the uptrend. This suggests that the pair will probably go above the daily pivot point (0.9361) in the coming hours. The USD/CHF pair will demonstrate strength following a breakout of the high at 0.9361. Consequently, the market is likely to show signs of a bullish trend. In other words, buy orders are recommended above 0.9361 with the first target at 0.9409. Then, the pair is likely to begin an ascending movement to 0.9436 marks and further to 0.9469 levels. The level of 0.9469 will act as strong resistance because it forms the double top on the H1 chart. On the other hand, the daily strong support is seen at 0.9328. If the USD/CHF pair is able to break out the level of 0.9328, the market will decline further to 0.9254.
GBP/USD analysis for February 22, 2018
2018-02-22

Recently, the GBP/USD has been trading downwards. The price tested the level of 1.3869. Anyway, according to the 30M time – frame, I found a successful rejection of the pivot support 1 at the price of 1.3875, which is a sign that selling looks risky. I also found a hidden bullish divergence on the stochastic oscillator, which is another sign of strength. My advice is to watch for potential buying opportunities. The upward targets are set at the price of 1.3940 and at the price of 1.3982.
Resistance levels:
R1: 1.3980
R2: 1.4048
R3: 1.4087
Support levels:
S1: 1.3878
S2: 1.3840
S3: 1.3773
Trading recommendations for today: watch for potential buying opportunities.
Analysis of Gold for February 22, 2018
2018-02-22

Recently, the Gold has been trading downwards. As I expected, the price tested the level of $1,321.00. According to the 30M time – frame, I found that price is trading inside of the multiday downward channel, which is a sign that sellers are in control. I also found weak rally and weak demand, which is another sign of weakness. My advice is to watch for potential selling opportunities. The downward target is set at the price of $1,317.50.
Resistance levels:
R1: $1,333.00
R2: $1,341.54
R3: $1,346.84
Support levels:
S1: $1,319.16
S2: $1,313.85
S3: $1,305.30
Trading recommendations for today: watch for potential selling opportunities.
Technical analysis of NZD/USD for February 22, 2018
2018-02-22

Overview:
Pivot : 0.7337.
The NZD/USD pair continued moving upwards from the spot of 0.7337/0.7314. The pair rose from the area of 0.7337/0.7314 (support zone) to the top around 0.7436.
The trend was rebounded to the price of 0.7314 again. Today, the first support level is seen at 0.7314 followed by 0.7285, while daily resistance is seen at 0.7360.
According to the previous events, the NZD/USD pair is still moving between the levels of 0.7314 and 0.7394.
For that, we expect a range of 80 pips in coming hours. This would suggest a bullish market because the RSI indicator is still in a positive area and does not show any trend-reversal signs. Furthermore, if the trend is able to break out through the first resistance level of 0.7360, we should see the pair climbing towards the second resistance (0.7374) to test it. On the contrary, if a breakout takes place at the support level of 0.7314, then this scenario may become invalidated. Remember to place a stop loss; it should be set below the second support of 0.7261.
Technical analysis of NZD/USD for February 22, 2018
2018-02-22
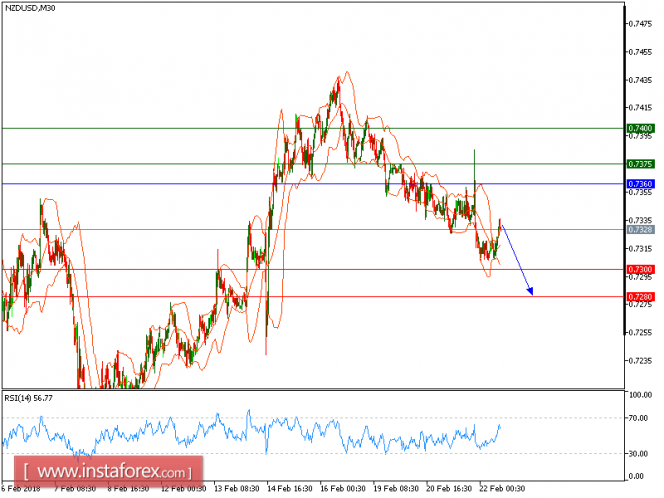
Our first downside target which we predicted in yesterday's analysis has been hit. NZD/USD is Under pressure. The pair is trading below its declining 20-period and 50-period moving averages, which play resistance roles and maintain the downside bias. The relative strength index is bearish and calls for a further downside.
Therefore, as long as 0.7360 holds on the upside, look for a new drop with targets at 0.7300 and 0.7280 in extension.
The black line shows the pivot point. Currently, the price is above the pivot point, which is a signal for long positions. If it remains below the pivot point, it will indicate short positions. The red lines show the support levels, while the green line indicates the resistance levels. These levels can be used to enter and exit trades.
Resistance levels: 0.7375, 0.7400, and 0.7450.
Support levels: 0.7300, 0.7280, and 0.7250.
Technical analysis of GBP/JPY for February 22, 2018
2018-02-22
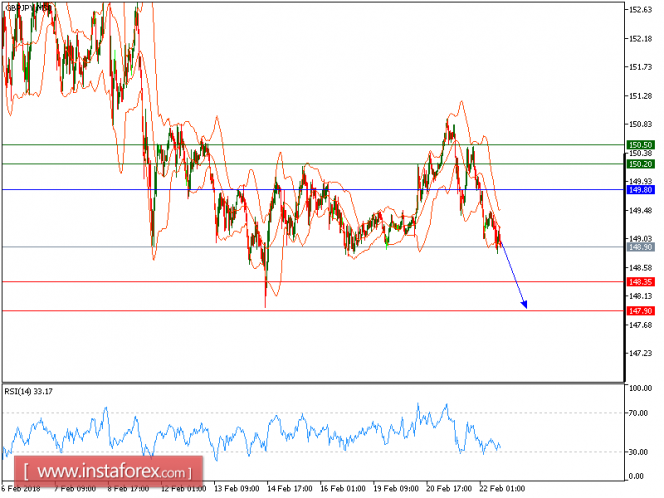
GBP/JPY is under pressure. The pair retreated from around 150.80 (the high of February 21) and broke below its 20-period and 50-period moving averages. In addition, the bearish cross between 20-period and 50-period moving averages has been identified. The relative strength index is below its neutrality level at 50. To sum up, below 149.80, look for another drop with targets at 148.35 and 147.90 in extension.
Alternatively, if the price moves in the direction opposite to the forecast, a long position is recommended to be above 149.80 with the target at 150.20.
Strategy: SELL, Stop loss at 149.80, Take profit at 148.35
Chart Explanation: The black line shows the pivot point. The price above the pivot point indicates long positions; and when it is below the pivot point, it indicates short positions. The red lines show the support levels, and the green line indicates the resistance levels. These levels can be used to enter and exit trades.
Resistance levels: 150.20, 150.50, and 150.00
Support levels: 148.35, 147.90, and 147.50
Technical analysis of USD/CHF for February 22, 20182018-02-22

All our upside targets which we predicted in yesterday's analysis have been hit. USD/CHF is expected to continue its upside movement. The pair has recorded a process of higher tops and higher bottoms since February 16, confirming a bullish outlook. Both rising 20-period and 50-period moving averages should push the prices higher. The relative strength index advocates for a further upside.
Hence, as long as 0.9350 is not broken, look for a further advance to 0.9410 and even to 0.9450 in extension.
Chart Explanation: The black line shows the pivot point. The present price above the pivot point indicates a bullish position, and the price below the pivot point indicates a short position. The red lines show the support levels, and the green line indicates the resistance levels. These levels can be used to enter and exit trades.
Strategy: BUY, stop loss at 0.9350, take profit at 0.9410.
Resistance levels: 0.9410, 0.9450, and 0.9485
Support levels: 0.9325, 0.9295, and 0.9250.
Technical analysis of USD/JPY for February 22, 2018
2018-02-22

USD/JPY is expected to trade with bullish above 107.00. The pair keeps challenging the overhead resistance at 107.90. Currently intraday bullishness is maintained by those well-directed 20-period and 50-period moving averages. And the relative strength index refuses to stay below the neutrality level of 50, showing a lack of downward momentum for the pair. Upon crossing 107.90, the pair should proceed toward the second upside target at 108.40.
Alternatively, if the price moves in the opposite direction, a short position is recommended to be above 107.00 with a target of 107.90.
Chart Explanation: The black line shows the pivot point. The current price above the pivot point indicates a bullish position, while the price below the pivot point is a signal for a short position. The red lines show the support levels, and the green line indicates the resistance level. These levels can be used to enter and exit trades.
Strategy: BUY, stop loss at 107.00, take profit at 107.90.
Resistance levels: 107.90, 108.40, and 108.45
Support levels: 106.70, 106.45, and 106.00.
Get Bonus No Deposite in your Trading Account now and add this currency pair to your forex portfolio, enjoy your trading with us!


No comments:
Post a Comment