
2018-08-24
USD/CAD is approaching its resistance at 1.3116 (61.8% & 100% Fibonacci extension, 61.8% Fibonacci retracement, horizontal overlap resistance) where it is expected to reverse down to its support at (50% Fibonacci retracement, horizontal overlap support). Stochastic (55, 5, 3) is approaching its resistance at 96% where a corresponding reversal is expected.
USD/CAD is approaching its resistance where we expect to see a reversal.
Sell below 1.3116. Stop loss at 1.3141. Take profit at 1.3055.
#theforexarmy #forexsigns #forexsignals #forexfamily #forexgroup #forexhelp #forexcourse #forextrade #forexdaily #forexmoney #forexentourage #forextrading #forex #forexhelptrading #forexscalping #babypips #forexfactory #forexlife #forextrader #financialfreedom #daytrader #scalper #swingtrader #fx #currency #pips #technicalanalysis
Technical analysis of NZD/USD for August 24, 2018
2018-08-24
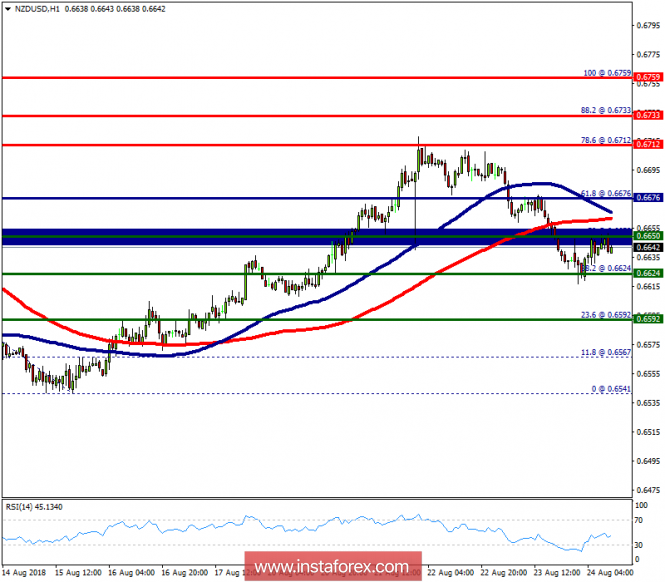
Overview:
The NZD/USD pair couldn't break support at the level of 0.6624. The level of 0.6624 coincides with 38.2% of Fibonacci retracement which is expected to act as major support today. Equally important, the RSI is still signaling that the trend is upward, while the moving average (100) is headed to the upside. Accordingly, the bullish outlook remains the same as long as the EMA 100 is pointing to the uptrend. This suggests that the pair will probably go above the daily pivot point (0.6676) in the coming hours. The NZD/USD pair will demonstrate strength following a breakout of the high at 0.9958. Consequently, the market is likely to show signs of a bullish trend. In other words, buy orders are recommended above 0.6676 with the first target at 0.6712. Then, the pair is likely to begin an ascending movement to 0.6733 mark and further to 0.6759 levels. The level of 0.6759 will act as strong resistance, because the double top is already set at 0.6759. On the other hand, the daily strong support is seen at 0.6624. If the NZD/USD pair is able to break out the level of 0.6624, the market will decline further to 0.6541 (double bottom).
Technical analysis of AUD/USD for August 24, 2018
2018-08-24

Overview:
The AUD/USD pair continued to move upwards from the level of 0.7263. Since yesterday, the pair has risen from the level of 0.7263 (the level of 0.7263 coincides with the ratio of 23.6% Fibonacci Expansion). In consequence, the AUD/USD pair broke resistance at 0.7263, which turned into strong support at the level of 0.7329. In the H1 time frame, the level of 0.7263 is expected to act as major support today. Currently, the price is moving in a bullish channel. This is confirmed by the RSI indicator signaling that we are still in a bullish market. The price is still above the moving average (100) and (50). From this point, we expect the AUD/USD pair to continue moving in the bullish trend from the support level of 0.7263 towards the target level of 0.7299. If the pair succeeds in passing through the level of 0.7299, the market will indicate the bullish opportunity above the level of 0.7299 so as to reach the second target at 0.7359 (pivot point). At the same time, if the AUD/USD pair is able to break out the level of 0.7234, the market will decline further to 0.7204.
Technical analysis of EUR/USD for August 24, 2018
2018-08-24
Overview:
The EUR/USD pair will continue rising from the level of 1.1558 in the short term. It should be noted that the support is established at the level of 1.1503 which represents the first support on the H4 chart. The price is likely to form a double bottom in the same time frame. Accordingly, the EUR/USD pair is showing signs of strength following a breakout of the highest level of 1.1503. So, buy above the level of 1.1503 with the first target at 1.1628 in order to test the daily resistance 1. The level of 1.1628 is a good place to take profits. Moreover, the RSI is still signaling that the trend is upward as it remains strong above the moving average (100). This suggests that the pair will probably go up in coming hours. If the trend is able to break the level of 1.1628, then the market will call for a strong bullish market towards the objective of 1.1676 today. On the other hand, in case a reversal takes place and the EUR/USD pair breaks through the support level of 1.1503, a further decline to 1.1426 can occur. It would indicate a bearish market.
Technical analysis of USD/CAD for August 24, 2018
2018-08-24
Overview:
The USD/CAD pair continues to move downwards from the levels of 1.3094 and 1.3048. The pair dropped from the level of 1.3094 to the bottom around 1.3018 then set around the spot of 1.3080. Today, the first resistance level is seen at 1.3094 followed by 1.3132, while daily support 1 is seen at 1.2974. According to the previous events, the USD/CAD pair is still moving between the levels of 1.3094 and 1.2974; for that, we expect a range of 120 pips (1.3094 - 1.2974). If the USD/CAD pair fails to break through the minor resistance level of 1.3094 , the market will decline further to 1.3048. This would suggest a bearish market because the RSI indicator is still in a positive area and does not show any trend-reversal signs. The pair is expected to drop lower towards at least 1.2974 with a view to testing the daily major support. However, if a breakout takes place at the resistance level of 1.3132, then this scenario may become invalidated.
Fundamental Analysis of EUR/GBP for August 24, 2018
2018-08-24
EUR/GBP has been quite non-volatile with the bullish gains recently. The price has recently broken above 0.8950 with a daily close. Though the pair is struggling for gains, EURO has been the dominant currency in the pair since the break above the range resistance 0.8850 area.
EUR has been consistently stronger fundamentally that helped the currency to extend strength against GBP in the process. Despite the BREXIT effect and Trade War situation, EUR has been outperforming GBP in several ways. Today German Final GDP was published unchanged as expected at 0.5% whereas GBP failed to meet the expectation ib light of High Street Lending report which showed a decrease to 39.6k from the previous figure of 40.3k, defying the forecast for an increase to 40.6k.
To sum up, EUR is the stronger currency in the pair fundamentally that is expected to lead to further bullish momentum in the process against GBP. Until the UK comes up with better economic data to develop a strong counter-move against EURO, the bullish trend is expected to continue.
Now let us look at the technical view. The price is currently heading lower while residing below the resistance area of 0.9030. The price is expected to retrace towards the dynamic levels of 20 EMA, Tenkan and Kijun line before starting to push higher above 0.9030 in the coming days. As the price remains above 0.8950, the bullish bias is expected to continue.
SUPPORT: 0.8850, 0.8950
RESISTANCE: 0.9030, 0.9150
BIAS: BULLISH
MOMENTUM: NON-VOLATILE

GBP/USD analysis for August 24, 2018
2018-08-24

Recently, the GBP/USD pair has been trading downwards. As I expected, the price tested the level of 1.2800. According to the M15 time – frame, I found a broken intraday bearish flag in the background, which is a sign that buying looks risky. I also found that the price failed to test daily pivot (1.2844), which is another sign of weakness. My advice is to watch for potential selling opportunities. The downward targets are set at the price of 1.2771 (S1) and at the price of 1.2730 (S2).
Resistance levels:
R1: 1.2884
R2: 1.2957
R3: 1.2997
Support levels:
S1: 1.2771
S2: 1.2730
S3: 1.2658
Trading recommendations for today: watch for potential selling opportunities.
The USD/CAD pair continues to move downwards from the levels of 1.3094 and 1.3048. The pair dropped from the level of 1.3094 to the bottom around 1.3018 then set around the spot of 1.3080. Today, the first resistance level is seen at 1.3094 followed by 1.3132, while daily support 1 is seen at 1.2974. According to the previous events, the USD/CAD pair is still moving between the levels of 1.3094 and 1.2974; for that, we expect a range of 120 pips (1.3094 - 1.2974). If the USD/CAD pair fails to break through the minor resistance level of 1.3094 , the market will decline further to 1.3048. This would suggest a bearish market because the RSI indicator is still in a positive area and does not show any trend-reversal signs. The pair is expected to drop lower towards at least 1.2974 with a view to testing the daily major support. However, if a breakout takes place at the resistance level of 1.3132, then this scenario may become invalidated.
Fundamental Analysis of EUR/GBP for August 24, 2018
2018-08-24
EUR/GBP has been quite non-volatile with the bullish gains recently. The price has recently broken above 0.8950 with a daily close. Though the pair is struggling for gains, EURO has been the dominant currency in the pair since the break above the range resistance 0.8850 area.
EUR has been consistently stronger fundamentally that helped the currency to extend strength against GBP in the process. Despite the BREXIT effect and Trade War situation, EUR has been outperforming GBP in several ways. Today German Final GDP was published unchanged as expected at 0.5% whereas GBP failed to meet the expectation ib light of High Street Lending report which showed a decrease to 39.6k from the previous figure of 40.3k, defying the forecast for an increase to 40.6k.
To sum up, EUR is the stronger currency in the pair fundamentally that is expected to lead to further bullish momentum in the process against GBP. Until the UK comes up with better economic data to develop a strong counter-move against EURO, the bullish trend is expected to continue.
Now let us look at the technical view. The price is currently heading lower while residing below the resistance area of 0.9030. The price is expected to retrace towards the dynamic levels of 20 EMA, Tenkan and Kijun line before starting to push higher above 0.9030 in the coming days. As the price remains above 0.8950, the bullish bias is expected to continue.
SUPPORT: 0.8850, 0.8950
RESISTANCE: 0.9030, 0.9150
BIAS: BULLISH
MOMENTUM: NON-VOLATILE
GBP/USD analysis for August 24, 2018
2018-08-24
Recently, the GBP/USD pair has been trading downwards. As I expected, the price tested the level of 1.2800. According to the M15 time – frame, I found a broken intraday bearish flag in the background, which is a sign that buying looks risky. I also found that the price failed to test daily pivot (1.2844), which is another sign of weakness. My advice is to watch for potential selling opportunities. The downward targets are set at the price of 1.2771 (S1) and at the price of 1.2730 (S2).
Resistance levels:
R1: 1.2884
R2: 1.2957
R3: 1.2997
Support levels:
S1: 1.2771
S2: 1.2730
S3: 1.2658
Trading recommendations for today: watch for potential selling opportunities.
Get Bonus No Deposite in your Trading Account now and add this currency pair to your forex portfolio, enjoy your trading with us!


No comments:
Post a Comment