2019-01-21
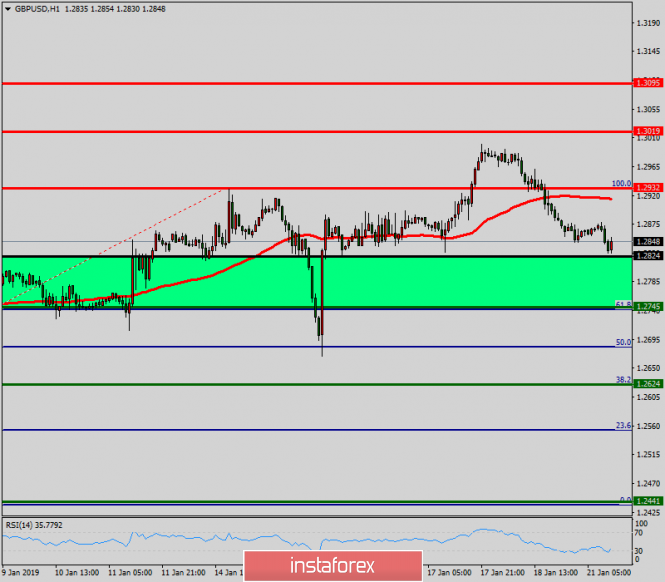
Overview:
The GBP/USD pair will continue rising from the level of 1.2824 which represents the daily pivot point on the H1 chart in the long term. It should be noted that the support is established at the level of 1.2745. The price is likely to form a double bottom in the same time frame. Accordingly, the GBP/USD pair is showing signs of strength following a breakout of the highest level of 1.2824. So, buy above the level of 1.2824 with the first target at 1.2932 in order to test the daily resistance 1. The level of 1.3019 is a good place to take profits. Moreover, the RSI is still signaling that the trend is upward as it remains strong above the moving average (100). This suggests that the pair will probably go up in coming hours. If the trend is able to break the level of 1.2932, then the market will call for a strong bullish market towards the objective of 1.3019 today. On the other hand, in case a reversal takes place and the GBP/USD pair breaks through the support level of 1.2745, a further decline to 1.2624 can occur. It would indicate a bearish market.
Intraday technical levels and trading recommendations for EUR/USD for January 21, 2019
2019-01-21
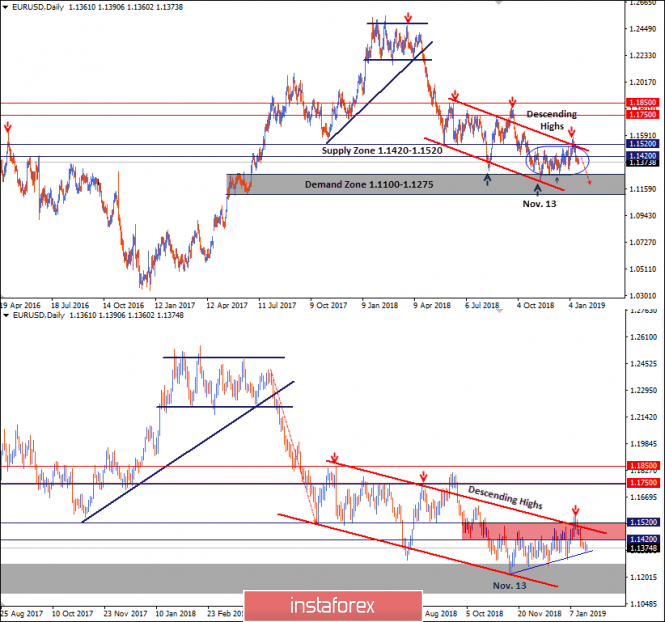
Since June 2018, the EUR/USD pair has been moving sideways with slight bearish tendency. Narrow sideway consolidations have been maintained within the depicted Flag Channel (In red).
On November 13, the EUR/USD demonstrated recent bullish recovery around 1.1220-1.1250 where the current bullish movement above the depicted short-term uptrend (In blue) was initiated.
Bullish fixation above 1.1420 was needed to enhance further bullish movement towards 1.1520. However, the market has demonstrated significant bearish rejection around 1.1420 few times so far.
This renders the recent bullish breakout above 1.1420 and 1.1520 as a false breakout. Hence, any bullish pullback towards 1.1420 can be considered as a valid SELL entry for intraday traders.
The current bearish consolidations below the key-level of 1.1400 encourages more bearish decline down to 1.1250 as an initial target.
Trade Recommendations:
Conservative traders can wait for a bearish breakdown below 1.1350 (short-term uptrend in BLUE) as a valid SELL entry.
T/P levels to be located around 1.1310, 1.1270 and 1.1225. S/L to be located above 1.1420.
Technical analysis of NZD/USD for January 21, 2019
2019-01-21
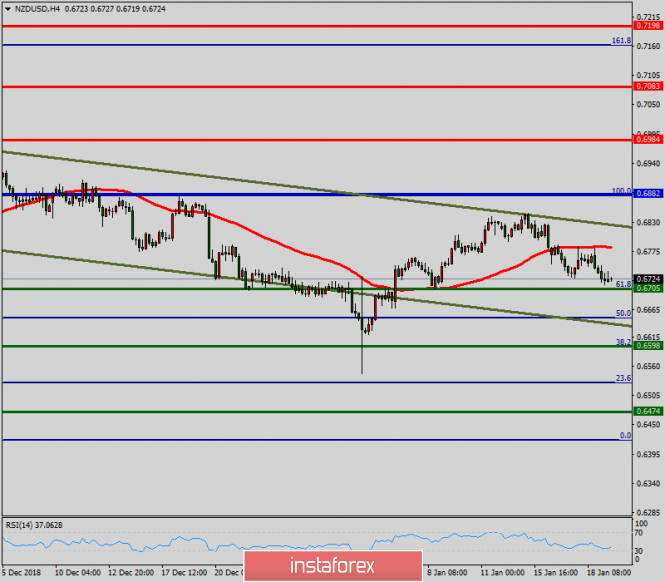
Overview:
The NZD/USD pair breached resistance which had turned into strong support at the level of 0.6705 this week. The level of 0.6705 coincides with a golden ratio (61.8% of Fibonacci), which is expected to act as major support today. The RSI is considered to be overbought, because it is above 70. The RSI is still signaling that the trend is upward as it is still strong above the moving average (100). Besides, note that the pivot point is seen at the point of 0.6882. This suggests that the pair will probably go up in the coming hours. Accordingly, the market is likely to show signs of a bullish trend. In other words, buy orders are recommended to be placed above 0.6800 with the first target at the level of 0.6882. From this point, the pair is likely to begin an ascending movement to the point of 0.6882 and further to the level of 0.6984. The level of 0.6984 will act as strong resistance. However, if there is a breakout at the support level of 0.6705, this scenario may become invalidated.
Analysis of Gold for January 21, 2019
2019-01-21
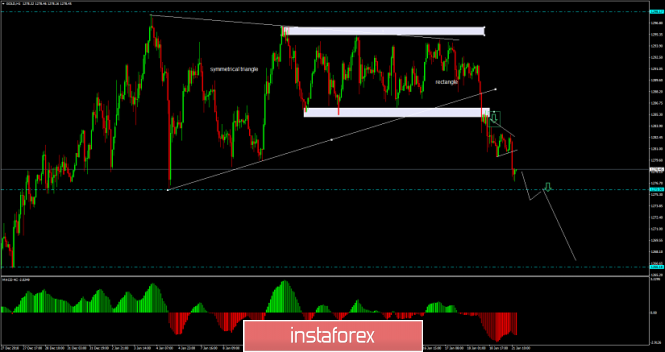
Recently, the EUR/USD pair has been trading downwards. As I expected, the price tested the level of $1,278.00 (first target met). Anyway, according to the H1 time frame, I have found that sellers are in control and that key support will be at the price of $1,275.90. Watch for a breakout of the key support to confirm further downward continuation.
Trading advice: We are still holding short positions from $1,282.00. We will add new short position if the Gold breaks through the level of $1,275 with the profit target at $1,266.20.
USD/CHF analysis for January 21, 2019
2019-01-21
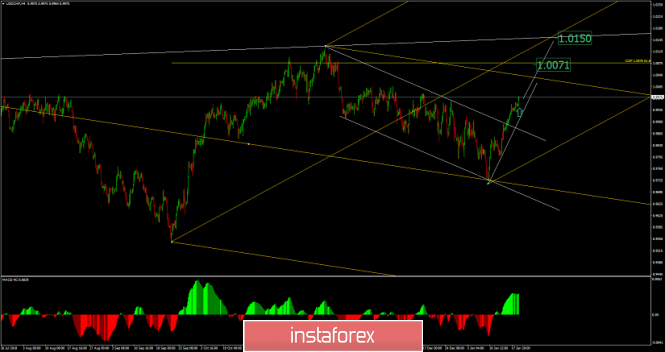
USD/CHF is expected to move higher towards 1.0050 as long as it holds above the upward trendline. Ideally support at 0.9930 will be able to protect the downside for a break resistance at 0.9984 that confirms the next push higher towards 1.0070 and 1.0150. Only a break below support at 0.9930 will force a recount of the rally from 0.9975.
Trading recommendation: We are long USD/CHF from 0.9975 with take profits at 1.0007 at the 1.0050. Protective stop is placed at 0.9940.
Intraday technical levels and trading recommendations for GBP/USD for January 21, 2019
2019-01-21
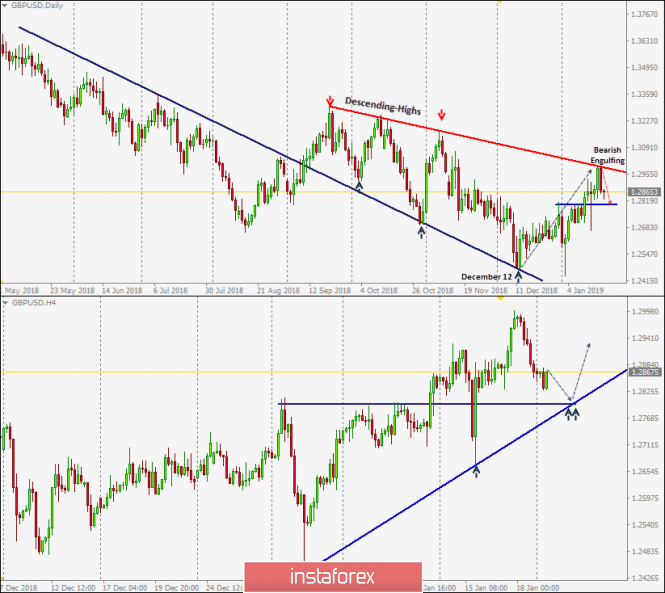
On December 12, the previously-dominating bearish momentum came to an end when the GBP/USD pair visited the price levels of 1.2500 where the backside of the broken daily uptrend was located.
Since then, the current bullish swing has been taking place. Recent bullish spike reached the price level of 1.2999 where significant bearish rejection was demonstrated (Bearish Engulfing candlestick around the down trend line).
This probably pauses the bullish scenario for a while, allowing sometime for bearish correction towards 1.2800 where confluence of demand levels as well as the H4 up-trend line come to meet the pair.
For the bullish scenario to remain valid, bullish persistence above the price level of 1.2800 should be maintained on a daily basis. Bullish breakout above 1.3000 will be needed to enhance further advancement towards 1.3130-1.3180.
Otherwise, any decline below 1.2800 invalidates the bullish scenario bringing the GBP/USD pair again into sideway consolidations that may extend down towards 1.2710 (Next demand level to meet the pair).


No comments:
Post a Comment