
Forex analysis review |
- Trading recommendations for the GBPUSD currency pair - placement of trading orders (February 21)
- EUR/USD: Weak data on the eurozone will not allow the euro to continue its growth. The minutes of the ECB
- EUR/USD. Weak US data failed to instill confidence in buyers
- GBP/USD. February 21st. Results of the day. The EU is not against moving the date of Brexit, an opinion shared by ministers
- EUR/USD. February 21st. Results of the day. European PMIs and US reports disappoint traders
- The cost of oil peaked again in the last three months
- GBP / USD plan for the American session on February 20. Pound buyers are building a side channel for continued growth
- EUR / USD plan for the American session on February 21. Demand for the euro remains even despite the bad data for the euro
- How the dollar reacted to the Fed's protocols and what has changed in the regulator's strategy?
- Intraday technical levels and trading recommendations for GBP/USD for February 21, 2019
- Simplified Wave Analysis: Review of GOLD for the week of February 21
- Simplified Wave Analysis: review of EUR / JPY pair for the week of February 21
- February 21, 2019: EUR/USD is demonstrating weak bullish recovery around the lower limit of its channel.
- The Australian dollar and the British pound are distinguished by a synchronous fall
- Technical analysis of USD/CHF for February 21, 2019
- Technical analysis of USD/CHF for February 21, 2019
- BITCOIN Analysis for February 21, 2019
- Fundamental Analysis of GBP/USD for February 21, 2019
- Technical analysis of EUR/USD for February 21, 2019
- Bitcoin analysis for February 21, 2019
- Trading plan for 02/21/2019
- Analysis of Gold for February 21, 2019
- EUR/USD analysis for February 21, 2019
- EUR / USD. Market underestimated Fed pigeon protocol
- The Fed can not decide on the rate of interest rates. Forex Market Forecast for February 21
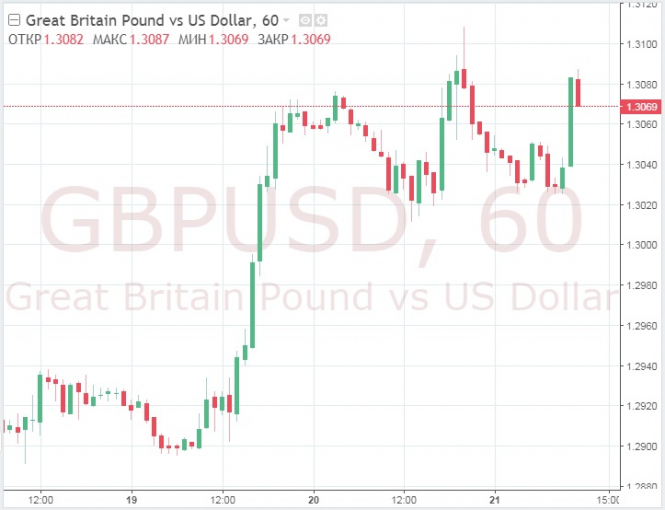
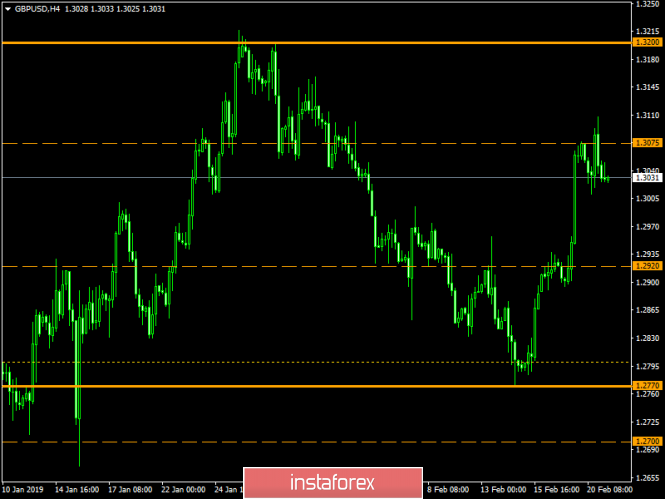
| Trading recommendations for the GBPUSD currency pair - placement of trading orders (February 21) Posted: 21 Feb 2019 04:34 PM PST For the last trading day, the currency pair Pound / Dollar showed a low volatility of 97 points. As a result, it had a stagnation-rollback in the market. From the point of view of technical analysis, we have a pulsed upward trend, where the quotation reached values of 1.3076-1.3108. After that, the phase of stagnation with rollback came. On the other hand, the news and news background had two important events at once. The first was the meeting between Theresa May and Jean-Claude Juncker in Brussels, which did not yield any results once again. Following the talks, Theresa May in her traditions stated that she had a constructive meeting with Chairman Juncker, stressing that it was necessary to make such legally binding changes to the backstop mechanism that would guarantee that it would not be endless. This is what is needed for the transaction to be approved by the House of Commons. However, it should be understood that the decision of the EU regarding the agreement remained the same. The second important event was the publication of the protocol of the Federal Commission on Open Market Operations, which, as expected, did not contain any harsh statements regarding monetary policy. Thus, there was no protocol for the market. Today, in terms of the economic calendar , we have fairly broad statistics from the United States, which in general is not so bad. The total number of people receiving unemployment benefits is reduced from 1.7373K to 1.740K. In turn, the volume of orders for durable goods shows an increase of 1.7%, as well as, in principle, sales in the secondary housing market last January showed an increase from 4.99M to 5.01M. Further development Analyzing the current trading chart, we see that the quote draws amplitude wagging within 1.3020 / 1.3100, having actually a stagnation-rollback. It is likely to assume that this oscillation is likely to continue, with the extension of the framework to 1.3000 / 1.3100, wherein traders will stretch from pending orders in order to break the boundaries. Based on the available data, it is possible to expand a number of variations. Let us consider them: - We consider buying positions in the case of price fixing higher than 1.3115, with the prospect of a move to 1.3200. - We consider selling positions in the case of price fixing lower than 1.3000, with a prospect of 1.2950 (the first point). Indicator Analysis Analyzing a different sector of time frames (TF ), we see that there is an upward interest against the general background of the market in the short, intraday and medium term. Weekly volatility / Measurement of volatility: Month; Quarter; Year Measurement of volatility reflects the average daily fluctuation, with the calculation for the Month / Quarter / Year. (February 21 was based on the time of publication of the article) The current time volatility is 61 points. In case of breakdown of the existing stagnation, volatility can increase, reaching an average daily rate. Key levels Zones of resistance: 1,3200 *; 1.3300; 1.3440 **; 1.3580 *; 1.3700 Support areas: 1.3000 ** (1.3000 / 1.3050); 1.2920 *; 1.2770 (1.2720 / 1.2770) **; 1.2620; 1.2500 *; 1.2350 **. * Periodic level ** Range Level The material has been provided by InstaForex Company - www.instaforex.com |
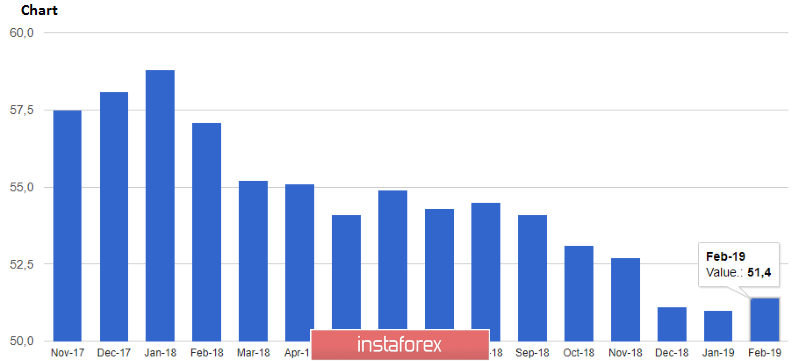
| Posted: 21 Feb 2019 03:07 PM PST Data on Germany continue to upset investors, creating some pressure on risky assets, including the euro, which also fell against the US dollar in the first half of the day after the release of weak reports on the eurozone economy. According to the data, the final consumer price index CPI of Germany in January this year fell by 0.8% compared to December 2018. Compared to January 2018, the index grew by 1.4%. However, the euro fell only slightly against the US dollar at the beginning of the European session, as the data completely coincided with the forecasts of economists. A more significant pressure on the EURUSD pair was exerted by the report, which indicated that the preliminary index of PMI supply managers for the German manufacturing sector in February remained below 50 points, indicating a decrease in activity, and amounted to 47.6 points, while it was projected at 49.9 points. Back in January, the above index was 49.7 points. This has had a significant impact on the overall performance of the eurozone manufacturing sector. According to the results of surveys of supply managers, the production index of the eurozone fell below 50 points and amounted to 49.2 points in February, indicating a decline in activity. Only good preliminary indicators in the service sector, both in Germany and in the eurozone as a whole, have managed to smooth the pressure on the euro. According to the report, the preliminary index of PMI supply managers for the German service sector in February was 55.1 points against 49.7 points in January. Economists had forecast PMI services Germany at the level of 52.9 points. In the eurozone as a whole, according to IHS Markit, the composite index of supply managers, which consists of an indicator of activity in the manufacturing sector and the service sector, rose to 51.4 points in February from 51.0 points in January. Today, the minutes were published from the January meeting of the European Central Bank, which confirmed the concerns of traders that the regulator may start the LTRO program, which will be aimed at long-term refinancing of the banking system. The minutes indicate that the leaders of the ECB at the January meeting discussed new long-term loans for banks, but more accurately everything will be known at the March meeting, when the ECB will revise economic forecasts. The European regulator is confident that potential new lending operations should reflect the objectives of monetary policy in general. There were also concerns related to negative factors for the economy, which are only temporary in nature. Special attention was paid to the risks in connection with the exacerbated situation around Brexit. The material has been provided by InstaForex Company - www.instaforex.com |
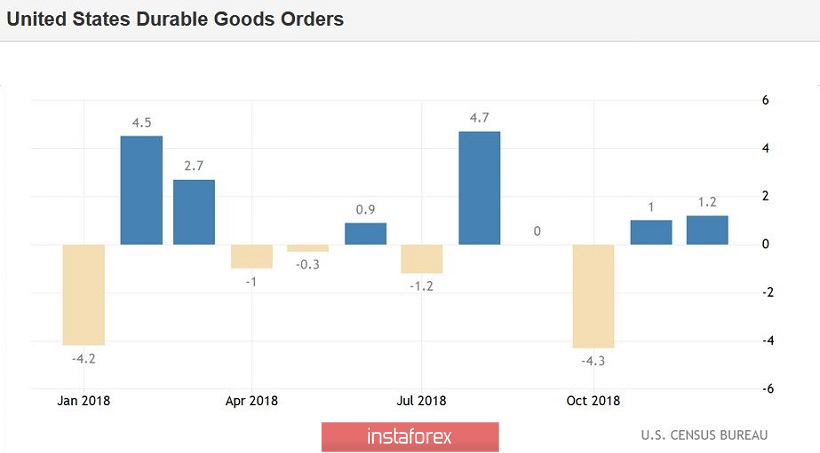
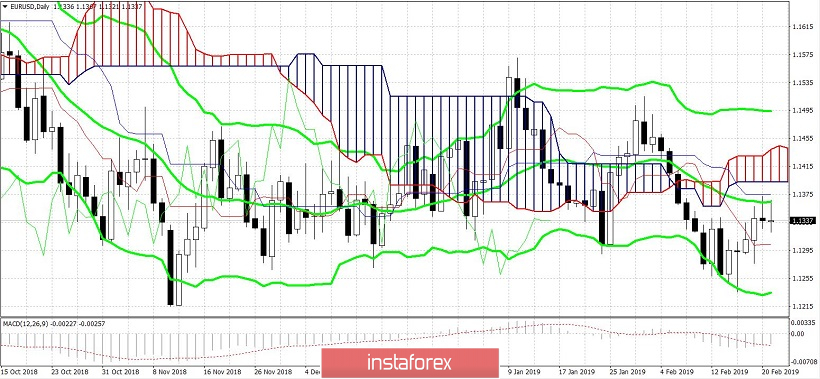
| EUR/USD. Weak US data failed to instill confidence in buyers Posted: 21 Feb 2019 03:07 PM PST At the beginning of the US session, the dollar index fell sharply, dropping in a matter of minutes to the level of 96.2 points. Such a breakthrough was due to the release of disappointing data on the growth of orders for durable goods in the US. Contrary to positive forecasts, the total volume of orders grew by only 1.2% (instead of the expected 1.6%), and excluding transport - by only 0.1% (with a forecast of 0.3%). And although the de facto indicator showed growth, it was much weaker than market expectations. By itself, this fact is not critical, but it aggravated the reaction to the Federal Reserve's minutes published the previous day. As a result, bulls of the EUR/USD pair managed to seize the initiative and tested the resistance of 1.1370 (the middle line of the Bollinger Bands indicator on the daily chart). The US currency fell throughout the market not only because of weak macroeconomic reports. Although, in addition to the disappointing indicator of Durable Goods Orders, today the business activity index in the manufacturing sector of the Federal Reserve Bank of Philadelphia was released, which also showed a very negative trend. In February, the indicator sharply fell into the negative area (-4.1 points) with a growth forecast to 14 points. Apart from the fact that the release turned out to be much worse than the forecast, the indicator has set an anti-record: the index has not fallen below zero since March 2016. The economy was not the only factor that set the tone for today's trade. The fact is that this week another round of trade negotiations between the US and China started. The financial world closely monitors their dynamics, and according to insider information, the likelihood of concluding a "big deal" is very high. According to American journalists, the participants in the dialogue are working on six "memoranda of understanding". These documents will outline the structural issues - in particular, we are talking about intellectual property rights, agriculture, monetary policy and cyberspace. And although these are just "protocols of intent," they will form the basis of a future deal, the key details of which will be discussed by the leaders of the PRC and the United States in person. According to available information, the parties are also discussing a list of priority measures, which includes ten points. China allegedly agreed to fulfill most of the proposed list - for example, Beijing will increase the purchase of American agricultural products (soybeans, corn and wheat) by $30 billion (as a result, these volumes will exceed even the "pre-war" figures). On the one hand, this is a good sign for those who are awaiting a deal. But, on the other hand, China can still be conscientious in more sensitive issues for Beijing (in particular, regarding the regulation of the yuan). Therefore, alertness in the markets remains, and the growth of the euro/dollar pair is uncertain. It is noteworthy that today the traders actually ignored the speech of the Fed representative James Bullard (he has the right to vote this year). And although he for the last 8 months consistently takes a softer stance, today's speech can be attributed to a number of the most "dovish". He made a reduction in interest rates this year, adding that this scenario is "not a baseline". The last time Rafael Bostic talked about a possible interest rate reduction was back in early January, and this statement provoked strong volatility for the EUR/USD pair. Today, the reaction to the words of Bullard was minimal. Most likely, this is due to yesterday's release of the minutes of the last Fed meeting. The regulator clearly enough outlined the prospects for monetary policy and explained - under what conditions the rate will be increased (with an unexpected "spurt" of inflation). The issue of rate cuts was not even discussed, therefore this decision is clearly not on the Fed's agenda. Therefore, the market reacted to the words of Bullard accordingly. Although the American regulator has softened its position, the number of supporters of the rate cut (especially with the right to vote this year) clearly does not prevail. Thus, today's trading day reflected the general mood in the foreign exchange market. So, bears of the EUR/USD "stumbled" on the Fed minutes, which confirmed the "dovish" intentions of the US regulator. In turn, the bulls of the pair are also not able to show character: despite several upward impulses, the price was not able to break through the support level of 1.1370 (the average line of the Bollinger Bands indicator on the daily chart) to approach the next key level of 1.1390 (the lower limit of the Kumo cloud). Overcoming these levels would allow the pair to enter the 14th figure, but the uncertain behavior of traders reduces the likelihood of this scenario. As a result, the pair remained within the wide-range flat again. Despite unsuccessful attempts to grow, the priority is still with the upward movement. Bears of EUR/USD will reverse the situation in their favor only when securing below 1.1235 (the lower line of the Bollinger Bands on the daily chart). The material has been provided by InstaForex Company - www.instaforex.com |
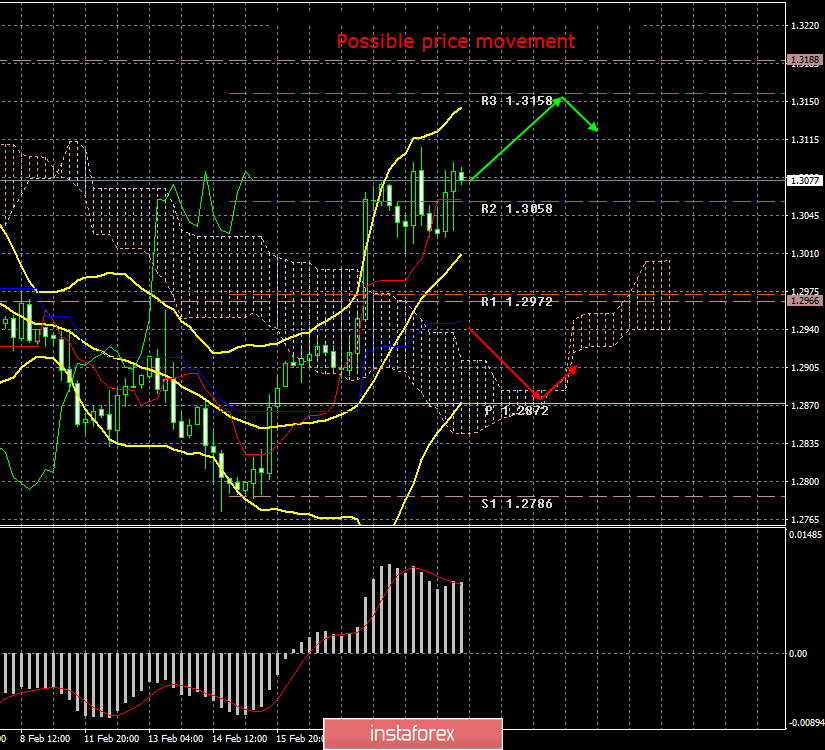
| Posted: 21 Feb 2019 03:07 PM PST 4-hour timeframe The amplitude of the last 5 days (high-low): 117p - 113p - 50p - 177p - 97p. Average amplitude for the last 5 days: 111p (107p). On Thursday, February 21, the British pound sterling also showed an upward movement. However, in general, we can not say that this strengthening of the pound sterling was provoked by some fundamental event. First, the upward movement was not so strong, and secondly, no important macroeconomic reports were published in the UK for today. The pullback can only be a reaction to yesterday's publication of the Fed's minutes, which, firstly, indicated a possible curtailment of the Fed's balance reduction program, and secondly, that a new increase in the key rate will be possible only if inflation accelerates. In general, the minutes can be called "dovish", however, the essence of this document is not in itself of crucial importance. The specific decisions of the regulator, the specific actions are important. In general, in the near future, the pair might once again rush downwards. Meanwhile, several ministers of the British Parliament threatened Theresa May with a "riot" if she did not postpone withdrawal from the EU at a later date and thereby lose the opportunity to blackmail Parliament with a "hard" Brexit. The Spanish Foreign Ministry also said that a new agreement is already being developed in Brussels, but it is not known how much this information is true. So far, EU officials have only stated that they are not against the postponement of the UK's exit from the EU. Thus, there is no unambiguously positive information for the pound sterling, which means that the pair will still be prone to downward movement. Trading recommendations: The GBP/USD currency pair has overcome the level of 1.3058, but in the coming hours it can start a new round of correction, which will be signaled by the MACD indicator turning down. Sell positions can be seen again with a view to 1.2872, if bears can seize the initiative on the instrument and gain a foothold below the Kijun-sen critical line. In addition to the technical picture, fundamental data and the timing of their release should also be taken into account. Explanation of illustration: Ichimoku Indicator: Tenkan-sen-red line. Kijun-sen – blue line. Senkou span a – light brown dotted line. Senkou span B – light purple dotted line. Chikou span – green line. Bollinger Bands Indicator: 3 yellow lines. MACD: Red line and histogram with white bars in the indicator window. The material has been provided by InstaForex Company - www.instaforex.com |
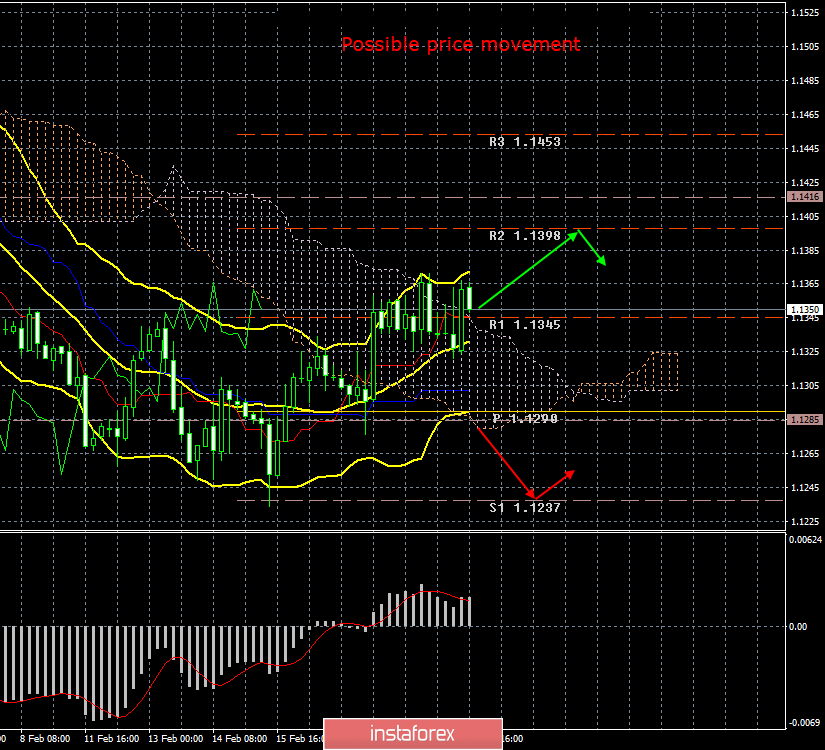
| EUR/USD. February 21st. Results of the day. European PMIs and US reports disappoint traders Posted: 21 Feb 2019 03:07 PM PST 4-hour timeframe The amplitude of the last 5 days (high-low): 82p - 72p - 45p - 82p - 46p. Average amplitude for the last 5 days: 65p (73p). On Thursday, February 21, the EUR/USD currency pair again made a breakthrough upwards, which in the illustration appears very convincing, but in fact is only 35 points. Preliminary values of business activity indices in the eurozone for February did not show a general trend. Thus, the composite index of business activity and IDA in the service sector surpassed forecast values, and the index of business activity in the manufacturing sector was worse than market expectations. Moreover, the last index was 49.2, and any value below 50 indicates a negative trend. Thus, we consider that in general these reports characterize business activity in the EU as negative. Disappointed with the report on orders for durable goods in the United States. The overall figure for December showed an increase of 1.2% against the forecast of +1.5%. The index of business activity in the manufacturing sector of the Federal Reserve Bank of Philadelphia turned out to be negative at -4.1%. The fact that most of the published macroeconomic information was preliminary saved the pair from stronger movements. Therefore, instrument volatility remains medium in strength and is now prone to decline. From a technical point of view, the pair broke through the Ichimoku cloud and the resistance level of 1.1345, however, the pair is not able to continue moving upwards. Already on the current bar, the MACD indicator may turn down, signaling a new round of corrective movement. Trading recommendations: The EUR/USD pair overcame the level of 1.1345. Therefore, buy orders with a target of 1.1398 are now relevant, and a turn of the MACD indicator downwards will indicate therpund of a downward correction. Sell orders will become relevant not earlier than the reverse consolidation of the price below the Kijun-sen line and, preferably, below the level of 1.1285, but even in this case, the potential for the pair to fall below 1.1250 is very small. In addition to the technical picture, fundamental data and the timing of their release should also be taken into account. Explanation of illustration: Ichimoku Indicator: Tenkan-sen-red line. Kijun-sen – blue line. Senkou span a – light brown dotted line. Senkou span B – light purple dotted line. Chikou span – green line. Bollinger Bands Indicator: 3 yellow lines. MACD: Red line and histogram with white bars in the indicator window. The material has been provided by InstaForex Company - www.instaforex.com |
| The cost of oil peaked again in the last three months Posted: 21 Feb 2019 06:54 AM PST By the end of Wednesday's trading on February 20, the price of Brent crude oil updated its three-month high, reaching $ 67.37 a barrel. According to experts, support for oil prices was largely due to the uncertainty about Brexit. Recall that on March 29 of this year, the UK is scheduled to leave the European Union. However, the situation around Brexit is full of contradictions in connection with analysts who advise taking into account the possibility of a tough development of events. At the same time, the UK is not ready to extend the free trade agreement with Japan and South Korea until it leaves the EU. Note that these Asian countries annually purchase British exports of 18.6 billion pounds. The UK Commerce Minister assured the leadership of these countries that the relevant agreements would be ready for signing the day after Brexit. The current situation is supporting black gold prices, experts say. For example, the oil trader Trafigura purchased Brent oil from Vitol for delivery in March with a premium of 40 cents. This markup is considered the maximum for the last four months. When Equinor was selling oil at a premium of 45 cents, the above was only the value of the October deal. According to experts, the uncertainty regarding Brexit can lead to disruptions in the supply of black gold, so oil traders tend to minimize possible risks. Futures for Brent crude oil rose more than 1% to $ 67.15 a barrel for April delivery. Since the beginning of this year, the North Sea grade of raw materials has risen in price by 24.8%. The cost of WTI light crude oil increased by 1.62%, to $ 57 per barrel. |
| Posted: 21 Feb 2019 06:38 AM PST To open long positions on the GBP / USD pair, you need: As long as trading is above the resistance of 1.3037, the demand for the British pound will continue. However, the bulls need a breakthrough and consolidation above the resistance of 1.3089, which may coincide with a bad report on the American economy, which will lead to a new wave of GBP/USD growth to highs in the 1.3152 and 1.3214 area, where I recommend taking profits. In the case that the pair returns below the support level of 1.3037, it is best to consider new long positions to rebound from a minimum of 1.2984. To open short positions on the GBP / USD pair, you need: For the bears to resume the downward correction, a bad news on Brexit or a good report on the state of the American economy is needed. Forming a false breakdown and returning below the resistance level 1.3089 will be the first signal to open short positions in the pound in order to reduce and consolidate below support 1.3037, which will increase the pressure on the pair and lead to a test of the minimum of 1.2984, where I recommend fixing the profit. In the case of a pound rise in the second half of the day above the resistance of 1.3089, it is best to consider new short positions after updating the highs of 1.3152 and 1.3214. More in the video forecast for February 21 Indicator signals: Moving averages Trade remains in the region of 30- and 50-moving averages, which indicates the lateral nature of the market. Bollinger bands A break of the upper border of the Bollinger Bands indicator near 1.3090 may lead to a new wave of pound growth. Description of indicators MA (moving average) 50 days - yellow MA (moving average) 30 days - green MACD: fast EMA 12, slow EMA 26, SMA 9 Bollinger Bands 20 The material has been provided by InstaForex Company - www.instaforex.com |
| Posted: 21 Feb 2019 06:36 AM PST To open long positions on EUR / USD pair, you need: After a weak report on PMI index activity in the eurozone, euro buyers failed to rise higher than the resistance of 1.1355 but the demand remains. In the afternoon, all attention will be focused on data of the US economy but the bulls still need to breakdown and consolidation above the resistance of 1.1355, which will lead to a larger upward correction already in the area of maximum 1.1394 and 1.1432, where I recommend taking profits. In the event of a EUR/USD decline, long positions can be opened on the condition that a false breakdown is formed in the support area of 1.1319 or on a rebound from the minimum of 1.1279. To open short positions on EUR / USD pair, you need: Today, euro sellers formed a false breakdown, which I drew attention in the morning forecast. As long as trading will be below 1.1355 resistance, we can count on a further EUR/USD decline to the support area of 1.1319, where I recommend taking profits. In case of consolidation below this level, the pressure on the EUR/USD pair may increase significantly, which will return the pair to the area of the minimum at 1.1279. With a scenario of further upward correction and a break of 1.1355, which can happen after the publication of weak data in the US, you can sell the euro to rebound from a maximum of 1.1394 and 1.1432. More in the video forecast for February 21 Indicator signals: Moving averages Trade remains in the region of 30- and 50-moving averages, which indicates the lateral nature of the market. Bollinger bands In the case of an upward correction, growth will be limited by the upper limit of the Bollinger Bands indicator in the area of 1.1366. However, a breakthrough of this level will be a good signal to buy. Description of indicators MA (moving average) 50 days - yellow MA (moving average) 30 days - green MACD: fast EMA 12, slow EMA 26, SMA 9 The material has been provided by InstaForex Company - www.instaforex.com |
| How the dollar reacted to the Fed's protocols and what has changed in the regulator's strategy? Posted: 21 Feb 2019 06:25 AM PST While the dollar waits for the publication of the Fed's minutes, it went up again and the reason for this was more than serious. The minutes of the Fed revived expectations of a possible rate hike this year. In the meantime, the dollar rose slightly against the yen and reduced losses against the euro after the Fed said in the minutes of the last meeting that the US economy. The labor market remained strong, which strengthened the market's opinion about a possible increase in the interest rate. Recall that the Fed last month took the markets by surprise with their dovish comments, which looked like a signal that the regulator would stop the campaign to raise interest rates. Yet, the tone of the Fed has changed now. The dollar continued to grow, as the protocols seemed to reassure market participants, who remained confident that the Fed would raise rates this year. However, if you analyze the protocols in more detail, it becomes clear that they are not generally very different from the January speeches. Hence, it is too early to draw any conclusions that the Fed can easily change its strategy. We can say with confidence only one thing: the current attention of the market will return to the problems of the trade conflict. Most likely, the timing of the introduction of new tariffs will be extended and this may mean that Europe and Japan may face problems. Remember, US President Donald Trump said that the United States will impose tariffs on imports of European cars if they can not conclude a trade deal with the European Union. |
| Intraday technical levels and trading recommendations for GBP/USD for February 21, 2019 Posted: 21 Feb 2019 05:51 AM PST
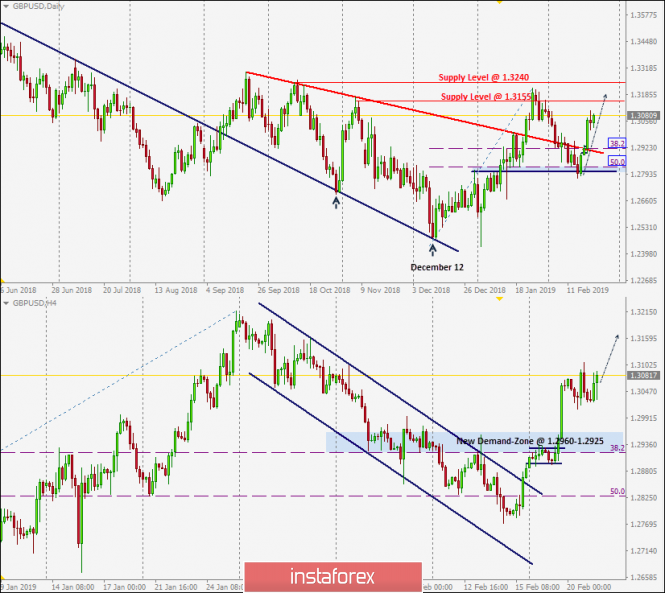
On December 12, the previously-dominating bearish momentum came to an end when the GBP/USD pair visited the price levels of 1.2500 where the backside of the broken daily uptrend was located. Since then, the current bullish swing has been taking place until January 28 when the GBP/USD pair was almost approaching the supply level of 1.3240 where the recent bearish pullback was initiated. Shortly after, the GBP/USD pair lost its bullish persistence above 1.3155. Hence, the short-term scenario turned bearish towards 1.2920 (38.2% Fibonacci) then 1.2820-1.2800 where (50% Fibonacci level) is roughly located. Last week, lack of bullish demand was demonstrated around 1.2920 until Friday when significant bullish recovery was demonstrated around 1.2800-1.2820 (Fibonacci 50% level) resulting in a Bullish Engulfing daily candlestick. This initiated the current bullish breakout above the depicted H4 bearish channel. Hence, remaining bullish target is projected towards 1.3155, 1.3200 and 1.3240. On the other hand, the GBP/USD pair currently has a significant demand zone located around (1.2960-1.2925) to be watched for BUY entries. Bullish persistence above 1.2960 (newly-established demand zone) remains mandatory so that the current bullish movement can pursue towards the mentioned bullish targets. Any bearish breakdown below which invalidates the whole bullish scenario for the short term. Trade Recommendations : Any bearish pullback towards the depicted H4 demand zone (1.2960-1.2925) should be watched for a valid BUY entry. S/L to be located below 1.2890. T/P levels to be located around 1.3040, 1.3155 and 1.3235. The material has been provided by InstaForex Company - www.instaforex.com |
| Simplified Wave Analysis: Review of GOLD for the week of February 21 Posted: 21 Feb 2019 05:51 AM PST Large timeframe: Since September last year, gold quotations are moving up. The wave completes a complex correctional model of weekly timeframe. The preliminary target zone is approaching the lower boundary. Small timeframe: Since the end of January, a descending trend has formed on the gold chart. In the wave of the main trend, this is a correction that has the wrong appearance. From the current price level, you can expect a short-term decline, after which the bullish wave will continue. Forecast and recommendations: In the coming days, price movements are expected mainly in the lateral plane. Flat mood can last the whole week and too early for sales. It is recommended to wait for the completion of the correction and look for signals to buy the instrument. Resistance zones: - 1375.0 / 1380.0 Support areas: - 1310.0 / 1305.0 Explanations of the figures: The simplified wave analysis uses waves consisting of 3 parts (A – B – C). Three consecutive graphs are used for analysis. Each of these analyzes the last incomplete wave. Zones show calculated areas with the highest probability of reversal. The arrows indicate the wave marking by the method used by the author. The solid background shows the formed structure and the dotted exhibits the expected movement. Note: The wave algorithm does not take into account the duration of tool movements over time. To conduct a trade transaction, you need confirmation signals from the trading systems you use! The material has been provided by InstaForex Company - www.instaforex.com |
| Simplified Wave Analysis: review of EUR / JPY pair for the week of February 21 Posted: 21 Feb 2019 05:49 AM PST Large timeframe: The older timeframe cross shows a downward wave, which set the course of the price trend the whole year of 2018 and reached a strong level of support. Small Timeframe: The rising wave of January 3 has a strong reversal potential. On a larger scale, the plot will eventually form a wave equivalent to the previous decline. Before the price rushes up, a downward rollback is likely to happen. Forecast and recommendations: On the chart of the instrument, the preparations in continuing the upward course are completed. The flat phase of the movement may end this month while sales are not recommended. The focus is on finding signals to enter long trades. Resistance zones:- 125.90 / 126.40 - 128.10 / 128.60 Support areas: - 124.90 / 124.40 Explanations of the figures: The simplified wave analysis uses waves consisting of 3 parts (A – B – C). Three consecutive graphs are used for analysis. Each of these analyzes the last incomplete wave. Zones show calculated areas with the highest probability of reversal. The arrows indicate the wave marking by the method used by the author. The solid background shows the formed structure and the dotted exhibits the expected movement. Note: The wave algorithm does not take into account the duration of tool movements over time. To conduct a trade transaction, you need confirmation signals from the trading systems you use! The material has been provided by InstaForex Company - www.instaforex.com |
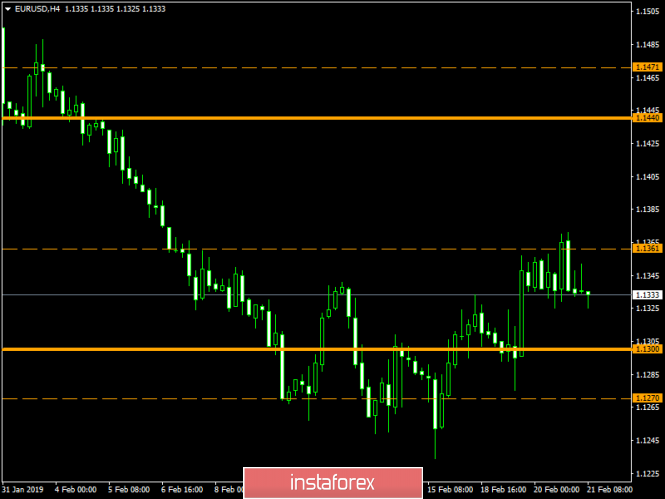
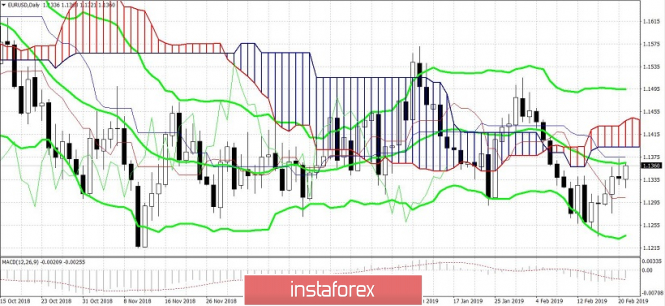
| Posted: 21 Feb 2019 05:20 AM PST
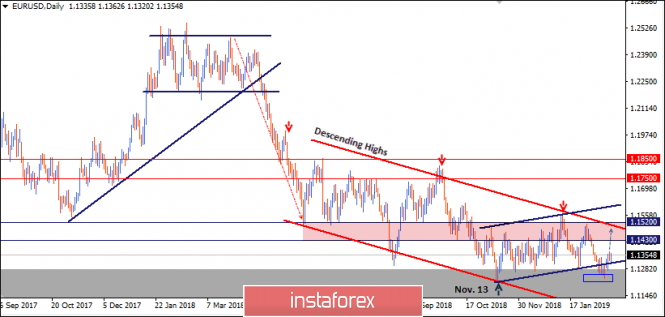
Since June 2018, the EUR/USD pair has been moving sideways with slight bearish tendency within the depicted bearish Channel (In RED). On November 13, the EUR/USD pair demonstrated recent bullish recovery around 1.1220-1.1250 where the current bullish movement above the depicted short-term bullish channel (In BLUE) was initiated. Bullish fixation above 1.1430 was needed to enhance a further bullish movement towards 1.1520. However, the market has been demonstrating obvious bearish rejection around 1.1430 few times so far. The EUR/USD pair has lost its bullish momentum since January 31 when a bearish engulfing candlestick was demonstrated around 1.1514 where another descending high was established then. On February 5, a bearish daily candlestick closure below 1.1420 terminated the recent bullish recovery. This allowed the current bearish movement to occur towards 1.1300-1.1270 where the lower limit of the depicted DAILY channel came to meet the pair. The EUR/USD pair is demonstrating weak bullish recovery around the depicted price zone (1.1300-1.1270) with early signs of bearish reversal probability (Yesterday's bearish hammer daily candlestick). A bearish flag pattern may become confirmed if bearish persistence below 1.1250 is achieved on the daily-chart basis. Pattern target is projected towards 1.1000. Trade Recommendations: A counter-trend BUY entry was already suggested near the price level (1.1285) (the lower limit of the depicted movement channel). T/P level to be located around 1.1350 and 1.1420 while S/L should be advanced to entry level. The material has been provided by InstaForex Company - www.instaforex.com |
| The Australian dollar and the British pound are distinguished by a synchronous fall Posted: 21 Feb 2019 03:43 AM PST
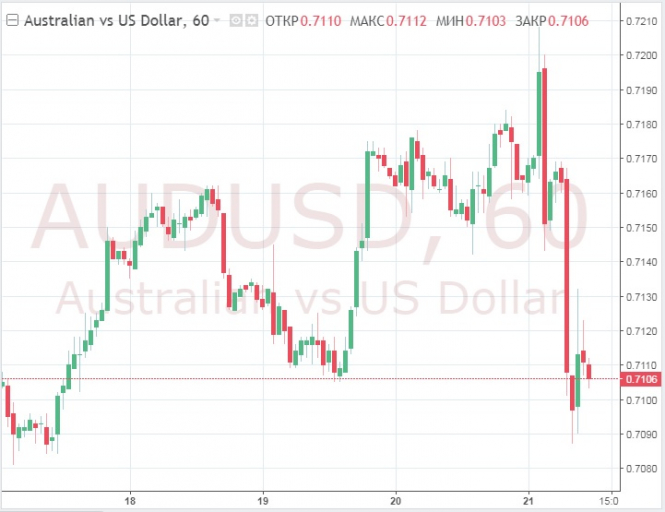
The Australian dollar is losing value again, experiencing a very volatile session. Recall that at the beginning of the session, the Australian rose to a two-week high of 0.7207 dollars, which was helped by strong employment data in January. However, it failed to linger at the summit and quickly lost altitude. Traders attributed the fall to Westpac's lower-interest rate predictions. At the same time, the currency suffered even more after the customs in the northern Chinese port of Dalian banned the import of coal from Australia. The ban on the import of coal from Australia, which has been in force since the beginning of February, extends to large ports and other parts of China, which increases the delivery time for Australian coal to at least 40 days. In addition, the Governor of the Reserve Bank of Australia (RBA), Philip Low, in early February, forced the "Australian" to fall, backing away from the long-standing strategy of the Central Bank, stating that the next step could be to lower interest rates. It will be difficult for the Australian dollar to grow after the RBA seems to have taken the "pigeon" position.
The New Zealand dollar, as they say , went to the trailer and suffered collateral damage from the fall of the Australian counterpart. The pound fell 0.15 percent to 1.3031 dollars, rolling away from the almost three-week high of 1.3109 dollars which was reached the day before. Sterling was defeated after three lawmakers deserted British Prime Minister Theresa May from the ranks of the ruling conservative party, which could undermine her efforts at Brexit. The pound is also under pressure from the Fitch Ratings rating agency, which stated that it could downgrade the UK credit rating to "AA", based on growing uncertainty over Brexit.
|
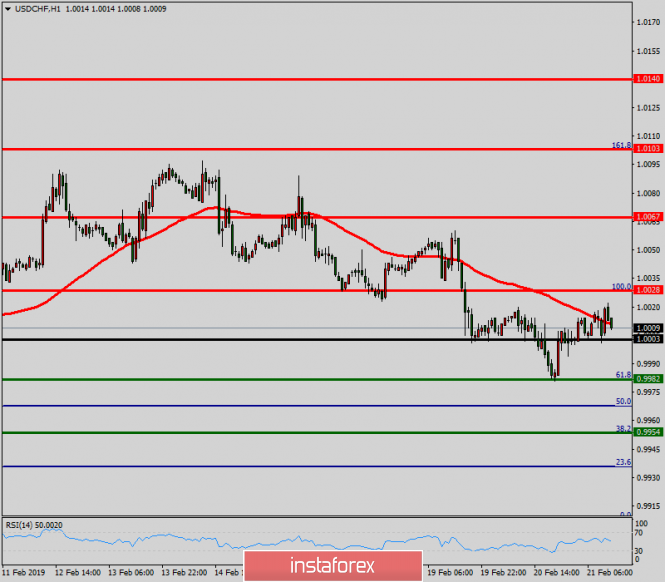
| Technical analysis of USD/CHF for February 21, 2019 Posted: 21 Feb 2019 03:31 AM PST Overview: The USD/CHF pair continues to move upwards from the level of 1.0003. Today, the first support level is currently seen at 1.0003, the price is moving in a bullish channel now. Furthermore, the price has been set above the strong support at the level of 0.9982, which coincides with the 50% Fibonacci retracement level. This support has been rejected three times confirming the veracity of an uptrend. According to the previous events, we expect the USD/CHF pair to trade between 1.0003 and 1.0067. So, the support stands at 1.0003, while daily resistance is found at 1.0067. Therefore, the market is likely to show signs of a bullish trend around the spot of 1.0003. In other words, buy orders are recommended above the spot of 1.0003 with the first target at the level of 1.0067; and continue towards 1.0103 and 1.0140. However, if the USD/CHF pair fails to break through the resistance level of 1.0030 today, the market will decline further to 0.9908. The material has been provided by InstaForex Company - www.instaforex.com |
| Technical analysis of USD/CHF for February 21, 2019 Posted: 21 Feb 2019 03:31 AM PST Overview: The USD/CHF pair continues to move upwards from the level of 1.0003. Today, the first support level is currently seen at 1.0003, the price is moving in a bullish channel now. Furthermore, the price has been set above the strong support at the level of 0.9982, which coincides with the 50% Fibonacci retracement level. This support has been rejected three times confirming the veracity of an uptrend. According to the previous events, we expect the USD/CHF pair to trade between 1.0003 and 1.0067. So, the support stands at 1.0003, while daily resistance is found at 1.0067. Therefore, the market is likely to show signs of a bullish trend around the spot of 1.0003. In other words, buy orders are recommended above the spot of 1.0003 with the first target at the level of 1.0067; and continue towards 1.0103 and 1.0140. However, if the USD/CHF pair fails to break through the resistance level of 1.0030 today, the market will decline further to 0.9908. The material has been provided by InstaForex Company - www.instaforex.com |
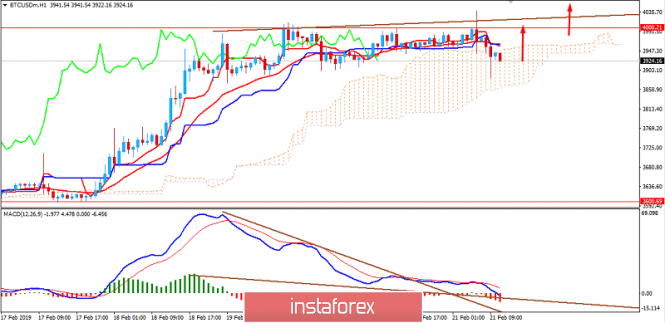
| BITCOIN Analysis for February 21, 2019 Posted: 21 Feb 2019 03:25 AM PST Bitcoin moved lower after rejecting off the $4,000 area with a daily close as expected. Recent formation of Bearish Divergence at the price area of $4,000 provided evidence of the recent dip in the market which is likely to be viewed as retracement for a further upward move. BTC advance is currently subdued by the Kumo Cloud as support, while dynamic levels such as 20 EMA, Tenkan and Kijun line are neutral above the current price line. Though Bitcoin is losing its shine, it still maintains demand among crypto investors that is being reflected in the chart. The BTC rally starting off the $3,500-600 showcases the bullish market sentiment which will push the price higher after a retracement and downward corrections. As the price remains above $3,500-600 with a daily close above $4,000, be ready for further bullish pressure with a target towards $4,250 and later towards $4,500. FUNDAMENTAL ASPECT: NEUTRAL TECHNICAL ASPECT: BULLISH MOMENTUM: VOLATILE POSSIBILITIES: STRONG BULLISH ABOVE $4,000
|
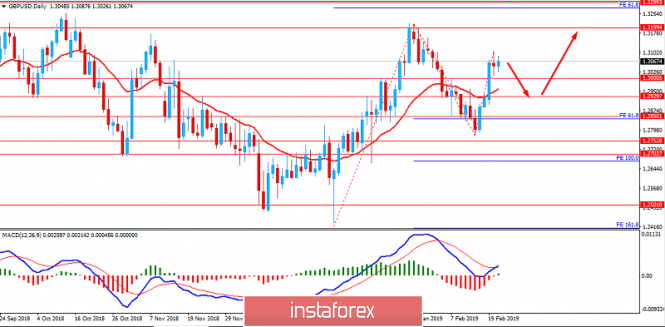
| Fundamental Analysis of GBP/USD for February 21, 2019 Posted: 21 Feb 2019 03:07 AM PST BREXIT being still uncertain is leading to indecision between the traders worldwide whereas the UK economy is currently being questioned. A Deal Brexit or No Deal Brexit will have different impact on the overall UK economy as well as global economy. UK Prime Minister Theresa May is currently looking forward to find a way out of Brexit impasse and mounting evidence that an agreement is within reach. Though recent meeting between May and European Commission President Juncker had a joint statement about the meeting being constructive but not such confidence is yet seen in the markets. The optimism did manage to push GBP higher than USD in the process but sustaining it further with a long-term view is still very much uncertain. Recently, Fitch stated that a No Deal Brexit is going to disrupt UK economic and trade prospect which may lead to a great downfall of the economy in no time. Today UK Public Sector Net Borrowing report was published with positive outcome of decrease to -15.8B from the previous figure of 2.1B which was expected to be at -11.1B. Though Average Earning Index was recently published unchanged at 3.4% which was expected to increase to 3.5% and Claimant Count Change report was published with decrease to 14.2k from the previous figure of 20.2k which could not meet the expected figure of 12.3k did not quite affect the overall gains of the GBP in the process. On the USD side, according to the minutes of the January policy meeting, the Fed advocates for a patient approach to rate hikes and also flags the end of balance sheet runoff. During the meeting, the policymakers did not express any commitments. As a result, the market is hesitant about trading preferences that makes USD/JPY trade without a clear-cut trend. According to San Francisco FED President Mary Daly, the US economy is facing headwinds. In this context, the Federal Reserve should align its balance sheet policy with the unchanged approach to interest rates. Higher downward pressure, including a slowdown in the global economy, tighter financial conditions, and rising uncertainty over international trade, assures the US central bank to keep rates steady this year. Today US Durable Goods Orders report is going to be published. Durable goods orders ex transportation are likely to increase to 0.3% from the previous value of -0.4%, Durable Goods Orders are expected to increase to 1.6% from the previous value of 0.7%. Philly Fed Manufacturing Index is expected to decrease to 14.1 from the previous figure of 17.0 and Unemployment Claims are expected to decrease to 228k from the previous figure of 239k. At present, the fate of GBP is still very much uncertain whereas USD outlook is quite stable and more favorable. Though certain weak economic reports on the USD have been published recently, market sentiment on GBP is uncertain ahead of BREXIT. Meanhwile, investors are betting on USD strength in the future. Now let us look at the technical view. The price recently was quite indecisive while residing above 1.30 area with a daily close that will reinforce bearish pressure before the price climbs higher towards 1.3200-1.3350 resistance area in the coming days. As the price remains above 1.30 area with a daily close, the bullish bias is expected to continue further.
|
| Technical analysis of EUR/USD for February 21, 2019 Posted: 21 Feb 2019 03:01 AM PST The EUR/USD pair below around the weekly pivot point (1.1393). It continued to move downwards from the level of 1.1393 to the bottom around 1.1335. Today, the first resistance level is seen at 1.1393 followed by 1.1426, while daily support 1 is seen at 1.1335. Furthermore, the moving average (100) starts signaling a downward trend; therefore, the market is indicating a bearish opportunity below 1.1393. So it will be good to sell at 1.1393 with the first target of 1.1335. It will also call for a downtrend in order to continue towards 1.1294. The strong daily support is seen at the 1.1254 level. According to the previous events, we expect the EUR/USD pair to trade between 1.1393 and 1.1254 in coming hours. The price area of 1.1393 remains a significant resistance zone. Thus, the trend is still bearish as long as the level of 1.1393 is not broken. On the contrary, in case a reversal takes place and the EUR/USD pair breaks through the resistance level of 1.1393, then a stop loss should be placed at 1.1453. The material has been provided by InstaForex Company - www.instaforex.com |
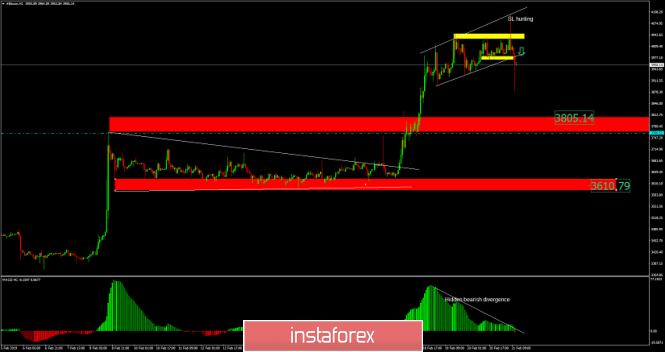
| Bitcoin analysis for February 21, 2019 Posted: 21 Feb 2019 02:29 AM PST
BTC has been trading upwards and the level of $4.100. Anyway, we found the strong reaction from sellers from the resistance, which is a sign that buying looks risky. We also found the breakout of the intraday support at $3.970, which is another sign of weakness. Supports are seen at the price of $3.805 and at $3.610. Yellow rectangle – $4.045 (Resistance) Yellow rectangle - $3.970 (Resistance) Red rectangle - $3.805 (Support) Red rectangle - $3.610 (Support) Trading recommendation: We exited our long position on BTC and we started to sell from $3.962 with stop at $4.100. Targets are set at the price of $3.805 and $3.610. The material has been provided by InstaForex Company - www.instaforex.com |
| Posted: 21 Feb 2019 02:20 AM PST The content of the text of the minutes of the meeting of the Federal Commission on Open Market Operations fully coincided with the expectations of traders who, before publication, sold the dollar. As expected, the Federal Reserve System tried to exclude direct indications of the possibility of mitigating the parameters of monetary policy from the text of the protocol. However, the text of the protocol states that members of the Committee should be flexible in terms of developing decisions on the refinancing rate. Therefore, it becomes obvious.
However, the next meeting of Theresa May and Jean-Claude Juncker again ended in nothing. The blood oaths about the complete mutual understanding of the parties and moving in the right direction, uttered for the umpteenth time, still seem to be able to influence the tender public. After all, this only explains the constant growth of the pound during such meetings, caused by the belief that Brexit will run smoothly and smoothly.
Beginning today, the publication of preliminary data on business activity indices in Europe. If in the service sector it should grow from 51.2 to 51.4, then in industry it is expected to decline from 50.5 to 50.3. As a result, the composite index of business activity is likely to grow from 51.0 to 51.1. Almost simultaneously with preliminary data on indices of business activity in Europe, there are data on borrowing of the public sector in the UK, which could be reduced by 11.1 billion pounds. In the previous month, data was increased by 2.1 billion pounds. So, the expectations in the Old World are to some extent quite good and can be the reason for a slight strengthening of a single European currency and pound. However, most interesting things will happen in the late afternoon after a whole block of American statistics begins to be published. The first will be published data on applications for unemployment benefits, the total number of which should be reduced by 43 thousand. In particular, the number of initial applications may be reduced by 10 thousand, and repeated ones by 33 thousand. Also, orders for durable goods may increase by 1, 7%. In addition to all this, housing sales in the secondary market are likely to increase by 0.8% after a 6.4% decline in the previous month. However, questions raise forecasts based on a preliminary assessment of business activity indices. After all, if the business activity index in the service sector can increase from 54.2 to 54.3, and in the manufacturing sector it should decrease from 54.9 to 54.7, then it is not entirely clear why the composite index of business activity is expected to grow from 54.4 to 55.1. Of course, he must grow, but not so much. The euro / dollar currency pair, after a brief upward move, reached a value of 1.1370. This reflects accumulations in earlier periods. It is likely to assume that the current stagnation of 1.1325 / 1.1370 will result in a rollback to 1.1315 / 1.1300.
After the impulse move, the currency pair pound / dollar reached a value of 1.3000, after which we saw a phase of stagnation-pullback. It is likely to assume that the quotation will approach the previously passed level of 1.3000, where it will continue the amplitude wagging near it.
|
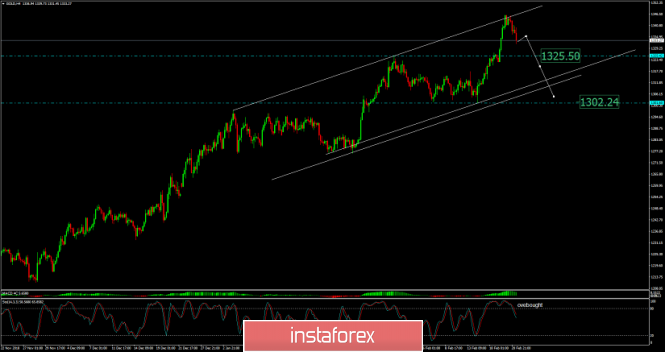
| Analysis of Gold for February 21, 2019 Posted: 21 Feb 2019 02:18 AM PST
The Gold market went into the overbought condition at the price of $1.346.00, which is a sign that buying looks risky. In our view, downward correction is the potential scenario to happen on Gold. Support is seen at the price of $1.325.00 and again at $1.302.00. Key short-term resistance is set at $1.346.00. Trading recommendation: We exited our long position on Gold on the breakeven and now we are neutral to bearish. The material has been provided by InstaForex Company - www.instaforex.com |
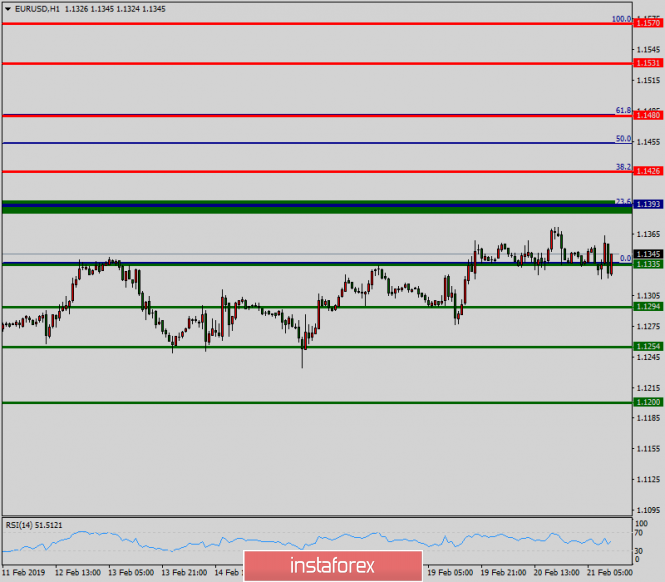
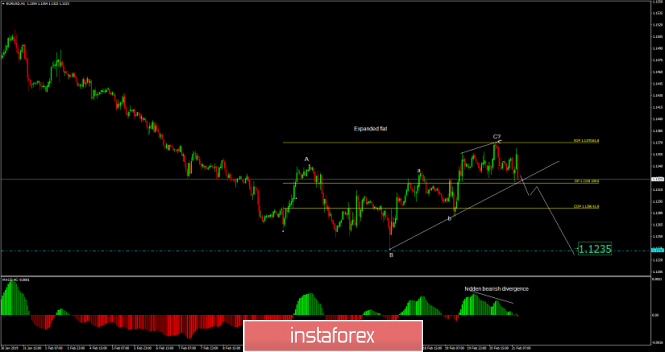
| EUR/USD analysis for February 21, 2019 Posted: 21 Feb 2019 02:03 AM PST
Short-term important resistance at 1.1370 (Fibonacci expansion 161.8%) held successfully, which is a sign that buying EUR/USD at this stage looks risky. In our opinion, EUR/USD completed the upward correction (expanded flat ABC), which is a sign that sellers may continue with new selling. There is also a hidden bearish divergence on the MACD oscillator, which is another sign of weakness. Breakout of the intraday support level at 1.1318 would confirm downward movement. R3: 1.1372 R2: 1.1396 R1: 1.1420 Pivot: 1.1348 S1: 1.1324 S2: 1.1300 S3: 1.1275 Trading recommendation: We are shot EUR from 1.1327 with stop placed at 1.1375. Profit target is set at the price of 1.1235. The material has been provided by InstaForex Company - www.instaforex.com |
| EUR / USD. Market underestimated Fed pigeon protocol Posted: 21 Feb 2019 01:10 AM PST The Fed's protocol was published yesterday. Despite its pigeon character, the protocol only had little impact on the dynamics of dollar pairs. First, market participants were ready for pessimistic assessments by the regulator. The previous speeches of the Fed representatives prepared the ground for an adequate perception of soft rhetoric. Second, the Federal Reserve noted during its January meeting that the US economy is in good condition, and the slowdown in monetary policy tightening is primarily due to uncertainty about future prospects, where the main risks come from China and Europe.
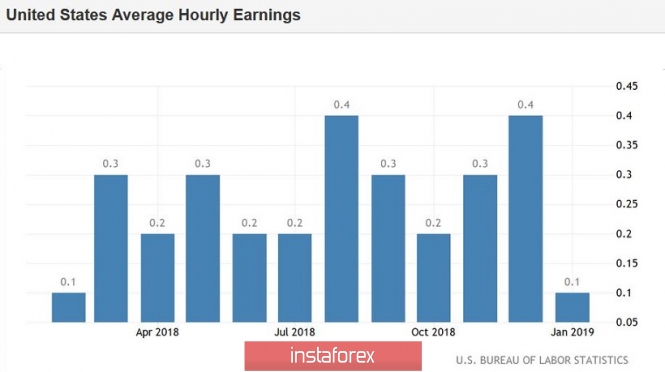
As a result of this release, the euro / dollar pair showed, at first glance, an inadequate reaction - instead of the expected growth, the price dropped to the base of the 13th figure. In my opinion, the southern price pullback is quite understandable and justified. The market was too "screwed up" by the fact that the Fed takes a too soft position - to the extent that it will announce the end of the rate-raising cycle with direct text. But nothing extraordinary happened, the regulator reflected the main points of the January meeting, specifying only its position in a more detailed form. As a result, the market followed the rule "buy on rumors, sell on facts", which was the reason for the "inadequate" behavior of the couple. In fact, the Fed gave no reason to strengthen the dollar. By and large, the regulator recognized that the rate has already reached the lower limit of the neutral level: according to some fed members, raising rates may be necessary only if inflation exceeds basic forecasts. However, most of them stated that the inflationary pressure is weakening, and this year's trend may continue. Some members of the Committee believe that the core inflation will be below the target of two percent for a long time, and this fact will be the main reason for the wait-and-see approach to the parameters of monetary policy. Such a formulation is quite alarming for dollar bulls. It is worth recalling here that the US consumer price index in annual terms moved slowly since November of last year, having gone from 2.5% to 1.6% in January. On a monthly basis, the indicator for three months ranges from -0.1% to zero. Core inflation is also not happy with success: since November 2018, it has been going out at the same level — 0.2% (m / m) and 2.2% (g / g). A disturbing factor is the fact that the growth in the level of wages in January has significantly decreased - to 0.1%. Such dynamics can negatively affect inflationary growth, taking into account all other constraining circumstances (in particular, the volume of retail sales in the USA is decreasing at the maximum rate over the last nine years).
In other words, in the foreseeable future , one should not expect any inflationary breakthrough. At best, key indicators will fluctuate in the area of current levels. This means that the Fed will not change the parameters of monetary policy over the next six months. According to a number of experts, the regulator will have to wait until 2020. If the situation won't not change for any better next year, it may even reduce the rate by 25-50 basis points. In my opinion, it is still too early to talk about such a scenario. But now, it can be said with confidence that until September of this year; one should not expect decisive action from the Fed. In addition to the prospects for monetary policy , the members of the Federal Reverse raised another burning issue. We are talking about reducing the rate of folding the balance of the Fed. According to the officials, the volume of reserves may approach its "adequate level" this year. However, no decisions were made on this matter. The regulator said that at one of its subsequent meetings, the Central Bank will announce plans to stop the process of reducing the size of the balance. Thus, yesterday, the market clearly underestimated the significance of the published protocol. His main thesis suggests that the rate will be increased only in exceptional cases - for example, if inflation rushes sharply upwards. However, there are no prerequisites for this; therefore, a rather obvious conclusion is being made that for many months (and possibly by the end of the year), the Fed will take a wait-and-see attitude.
From the point of view of technology, the situation has hardly changed since yesterday. The EUR / USD bulls were able to hold above 1.1305 (Tenkan-sen line) and did not lose their growth potential. Now, their task is to overcome the resistance level of 1.1390 (the lower boundary of the Kumo cloud on the daily chart). Bears of the pair still need to fix below 1.1270 - in this case, the Ichimoku indicator will form a bearish Parade of Lines signal, and the price itself will be between the middle and lower lines of the Bollinger Bands indicator on the same timeframe. And although such a deep southern pullback is not excluded, the priority so far remains behind the northern movement, given the prevailing fundamental picture of the pair. The material has been provided by InstaForex Company - www.instaforex.com |
| The Fed can not decide on the rate of interest rates. Forex Market Forecast for February 21 Posted: 21 Feb 2019 12:41 AM PST Signals for the EUR / USD pair: A Breakout on the level of 1.1355 will lead to the growth of the euro in the area of 1.1394 and 1.1432. However, a breakthrough on1.1319 will lead to sales of the euro in the area of 1.1279 and 1.1235. Signals for the GBP / USD pair: A Breakout on the level of 1.3058 will lead to growth of the pound in the area of 1.3106 and 1.3159. On the other hand, a breakthrough on 1.3025 will lead to sales of the pound in the area of 1.2984 and 1.2916. Fundamental data:
|


| You are subscribed to email updates from Forex analysis review. To stop receiving these emails, you may unsubscribe now. | Email delivery powered by Google |
| Google, 1600 Amphitheatre Parkway, Mountain View, CA 94043, United States | |
No comments:
Post a Comment