Forex analysis review |
- Trading recommendations for the GBPUSD currency pair - placing trade orders (February 25)
- Analysis of the divergence of EUR / USD on February 25. The couple can not find strength for further growth
- Analysis of the GBP / USD Divergences for February 25. The growth potential of the pound is limited until the level of 1.3094
- Wave analysis of GBP / USD for February 25. Theresa May supports the pound, but only in words
- Indicator analysis. Daily review for February 25, 2019 for the pair GBP / USD
- EUR / USD: Greenback's remarkable resilience and euro's ghostly hopes for growth
- Trump gave up the slack
- Goldman Sachs published forecasts of oil prices, there is reason for optimism
- USA and China: one more step towards the "big deal"
- Yen gave way
- Control zones AUDUSD 02/25/19
- GBP / USD: plan for the American session on February 25. The pound is trying to continue to grow
- Control zones EURUSD 02/25/19
- Trump once again kept the markets from collapsing
- EUR / USD. 25 February. Trading system "Regression Channels". Empty news calendar - the couple is standing still
- GBP / USD. 25 February. Trading system "Regression Channels". Theresa May sees "positiveness" in negotiations with the EU.
- EUR and GBP: Brexit voting has been postponed. The Fed believes in price stability and growth prospects
- Weekly review of the foreign exchange market from 02/25/2019
- USD/CAD. The depressive loonie is waiting for inflation data
- EUR/USD. 25th of February. Results of the day. New duties on Chinese imports will not be introduced
- GBP/USD. 25th of February. Results of the day. Mark Carney reiterated that Brexit without a "deal" is extremely risky
- Trump encouraged currency markets. What to look out for while there is pause war
- EUR / USD: plan for the US session on February 25. Euro returned to the upper border of the side channel
- Wave analysis of EUR / USD for February 25. Eurocurrency needs a positive news background for continued growth
- Bitcoin analysis for February 25, 2019
| Trading recommendations for the GBPUSD currency pair - placing trade orders (February 25) Posted: 25 Feb 2019 05:42 PM PST By the end of the last trading week , the currency pair Pound / Dollar showed a high volatility of 111 points, drawing a wide amplitude. But according to the result, it still stayed within the previous range. From the point of view of technical analysis, we have a rapprochement with the psychological level of 1.3000, but the attempt to break it was unsuccessful. As a result, we returned to the confines of the cluster, , slightly expanding the boundaries of 1.3000 / 1.3100. On the other hand, the news background had a number of statements about Brexit. We begin with the fact that the expected vote in the British Parliament on February 27 on the so-called "Plan B" will be postponed until March 12, as Theresa May said the other day, referring to further negotiations with the EU. At the same time, the British government is considering the possibility of postponing the withdrawal from the EU by 2 months. The cabinet believes that two months is enough to bring the situation out of the impasse in which it is now. If we go back to reality, what prevented the government from 2016 from preventing such an impasse that exists now, is that all these transfers are just clean water. In Europe, they are already thinking about transferring Brexit to 2021. Naturally, this kind of delay in leaving Britain from the EU will become possible only if London itself asks for it. Today, in terms of the economic calendar, we do not have any statistics. However there will be a speech by the head of the Bank of England, Mark Carney, who will talk about the reality again, removing the very water that Theresa May likes to provide. 13:00 MSK Speech by the head of the Bank of England, Mark Carney Further development Analyzing the current trading chart, we see that the quote comes close to the upper limit of the cumulative level of 1,3100, leaving behind a fairly steady move from the level of 1.3000. It is still early to talk about the breakdown of the upper boundary, since the quotation is still in the boundary of the cluster. In turn, traders closely analyze the price behavior near the value of 1.3000. On the subject of the breakdown, placing pending orders are considered. Based on the available data, it is possible to expand a number of variations. Let's consider them: - We consider buying positions in the case of price fixing higher than 1.3115, with the prospect of a move to 1.3200. - We consider selling positions in the case of price fixing lower than 1.3000, with a prospect of 1.2950 (the first point). As you can see, the recommendations remain the same. Indicator Analysis Analyzing the different sector of time frames (TF), we see that there is an upward interest in the short, intraday and medium term. It should be understood that as long as the quotation is within the 1.3000 / 1.3000 cluster, indicators on smaller TFs can change arbitrarily. Weekly volatility / Measurement of volatility: Month; Quarter; Year Measurement of volatility reflects the average daily fluctuation, with the calculation for the Month / Quarter / Year. (February 25 was based on the time of publication of the article) The current time volatility is 45 points. In the event of a breakthrough of a particular cluster boundary, we will see a sharp surge in volatility. Otherwise, the volatility will remain within the framework of the previous cluster. Key levels Zones of resistance: 1,3200 *; 1.3300; 1.3440 **; 1.3580 *; 1.3700 Support areas: 1.3000 ** (1.3000 / 1.3050); 1.2920 *; 1.2770 (1.2720 / 1.2770) **; 1.2620; 1.2500 *; 1.2350 **. * Periodic level ** Range Level The material has been provided by InstaForex Company - www.instaforex.com |
| Posted: 25 Feb 2019 05:20 PM PST 4h
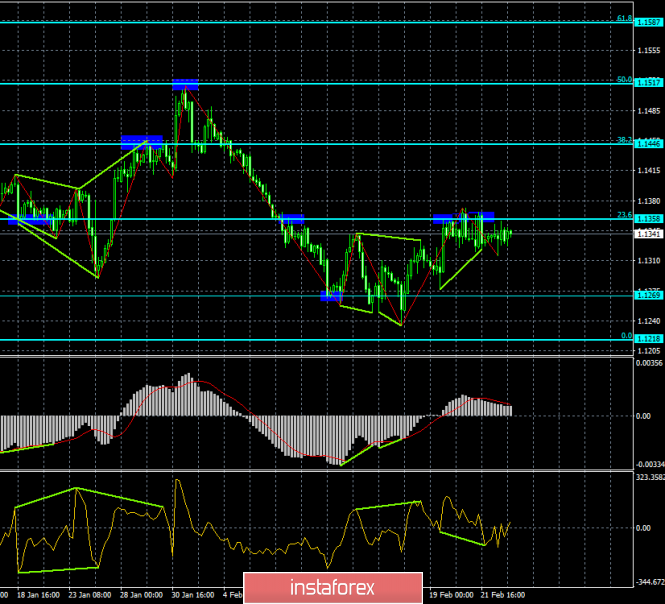
The EUR / USD pair on a 4-hour chart performed a new return to the correction level of 23.6% - 1.1358 after the formation of a bullish divergence in the CCI indicator. The closing of quotations of the pair above the Fibo level of 23.6% will work in favor of continuing growth towards the next level of correction 38.2% - 1.1446. Passing the pair of the last divergence low on February 25 will allow us to expect some drop in prices in the direction of 1.1269. The Fibo grid was built on extremums from September 24, 2018 and November 12, 2018. Daily
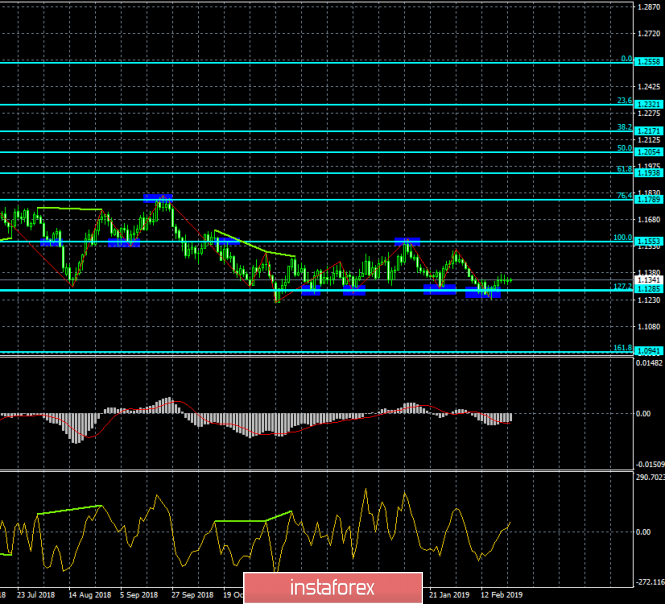
On the 24-hour chart, the couple rebounded from the correctional level 127.2% - 1.1285 and began the process of growth in the direction of the Fibo level 100.0% - 1.1553. There are no maturing divergences on the current chart. Fixing quotes below the level of 127.2% will be interpreted as a reversal of the pair in favor of the American currency, and traders can expect a slight decline in the direction of the correction level of 161.8% - 1.0941. The Fib net is built on extremums from November 7, 2017 and February 16, 2018. Recommendations to traders: New purchases of the EUR / USD pair will be possible with the goal of 1.1446 if the pair closes above the level of 1.1358 and a Stop Loss order below the level of 23.6%. Sales of the EUR / USD pair can be carried out with the target of 1.1269, and with a Stop Loss order above the level of 1.1358, if the pair completes the last low divergence. The material has been provided by InstaForex Company - www.instaforex.com |
| Posted: 25 Feb 2019 05:19 PM PST 4h
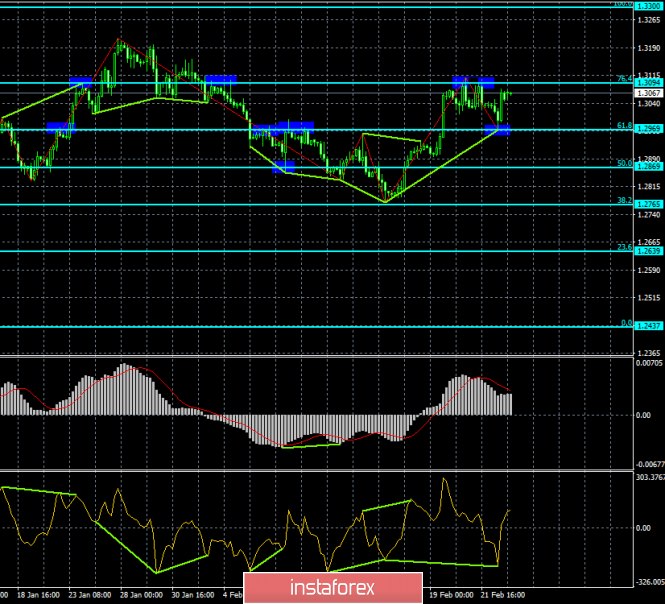
As shown on the 4-hour chart, the GBP / USD pair completed the rebound from the correction level of 61.8% - 1.2969 A reversal in favor of the British currency and began to grow in the direction of the Fibo level 76.4% - 1.3094. A bullish divergence was also formed in the CCI indicator, which coincided with the rebound. Quotes on February 25 from the Fibo level of 76.4% will work in favor of the US dollar and thus, will resume the fall towards the level of 61.8%. Closing the pair above the Fibo level of 76.4% will increase the likelihood of continued growth in the direction of the next level of correction 100.0% - 1.3300. The Fib net is built on extremums from September 20, 2018 and January 3, 2019. 1h
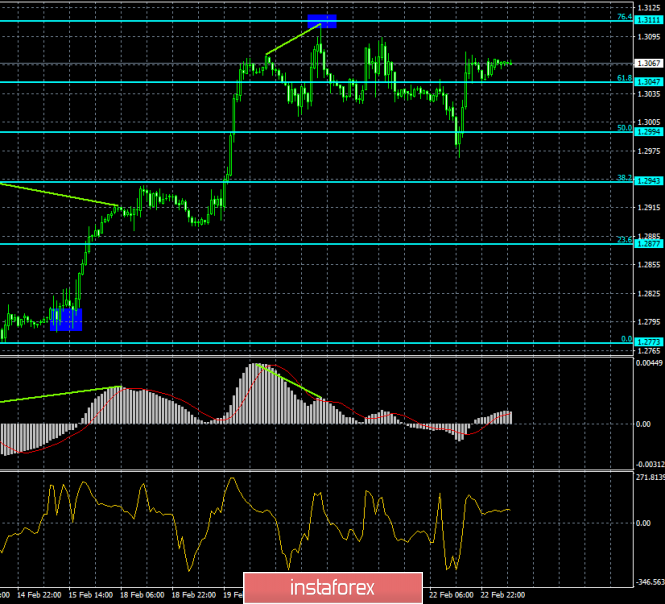
As illustrated on the hourly chart, the pair reversed in favor of the British currency and closed above the correctional level of 61.8% - 1.3047. As a result, the growth process can be continued today in the direction of the next Fib level 76.4% - 1.3111. There is no maturing divergence in any indicator. The close of the pair under the correction level of 61.8% will work in favor of the US currency and some fall in the direction of the Fibo level 50.0% - 1.2994. The Fib net is built on extremes from January 25, 2019 and February 14, 2019. Recommendations to traders: Purchases of the GBP / USD pair can be made now with the target of 1.3094 and a Stop Loss order below the level of 61.8%, since the pair completed the closure above the level of 1.3047 (hourly chart). Sales of the GBP / USD pair can be made with the target of 1.2994 and a Stop Loss order above the level of 61.8% if the pair closes below the level of 1.3047 (hourly chart). The material has been provided by InstaForex Company - www.instaforex.com |
| Wave analysis of GBP / USD for February 25. Theresa May supports the pound, but only in words Posted: 25 Feb 2019 05:19 PM PST Wave counting analysis: On February 22, the GBP / USD pair gained about 15 bp. Nevertheless, there are still more grounds for assuming wave 2 completion. Until a successful attempt to break through the level of 76.4% Fibonacci, the pair retains chances of building a new descending wave 3 with targets located around 1.2770. Meanwhile, the news background for the pair GBP / USD can not be called positive. Theresa May continues to drag out time, postponed the voting date in parliament for March 12, and continues negotiations with the European Union, which only recently disowned these negotiations as he could. In fact, market participants are in no way able to determine whether there is really progress in the negotiations, one that suits the parliament in the final vote, or there is nothing like that. Shopping goals: 1.3109 - 76.4% Fibonacci Sales targets: 1.2734 - 61.8% Fibonacci 1.2619 - 76.4% Fibonacci General conclusions and trading recommendations: The wave pattern still assumes the construction of a new downward wave. Thus, now, I recommend selling the pair with targets located near the estimated marks of 1.2826 and 1.2734, which equates to 50.0% and 61.8% Fibonacci. A successful attempt to break through the level of 76.4% will indicate that the pair is ready for a raise and will break the current wave marking. The material has been provided by InstaForex Company - www.instaforex.com |
| Indicator analysis. Daily review for February 25, 2019 for the pair GBP / USD Posted: 25 Feb 2019 05:18 PM PST Trend analysis (Fig. 1). On Monday, the price will move up. The first upper target 1.3109 is the upper fractal. Fig. 1 (daily schedule). Comprehensive analysis: - indicator analysis - up; - Fibonacci levels - up; - volumes - up; - candlestick analysis - down; - trend analysis - up; - Bollinger lines - up; - weekly schedule - up. General conclusion: On Monday, the price will move up. The first upper target 1.3109 is the upper fractal. The material has been provided by InstaForex Company - www.instaforex.com |
| EUR / USD: Greenback's remarkable resilience and euro's ghostly hopes for growth Posted: 25 Feb 2019 05:01 PM PST
Against the backdrop of expectations on the possible occurrence of a three -year cycle tightening the monetary policy of the US Federal Reserve System (Fed) and its nearing completion, traders began to rely on the weakening of the US currency by the end of last year. However, after the decline in December-January, the greenback was able to get managed in February not only to restore the lost positions, but also to strengthen by almost 1%. This year, the stability of the dollar came as a surprise to many. However, it is hardly surprising, given the fact that the same factors that limit the Fed in actions (slowing global growth and tightening financial conditions), force other central banks to take a more cautious position, "BlackRock representatives said. "It is possible that in the future the market will have to adapt not only to mitigate the Fed's policy, but also to show a more" dovish "attitude of the ECB. It is assumed that in the coming months, the difference in interest rates in Europe and the United States will play in favor of the greenback, "noted JP Morgan Asset Management experts. " Despite the easing of the Fed's rhetoric, the single European currency finally lost its appeal, as well as, the support of those drivers who provided the upward momentum of EUR / USD in 2016-2018. We expect a shift in trade from the range of 1.12-1.15 to 1.10-1.14, "analysts at Barclays said. "The euro against the dollar stuck in the area of 1.12-1.16. We believe that cyclical factors will support the demand for the American currency in the near future, "said strategists at Danske Bank. According to the experts, in the event of a settlement of trade disputes between Washington and Beijing, it will be possible to count on accelerating US economic growth, which is why the Fed will return to a tighter monetary policy to support the greenback. The material has been provided by InstaForex Company - www.instaforex.com |
| Posted: 25 Feb 2019 05:00 PM PST It seems that Donald Trump will not be able to achieve the desired in negotiations with the Chinese on trade. As usual, last weekend, he reported on his Twitter account that the negotiations were "productive" and he decided to extend the truce after March 1. In contrast to the American president, the Chinese side does not so vividly reflect the course of the negotiation process, I can even say it generally shows an enviable restraint of the "heavenly". The absence of any complete information from this side clearly indicates that there is no "productivity" in the negotiation process. Most likely, Trump has to back down and announce the continuation of the truce for this very reason, and he has more than enough reason for this. Last year, the active actions of the American president led to a "failure" in trade between the United States and China, and not only with the latter. The desire to solve all the problems by stifling pressure on competitors in world trade led to a slowdown in the growth of the economy of the PRC, a large Europe and the USA, which led to a general slowdown in the growth of the global economy. Trump, has not managed to solve the trade problem with China as a whole, and the desire to go to the second presidential term will force him to be more accommodating. Therefore, he will have to soften his position on this sensitive issue. Taking this into account, one can expect that optimism with a new force will overwhelm the world markets, which will lead to the continuation of local growth in stock markets, while the US dollar will remain under noticeable pressure. The overall demand for risky assets, as well as the expectation that the Fed will not raise interest rates in the current year and even go to stop reducing the balance, will adversely affect the rate of the US currency. In many ways, the positive theme has already been played on the foreign exchange market. That is why in this situation, we also do not expect a noticeable strong growth in the currencies of competitors, since a truce does not solve all problems, but only pushes them away in time and it's hard to say what all this will result in. Forecast of the day: The EURUSD pair is in a very narrow range of 1.1220-1.1370 in anticipation of resolving the situation around Brexit. It is likely that it will continue until tomorrow's speeches by Theresa May and Jerome Powell. It seems that there is not enough local weakening of the dollar exchange rate for the further growth of the pair. Stronger drivers are needed, which May and Powell can provide. The GBPUSD pair is trading in the range of 1.1260-1.1300, also in anticipation of Theresa May and Jerome Powell speeches.We believe that this range may continue until Tuesday. |
| Goldman Sachs published forecasts of oil prices, there is reason for optimism Posted: 25 Feb 2019 05:00 PM PST
The short-term outlook for oil is moderately optimistic, as the market continues to decline significantly, which is aided by the reduction in the production of the Organization of Petroleum Exporting Countries (OPEC) and Russia, Goldman Sachs said. In the near future, the potential growth on the cost of Brent crude oil is quite high compared with the current level of $ 67.50 per barrel. The global benchmark can be easily traded between $ 70 and $ 75 per barrel, according to a bank analysis report. OPEC and its partners, including Russia, agreed in December to cut oil production under a global supply agreement to prevent a glut in the market this year. Cuts under OPEC, as well as US sanctions on oil exports from Iran and Venezuela, led to an increase in oil prices last week to the highs of 2019. However, in the second half of the year, according to Goldman Sachs, optimism will diminish. Experts has predicted an increased pressure from US shale producers and a possible easing of the terms of the OPEC deal to restrict production. "Saudi Arabia has expressed the view that the markets will be balanced until June. This suggests that a further reduction in supply in the second half of 2019 may not be required. As for long-term forecasts, oil prices are likely to remain under pressure below $ 60 per barrel for Brent and $ 55 per barrel for WTI, " according to Goldman analysts. The material has been provided by InstaForex Company - www.instaforex.com |
| USA and China: one more step towards the "big deal" Posted: 25 Feb 2019 04:33 PM PST Over the past months, representatives of all the central banks of the leading countries of the world, have stated that they are concerned about the current situation in one form or another: some of them (in particular, the deputy head of the RBNZ) allowed the mitigation of monetary policy parameters if the trade war gets its continuation. However, the results of the negotiations ( which, by the way, ended two days later than planned) can be called successful. The parties came to an understanding on a rather complex issue, which concerns the national currency of China. Washington has long complained that Beijing is using the manual control of the yuan as a tool in a trade war. Indeed, last year, the Chinese currency depreciated against the dollar by 5%, from 6.240 to 6.976, reaching a historical record. However, at the end of 2018, when the parties took the first steps to conclude a "truce", the yuan began to recover, with a fairly active pace (currently usd / cny is at around 6.711). In other words, Beijing went to a meeting on this issue several months ago, which only confirmed its intentions now. Thus, according to the head of the American Ministry of Finance, Stephen Mnuchin, the United States and China have agreed to stabilize the yuan. And although he did not clarify the details of the reached agreement, the essence of the agreement is clear: Beijing will no longer devalue the national currency, thereby protecting its country's export sector from the US tariff policy. It is understood that Washington will take a reciprocal step (Trump said that he would be honored to remove trade duties in the event of a deal), but Mnuchin said nothing about any possible actions by the United States. However, even the voiced information suggests that the parties are one step closer to the conclusion of the transaction. Comments of the first persons eloquently speak about it. In particular, the Vice-Premier of the State Council of the People's Republic of China, Liu He, said that during the consultations, the working groups held "fruitful negotiations" and made positive progress in matters of trade balance, agriculture, technology transfer, protection of intellectual property and financial services. In turn, Donald Trump was less verbose, yet he made it quite clear that: : firstly, the trade war would not resume on March 1, and secondly, the chances of concluding a "big deal" are very large. First of all, he said that the deadline for negotiations would be extended - if the parties do not have time to agree on all the points of the preliminary transaction (and most likely, they really do not have time). He added that Washington would "most likely" make a deal with Beijing, since the negotiations are proceeding "quite productively". Also, Trump announced a meeting with Xi Jinping, which can be held in March on the territory of his estate in the state of Florida. In other words, traders can breathe a sigh of relief: on March 1, the trade war will not continue. Moreover, a historical event may take place this spring, when two superpowers complete the annual trade conflict. Despite such encouraging news, the euro- dollar pair finished the trading week in a flat, almost at the opening level. This is explained by the fact that the foreign exchange market "did not wait" for the first results of the negotiations - the main comments of the parties were announced after the close of trading. In addition, the working group extended consultations for another two days, and this factor could also play a certain role in the context of market reaction. On Monday, against the background of a half-empty economic calendar, this topic will surely be recouped by the market. Given the fact that the negotiations ended on a positive note, the dollar will again be under certain pressure. It is also worth recalling here that the data published last week provided little support for the euro: in particular, the composite eurozone PMI index showed a positive trend for the first time in six months (first of all in the service sectors in France and Germany). And although the slightly weak business confidence index from the IFO leveled optimism about this, the eur / usd bulls can prove themselves on the first trading day. ( Kijun-sen line on the daily chart) is quite likely. Support levels are located at 1.1302 (Tenkan-sen line on D1) and at 1.1230 (the bottom line of the Bollinger Bands indicator is on the same timeframe). The material has been provided by InstaForex Company - www.instaforex.com |
| Posted: 25 Feb 2019 04:33 PM PST The Japanese yen started the year so confidently that it immediately became the main favorite of the G10. Nevertheless, since the time of the flash crash, the correction has rejected USD / JPY quotes to two-month high levels. The Goldilocks regime, in which stock indices are growing against the fears of the global economy, forces investors to sell funding currencies as part of a carry trade strategy. While the world's leading central banks adhere to a soft monetary policy, the global risk appetite is growing, which blocks oxygen for the yen's fans. If the 2018th "Japanese" finished the status of the best performer of G10, and the currencies of developing countries, by contrast, became the main outsiders, then the situation in 2019 has radically changed. Investors are no longer frightened by the aggressive monetary restriction of the Fed and rumors about the start of the normalization of the monetary policy of the ECB and BoJ. The Fed focused on a long pause in the rate hike process, while the European Central Bank is ready to launch LTRO, and Haruhiko Kuroda said that if a strong yen threatens to achieve inflation targets, then the Bank of Japan will increase monetary stimulus. In such circumstances, markets do not worry about the lack of liquidity, and the growth of stock indices and low volatility allow players to return to carry trade strategies. In this process, not the least role is played by the progress in trade negotiations between Beijing and Washington. In 2018, the dollar strengthened, because of the war between the leading economies of the world and because of the flight to refuge assets. In 2019, it was deprived of the main Trump cards, and speculators began to take profits. This is clearly seen in the reduction of net long positions in the US currency, which, nevertheless, are still large. Dynamics of speculative positions on the US dollar The yen can not take advantage of the weakness of its main competitor due to the high interest in sales of funding currencies in the framework of the carry trade, but if the macroeconomic statistics for the States continue to deteriorate, the USD / JPY pair will go down. In this regard, the saturated economic calendar in the week to March 1, deservedly attracts the attention of investors to the currency of the rising sun. It is quite sensitive to releases data on the United States due to the high correlation with the yield of US bonds. The decline in interest rates signals an increase in concerns about the deteriorating health of the world's leading economies. The release of an index of consumer confidence, orders for durable goods, GDP and business activity in the manufacturing sector from ISM can affect the balance of power in the analyzed pair. It will be especially interesting to observe its reaction to the release of data on gross domestic product of the United States for the fourth quarter. Technically, on the daily USD / JPY chart, there is a short-term consolidation in the range of 110.2-111. The pair's exit beyond its lower boundary will increase the risks of implementing the 5-0 pattern (rebounding from resistance by 61.8% from the Shark model CD wave, with a subsequent decrease in quotations). On the contrary, a breakthrough of resistance at 111 will create prerequisites for the continuation of the rally. USD / JPY daily graph |
| Posted: 25 Feb 2019 03:23 PM PST The current phase is a mid-term flat, which indicates the need to use weekly extremes for locking in deals and finding patterns to buy or sell from these levels. Today's Asian movement made it possible for the NKZ 1/2 0.7139-0.7133 to be overcome. The closure of the US session will determine the next priority. For growth to the previous week's high, it will be necessary to close trades above the level of 0.7139. This will make it possible for you to look for purchases tomorrow. It is important to note that the downward movement on Thursday was a strong impulse. This made it possible to implement a downward model and test the weekly CP 0.7081-0.7069. Today there has been a change in margin requirements, so it is necessary to rebuild control zones that were not tested last week. The fall resumption model will be developed if the closure of today's US session happens below the NKZ 1/2. This will open the way for the decline, the first goal of which will be the previous week's low. This model remained a priority at the end of last week, but today during Asian trading we can observe an increase in demand, which makes minor adjustments to the search for a pattern for selling. Day short - daily control zone. The zone formed by important data from the futures market, which change several times a year. Weekly KZ - weekly control zone. The zone formed by the important marks of the futures market, which change several times a year. Monthly KZ - monthly control zone. The zone, which is a reflection of the average volatility over the past year. The material has been provided by InstaForex Company - www.instaforex.com |
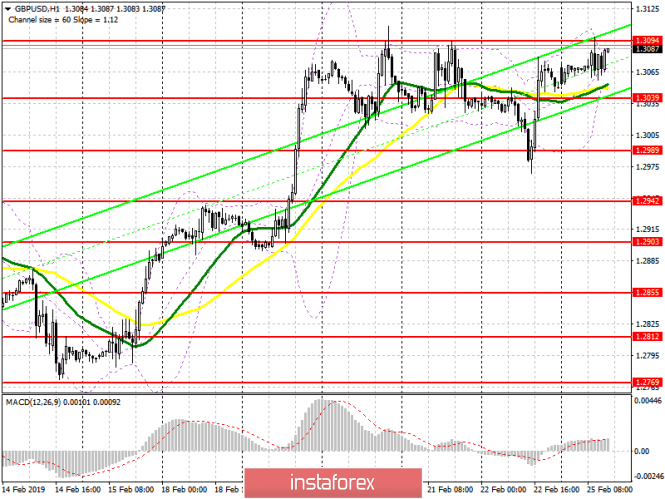
| GBP / USD: plan for the American session on February 25. The pound is trying to continue to grow Posted: 25 Feb 2019 03:11 PM PST Pound buyers, after all the hype with the Fitch Ratings and the postponement of the vote on Brexit, continue to gradually strengthen their positions, but growth is still limited by the upper limit of the side channel around 1.3095. It is best to return to pound purchases with correction from larger support levels around 1.3039 and 1.2989. However, a breakthrough and consolidation above resistance 1.3095 will strengthen the upward impulse and return the pair to the highs of 1.3152 and 1.3214, where I recommend taking profits. To open short positions on GBP / USD you need: Sellers in the first half of the day made a false breakdown in the area of resistance 1.3087, but this did not lead to a large sale of the pound, but only to a slight downward correction. After the pair returned to this range, having built a new resistance 1.3094. Only an unsuccessful attempt to get above this range will lead to a downward trend and the return of GBP / USD to a minimum of 1.3039 and 1.2989, where I recommend taking profits. When scenarios of further growth with the trend, you can open short positions from a maximum of 1.3152. More in the video forecast for February 25 Indicator signals: Moving averages Trade remains at around 30- and 50-moving averages, which indicates the lateral nature of the market, but the advantage on the buyers side is the pound. Bollinger bands Bollinger Bands indicator volatility is very low, which does not give signals on market entry.
Description of indicators
|
| Posted: 25 Feb 2019 03:11 PM PST Work in an upward direction is essential. For those who have already entered a long position after the test of NKZ 1/4 1.1324-1.1320, the basic plan is to keep purchases. The goal of growth is the weekly CP 1.1436-1.1418. If the purchases have not yet been opened, then it is necessary to look at the same NKZ 1/4 and in case there is a formation of the next false breakdown pattern to enter the purchase. The most favorable prices for purchasing the instrument are located within the NKZ 1/2 1.1279-1.1269. If the decline continues to the specified zone, it will be possible to open a position with a very favorable risk-to-profit ratio. The probability of a formation of this model is not high, but the trading plan should take this possibility into consideration The alternative model will be developed if there is a strong fall today, which will make it possible for the US session to close below the level of 1.1269. In this case, the purchase will go by the wayside, and sales at tomorrow's European session will be the key. The probability of formation of this model is 30%, which makes it auxiliary. Sales from current marks are an unprofitable solution. Day short - daily control zone. The zone formed by important data from the futures market, which change several times a year. Weekly KZ - weekly control zone. The zone formed by the important marks of the futures market, which change several times a year. Monthly KZ - monthly control zone. The zone, which is a reflection of the average volatility over the past year. The material has been provided by InstaForex Company - www.instaforex.com |
| Trump once again kept the markets from collapsing Posted: 25 Feb 2019 03:10 PM PST At the opening of the week, Asian markets were trading in the green zone after Trump tweeted "significant progress" on important structural issues in the US-China trade negotiations. New tariff rates will not be introduced on March 1, markets received the news with enthusiasm. The minutes of the January meeting of FOMC, published last week, confirmed the Federal Reserve's intention to complete a program to reduce the balance sheet in the current year. The likelihood of a rapid recession has increased, and forecasts for GDP growth are being revised downward. While the markets do not know where the Fed sees a new normal balance sheet. It is clear that it is not possible to return to the pre-crisis level, and the effect of the balance reduction has had a depressing effect on the markets due to a decrease in liquidity, which led to a sharp increase in short-term dollar financing. The continuation of the policy of reducing the balance sheet will lead to a tightening of the debt market and will bring the onset of a recession. EURUSD The IFO business indicators continued to decline in February, questioning the ability of the German economy to resume growth in the near future. After similar studies from Markit and ZEW showed signs of stabilization after a protracted fall, there was hope that Germany and the eurozone as a whole would begin to emerge after the 2018 failure, but the Ifo brought players back to the ground once again. The IFO business climate index fell to 98.5 p, the worst value since December 2014, pessimism increased by 6 months, and the current state of companies is less favorable. In general, Ifo is a broader study than PMI, therefore its conclusions are more significant. For example, the expectations index in the services sector fell to its lows since 2009, which indicates that forecasts may turn out to be too pessimistic in the near future. On Wednesday, the European Commission will present its version of the research, in the absence of macroeconomic publications, the euro will most likely trade in a wide range near current levels. On Friday, the preliminary estimate of inflation at 1.4% was confirmed, despite a significant change in Germany's indices, in the assessment of which a new model of calculation, taking into account the seasonality of holiday prices, was applied. Confirmation of the assessment is a good signal for the euro, despite the fact that core inflation is frozen at the level of 1.1%, which, of course, is too little to be sure. The euro remains within the upward channel that was formed after February 15, today an attempt to update the high from February 20 and go above the resistance zone of 1.135/70 is likely. GBPUSD The focus in the UK is still on Brexit and any news related to it. A second so-called "meaningful" vote in Parliament is expected to be held on Tuesday, if by this time, Theresa May will be able to achieve some new conditions for the deal with the EU. May scheduled a number of meetings with EU leaders on Monday, tried to achieve some concessions at the summit on February 24-25 in Egypt, but the EU found a technical opportunity to avoid discussing the terms of the deal, citing the fact that not all EU leaders are present at the summit. If May fails to prepare for the vote, or the House of Commons rejects the proposed text of the agreement, another vote will be held on Wednesday, February 27, for an attempt to extend Article 50 in order to prevent a "no agreement." In any case, the intrigue is concluded to the limit, any news can have an impact on the pound. There are almost no macroeconomic publications this week, PMI in the manufacturing sector will be published on Friday, and the index is expected to decline further. The pound might try to take advantage of the weakness of the dollar and attempt to go above the February high of 1.3108. The return to 1.2965 is unlikely, the support on Monday will be the zone of 1.3045/50, the nearest target is 1.3095. The material has been provided by InstaForex Company - www.instaforex.com |
| Posted: 25 Feb 2019 03:10 PM PST 4 hour timeframe Technical details: Senior linear regression channel: direction - sideways. Junior linear regression channel: direction - down. Moving average (20; smoothed) - up. CCI: 69.1370 The EUR / USD currency pair spent the last three trading days in a frank flat. The first trading day of the new week can also pass with weak volatility, since no important macroeconomic report has been scheduled to date. Even the speech of Mario Draghi at the University of Bologna on Friday does not concern any monetary policy or Brexit and, accordingly, won't cause any market reaction. Thus, the pair will have to either spend the whole day in a narrow price range between the moving average line and Murray's level "2/8", or leave this corridor, giving traders technical factors for trading. However, even if Murray's "2/8" level will be reached, this will not guarantee growth for the pair, since the previous two attempts turned out to be false. Thus, the couple is now in an incomprehensible position. Based on this, traders are advised to wait for the situation to be cleared up in order for the emergence of technical grounds, as well as, the opening of certain positions. Jerome Powell will be able to get off the ground. Nearest support levels: S1 - 1,1292 S2 - 1.1230 S3 - 1.1169 Nearest resistance levels: R1 - 1.1353 R2 - 1.1414 R3 - 1.1475 Trading recommendations: Currency pair EUR / USD is adjusted. Therefore, it is recommended to open long positions in case of a confident overcoming the level of 1.1353 and two previous local maxima with the target of 1.1414. Short positions can be considered again after the price is fixed back below the MA. In this case, the tendency for the instrument to change to downward, and the first goal will be the level of 1,1292. In addition to the technical picture should also take into account the fundamental data and the time of their release. Explanations for illustrations: The senior linear regression channel is the blue lines of unidirectional movement. The younger linear regression channel is the purple lines of unidirectional movement. CCI - blue line in the indicator window. The moving average (20; smoothed) is on the blue line located at the price chart. Murray levels - multi-colored horizontal stripes. Heiken Ashi is an indicator with colored bars in blue or purple. The material has been provided by InstaForex Company - www.instaforex.com |
| Posted: 25 Feb 2019 03:09 PM PST 4 hour timeframe
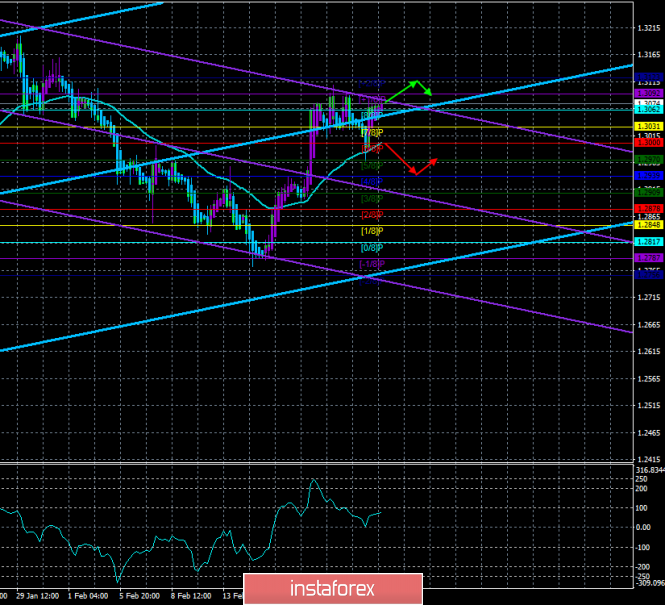
Technical details: Senior linear regression channel: direction - up. Junior linear regression channel: direction - down. Moving average (20; smoothed) - up. CCI: 77.1818 On Monday, February 25, the currency pair GBP / USD resumed its upward movement after a perfect correction to the moving average. However, at the moment, the pair failed to overcome previous local maxima, so the continuation of the upward movement is now in question. During the weekend, it became known that Teresa May once again postponed the date of the vote on Brexit for a term--no later than March 12. According to her, "positive" negotiations with Brexit will continue, and, accordingly, now there is no reason to vote for her "plan B". Well, once again, we note that the whole process may be entering the home stretch, according to Theresa May. Unfortunately, her words about the "positiveness" of the negotiations could mean nothing in practice. The EU's concessions, if at all, will be so minor in the negotiations that the British Parliament will again block a deal with the EU and then either the "hard" Brexit, or the transfer date of exit from the EU. Mark Carney will be speaking in the UK today. He regularly updates the market and the public about the threats which might affect the Brexit even more. Perhaps, we will hear something similar today. From a technical point of view, we are still expecting a downward movement, but in order to work it out, we recommend waiting for the moving average to be overcome. Nearest support levels: S1 - 1.3062 S2 - 1.3031 S3 - 1.3000 Nearest resistance levels: R1 - 1.3092 R2 - 1.3123 Trading recommendations: The pair GBP / USD is trying to resume an uptrend. Now formally are relevant longs with a target of 1.3123. However, there is reason to assume a downward reversal and the formation of a downtrend, so you should be careful with longs. Shorts will again become relevant after the price is fixed back below the moving average line. The targets in this case will be the levels of 1.2939 and 1.2909. In addition to the technical picture should also take into account the fundamental data and the time of their release. Explanations for illustrations: The senior linear regression channel is the blue lines of unidirectional movement. The junior linear channel is the purple lines of unidirectional movement. CCI is the blue line in the indicator regression window. The moving average (20; smoothed) is the blue line on the price chart. Murray levels - multi-colored horizontal stripes. Heiken Ashi is an indicator that colors bars in blue or purple. The material has been provided by InstaForex Company - www.instaforex.com |
| Posted: 25 Feb 2019 03:05 PM PST This weekend it became known that US President Donald Trump is ready to extend the deadline for the conclusion of a trade agreement with China, scheduled for March 1. Trump said that the extension of trade negotiations for two days is a good sign, but for how long the introduction of duties will be postponed was not mentioned. Of course, this is good news for the markets, and if an agreement is reached, the demand for risky assets can grow significantly. On Friday, amid the lack of important fundamental statistics on the US economy, the trader carefully studied the report from the Federal Reserve system. It says that household debt has stabilized since the crisis, but corporate debt has increased significantly. However, the financial sector's vulnerability to borrowing remains low. The Fed is confident that banks and insurance companies are in a good position to survive the economic stress, however, the authorities will be patient before making further adjustments to interest rates. In 2018, the Committee expects US GDP growth to be less than 3%, but consumer prospects remain favorable, which affects income growth, jobs, and low inflation. The speeches of a number of representatives of the Federal Reserve System on Friday were mostly of a similar nature. Some have said that neutral interest rates have fallen in the US and beyond, while others have reiterated statements that the economy is close to maximum employment and price stability. Some Fed representatives noted that quantitative easing has become an important source of stimulating the economy, and the current reduction in the balance sheet has had only a minor impact on the markets. As for the technical picture of the EURUSD pair, it remained unchanged. The main task of buyers of risky assets is to break the high of last week and go beyond the level of 1.1370, which is the upper limit of the side channel. This will make it possible for us to expect a sharp rise in the euro with a test of highs around 1.1400 and 1.1440. In the event of a bearish scenario, and it is also likely, under the current market conditions, a breakthrough in support of 1.1325 can lead to an instant sale of EURUSD and an update of the lows of 1.1280 and 1.1240. The British pound returned to its weekly highs on Friday afternoon, despite rumors of a possible negative revision of the UK's rating by Fitch. Apparently, traders bought the pound amid optimism that Brexit without a deal can be avoided, but yesterday's decision of British Prime Minister Theresa May to postpone the vote in Parliament on the final agreement on Brexit has once again confused everything. The material has been provided by InstaForex Company - www.instaforex.com |
| Weekly review of the foreign exchange market from 02/25/2019 Posted: 25 Feb 2019 03:04 PM PST In fact, throughout the past week, the dollar has lost its position, and this is largely due to the content of the text of the minutes of the meeting of the Federal Commission on Open Market Operations. In principle, as expected, the text of the minutes contains no direct indications of easing the monetary policy of the Federal Reserve System, but it contains quite interesting formulations regarding the need for a flexible approach and patience in the matter of further raising the refinancing rate, given that such language from the Federal Reserve System has not been met for a long time, everyone unequivocally deduced that this is preparing the public for a possible easing of monetary policy. Most likely, this will be done by reducing the rate of reduction in the balance sheet of the Federal Reserve system through asset repurchase. At the same time, US statistics were rather ambiguous. On the one hand, the total number of applications for unemployment benefits fell by 78 thousand, of which 23 thousand were for initial applications, and 55 thousand for repeated ones. Also, orders for durable goods increased by 1.2% against 1.0% in the previous month. Moreover, preliminary data on business activity indices showed an increase in the services sector from 54.2 to 56.2, and a composite index from 54.4 to 55.8. However, the manufacturing index of business activity fell from 54.9 to 53.7. It is worth to note the decline in housing sales in the secondary market by 1.2%. Thus, US data does not give any definite answer about the state of the economy of the United States. In fairness, it should be noted that European statistics are not encouraging. In particular, the growth rate of the construction industry slowed from 1.1% to 0.7%. A preliminary assessment of business activity indexes showed results similar to the US. Thus, with an increase in the business activity index in the services sector from 51.2 to 52.3, and a composite index from 51.0 to 51.4, the production index decreased from 50.5 to 49.2. But the final data on inflation confirmed the fact of its slowdown from 1.5% to 1.4%. But the significance of the content of the text of the minutes of the meeting of the Federal Commission on Open Market Operations is so great that European statistics could be even worse, and no one would have noticed. The British pound strengthened sharply than others, since optimism and hopes for a positive outcome of the regular negotiations between Theresa May and Jean-Claude Juncker prevailed in the market. The meeting ended in the same way as all the previous ones - there are no agreements on the trade component, and Europe does not plan to make any additions or changes to the existing version of the agreement. But endless statements of mutual understanding and movement in the right direction have not yet bothered the market participants. However, British statistics looked somewhat better compared to the United States and the European Union. Of course, Nationwide data showed a slowdown in housing prices from 0.4% to 0.2%, but this is where the negative news ends. The unemployment rate remained unchanged, as did the growth rate of the average wage. The number of applications for unemployment benefits fell from 20.8 thousand to 14.2 thousand, while public sector borrowing decreased by 15.8 billion pounds. Although it is difficult to find something as important and meaningful as the minutes of the meeting of the Federal Commission on Open Market Operations, you will not be bored this week, since many interesting statistical data will be published in the United States. Thus, inventories in the warehouses of wholesale trade can increase by another 0.2%, and in fact the last time they decreased was back in November 2017. So the constant growth of reserves clearly indicates a crisis of overproduction. And in this regard, it is not surprising that the business activity index in the manufacturing sector is only decreasing. The number of new buildings can drop by 0.5%, and the issued permits by as much as 2.8%. Also, the growth rate of housing prices should slow down from 4.7% to 4.5%. On the other hand, production orders should increase by 0.9%, and orders for durable goods by another 0.2%, but this will only slightly smooth out the negative from all previous data. But what is more important is the preliminary GDP data, which may show a slowdown in economic growth from 3.4% to 2.4%, and such a sharp slowdown does not bode well for the dollar. In Europe, however, very few statistics are published, and will be released only at the end of the week. However, this does not reduce their significance, but on the contrary. After all, such important data like unemployment and inflation will be published. If the unemployment rate should remain unchanged, that is, at 7.9%, then the preliminary inflation data may well show its growth from 1.4% to 1.5%. Thus, the single European currency has all the chances to strengthen to 1.1450. But before the week even began, the pound received a wake-up call. Indeed, on Thursday, another vote was scheduled on the issue of a divorce agreement with the European Union. However, Teresa May decided to postpone it, realizing that the Parliament would reject it once again, since there were no changes in the text of the agreement, especially on those fundamental issues that had already been rejected. In the European Union itself, they hinted that they could go on a reprieve right up to 2021, if the British government itself asked for it. However, it is unclear what it will give, since the parties from 2016 can not agree on trade and border issues. At the same time, Europe itself is not eager to come to an agreement on these issues. So we are once again waiting for scandals and rumors, because of which the pound will be thrown from side to side. Naturally, against this background, no one will remember British data, although there will be something to see. In particular, the volume of consumer lending could reach 4.7 billion pounds compared to 4.8 billion pounds in the previous month. Also, the index of business activity in the manufacturing sector can be reduced from 52.8 to 52.0. Equally important, a reduction in the number of approved mortgage applications is expected. However, the next tales about the fact that the parties will still find a solution to unsolvable issues will have a beneficial effect on the pound, and the sterling will be able to strengthen to 1.3350. |
| USD/CAD. The depressive loonie is waiting for inflation data Posted: 25 Feb 2019 03:04 PM PST On Friday, the Canadian dollar paired with the US currency sharply fell by more than 100 points, responding to data on retail sales. Although the indicators showed a positive trend, they did not reach the predicted values, as it remained in the negative area. This fact has turned into a kind of "last straw" for USD/CAD traders, especially on the eve of the Bank of Canada meeting, which will be held in early March. Experts for the most part came to the conclusion that the regulator will not rush to raise the rate, despite the relevant market expectations. This fact has put a lot of pressure on the loonie - and even the weakening of the US dollar at the beginning of this week does not change the situation: the USD/CAD pair is gradually sliding towards the 30th figure. In my opinion, the fears of the marke are justified. The weak growth of retail sales in Canada once again reminded traders of other equally important problems. These include slowing wage growth, easing price pressures, and cooling in the Canadian real estate market. Thus, the average cost of housing decreased by 5.5% over the past year, in particular, due to lower demand and stricter and more complex rules for obtaining mortgage. In general, the Canadian economy has shown signs of slowing in recent months. Traders were disappointed by the dynamics of the industrial sector and the above-mentioned retail sales. These facts affected both the index of business sentiment in the country as well as consumer activity. The situation on the labour market is also not quite clear. The structure of the published indicators shows that the rate of growth of full-time employment has slowed significantly recently, while part-time employment is gaining momentum. This is a rather negative trend, as regular positions imply higher salaries and social security. This state of affairs explains the weakening of wage growth amid falling unemployment. Basic inflation is also suffering: for two consecutive months (in December and January), this figure is in the negative area, "frozen" at the level of -0.2%. In other words, the Canadian central bank has every reason to pause the rate hike process. Just last week, the head of the central bank Stephen Poloz said that he was in no hurry to resume the cycle of tightening monetary policy. In his opinion, the degree of uncertainty has now increased in many ways, so it is necessary to act with extreme caution. Although Poloz agreed that the rate should rise at least to the lower limit of the neutral range (2.5% -3.5%), he did not evaluate the timing of this process. Nevertheless, one can say with certainty: in March, the Bank of Canada will retain the parameters of monetary policy and, possibly, hint at a longer pause. Such prospects may determine the downward trend of USD/CAD, although at the moment it is too early to talk about it. At the moment, bearish sentiment prevails on the pair, but sellers are forced to reckon with the weakness of the US currency. Therefore, today the price is actually stuck in the flat: the position of the Bank of Canada does not allow the pair to increase, and the possible resolution of the US-China trade conflict does not make it possible for the price to sharply drop to the bottom of the 30th figure. The news that there has been significant progress in relations between Washington and Beijing has provoked a thirst for risk in the markets, while the position of the US dollar has noticeably weakened. In recent months, the dollar enjoyed the safe-haven status during the growth of geopolitical tensions. Now in the conditions of a "thaw", the demand for the greenback has fallen, which is confirmed by the dynamics of the dollar index. Thus, the priority for the USD/CAD pair remains down, although the dynamics of the decline will depend on the incoming data. On Wednesday, February 27, inflation data will be published in Canada. According to preliminary forecasts, the consumer price index in annual terms will drop significantly - to 1.4%. Baseline inflation in monthly terms should remain below zero. If this forecast is confirmed, the USD/CAD's fall will become impulsive. Such a fundamental background is consistent with the technical picture of the pair. On the daily chart, the Ichimoku Kinko Hyo indicator has formed a bearish "Parade of Lines" signal, and the price itself is trading between the middle and lower lines of the Bollinger Bands indicator, and is also under pressure from the Kumo cloud. The combination of such signals indicates the priority of the downward scenario, where the price target is the mark of 1.3065- this is the bottom line of the Bollinger Bands indicator on D1. The material has been provided by InstaForex Company - www.instaforex.com |
| EUR/USD. 25th of February. Results of the day. New duties on Chinese imports will not be introduced Posted: 25 Feb 2019 03:04 PM PST 4-hour timeframe The amplitude of the last 5 days (high-low): 45p - 82p - 46p - 46p - 40p. Average amplitude for the last 5 days: 52p (58p). On Monday, February 25, the EUR/USD currency pair was moving up, however, looking at the volatility indicator values in the last three days, it becomes clear that there is a clear flat on the market. Bollinger bands are of the same opinion - they narrowed and turned sideways. During the first trading day of the week, the only information received at the disposal of traders was that "serious" progress was made in the negotiations between China and the United States; new duties on the import of Chinese goods would not be introduced on March 1. The parties also managed to achieve progress in matters of intellectual property, technology, agriculture, services and currencies. This was stated by Donald Trump in his Twitter account. However, as we can see, traders were not very interested in this information, and there was simply no other data. No important macroeconomic reports were published today either. What do we have in the end? The pair can continue to move with a low upward slope, until it receives any important data that will stir up the market. At the same time, the level of 1.1365 has already survived the pressure from traders. Thus, today, a rebound from the designated level is possible and downward movement within the lateral channel that was formed in recent days. A downward MACD indicator may also signal a downward movement. Trading recommendations: The EUR/USD resumed the weakest upward movement. Formally, long positions with the target of 1.1377 (and further to 1.1406) are relevant now, but the entire upward movement could stop around 1.1365. Sell orders are recommended to be considered no earlier than consolidation below the Kijun-Sen line, but even in this case, given the weak volatility, one cannot count on serious downward movement. Looking for strong fundamental data. In addition to the technical picture should also take into account the fundamental data and the time of their release. Explanation of illustration: Ichimoku Indicator: Tenkan-sen-red line. Kijun-sen – blue line. Senkou span a – light brown dotted line. Senkou span B – light purple dotted line. Chikou span – green line. Bollinger Bands Indicator: 3 yellow lines. MACD: A red line and a histogram with white bars in the indicator window. The material has been provided by InstaForex Company - www.instaforex.com |
| Posted: 25 Feb 2019 03:04 PM PST 4-hour timeframe The amplitude of the last 5 days (high-low): 50p - 177p - 97p - 69p - 111p. Average amplitude for the last 5 days: 101p (101p). On Monday, February 25, the British pound sterling stood in one place all day, which, in principle, was expected. There were hopes that Mark Carney's speech would be able to bring activity into the actions of traders, however, they seem to be waiting for official information on Brexit, and not just another portion of platitudes and truths from the head of the Bank of England. Plus, the pair is currently near local highs, and for further growth we need good reasons (from our point of view). But the hike down does not interfere with anything, however, for some reason in recent days, traders have not decided to start selling the British pound. In general, in the past two years, selling the pound seemed the most appealing. And in recent months, especially since the Brexit procedure has been delayed due to Theresa May, who is unable to reach agreement with the EU and the Parliament, and since Parliament is not ready to force Theresa May to resign, but also because her exit plan did not gain approval. In the general opinion, the UK exit date from the EU can be postponed to a later date. Theresa May's speech will take place tomorrow, which will probably inform the whole world about what kind of agreements were reached in negotiations with Jean-Claude Juncker, given the latter's position to not enter into new negotiations with London. Traders did not react to the information about the postponement of the voting date under the May agreement. From a technical point of view, the MACD indicator can move down on the current bar, which will indicate a new round of corrective movement. Trading recommendations: The GBP/USD currency pair could start a new phase of downward movement, which might be the beginning of a new downtrend. However, it is recommended to open shorts not earlier than when traders overcome the critical line with the first goal of 1.2923 (small lots). Buy positions can be recommended if the pair consolidates above 1.3108. In this case, the targets for the new long positions will be the resistance levels of 1.3143 and 1.3176. In addition to the technical picture should also take into account the fundamental data and the time of their release. Explanation of illustration: Ichimoku Indicator: Tenkan-sen-red line. Kijun-sen – blue line. Senkou span a – light brown dotted line. Senkou span B – light purple dotted line. Chikou span – green line. Bollinger Bands Indicator: 3 yellow lines. MACD: A red line and a histogram with white bars in the indicator window. The material has been provided by InstaForex Company - www.instaforex.com |
| Trump encouraged currency markets. What to look out for while there is pause war Posted: 25 Feb 2019 03:03 PM PST
Yuan confidently updated the seven-month high. Commodity currencies such as Australian and New Zealand dollars strengthened markedly, and all this after US President Donald Trump agreed to postpone the planned increase in tariffs on Chinese imports. On Sunday, Trump said that negotiations between Washington and Beijing to end the trade war were able to make a "substantial progress." It is worth noting that the market was not surprised, and in fact, already made preparations regarding the news about the postponement.
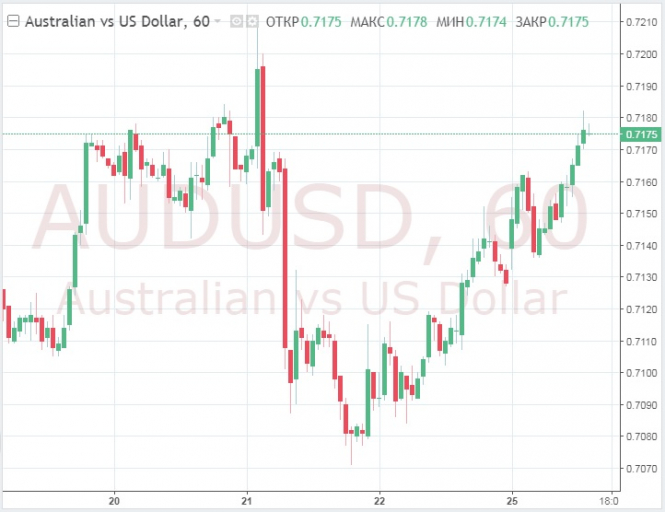
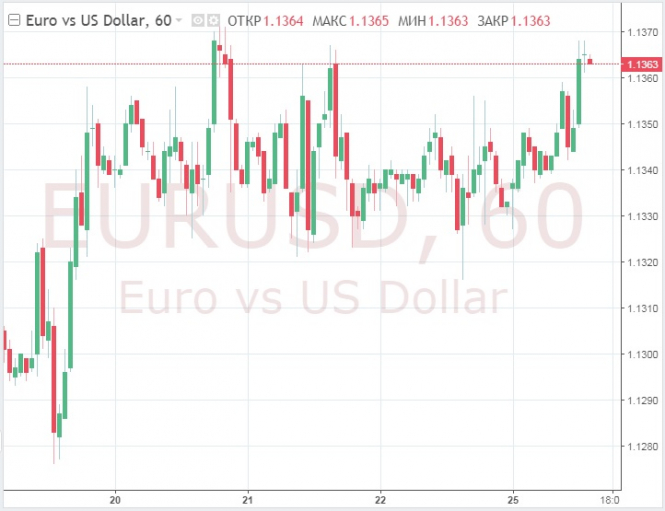
The Australian dollar, which is dependent on Chinese export demand from Australia, rose from 0.4 percent to 0.7160 dollars. The New Zealand dollar was also strengthened by 0.4 percent, to 0.6868 dollars. The risk appetite is holding back the growth of the euro against the dollar, and the pressure is expected to continue. So far, the single European currency is trading within a narrow trading range. However, movements in the foreign exchange markets were a bit calm than they've been in the stock market. Now, the traders will need to focus on global economic indicators. Traders will have to determine the movement of currencies by the next temporary truce in the trade war.
Economic growth in China and world growth in general are considered as two of the fundamental factors. Meanwhile, a decline occurrence in rates has been feared to put pressure on investor sentiment. However, despite this, a huge increase in risky assets took place after the Fed paused its cycle of raising interest rates in 2019. The material has been provided by InstaForex Company - www.instaforex.com |
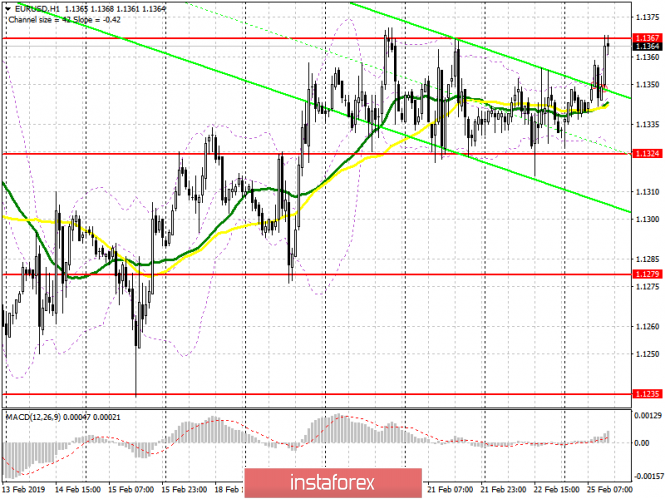
| Posted: 25 Feb 2019 03:03 PM PST The technical picture of the EUR / USD pair remained unchanged compared with the morning forecast, except for the fact that the pair returned to the upper border of the side channel. Breaking and consolidating above resistance 1.1367 is still required, which will lead to a larger upward correction already in the area of maximum 1.1394 and 1.1432, where I recommend taking profits. In the event of a EUR / USD decline, long positions can be opened given that a false breakdown is formed in the support area of 1.1324 or on a rebound from a minimum of 1.1279. To open short positions on EURUSD you need : The lack of important fundamental statistics helps the euro. In the afternoon, sellers will count on the formation of a false breakdown in the area of resistance 1.1367, which will lead to a downward correction to the support area of 1.1324, where I recommend taking profits. The main goal is to break through the lower border of the side channel and reduce to the area of 1.1279 minimum. Under the option of a further upward correction and a break of 1.1367, the euro can be sold for a rebound from the maximum of 1.1394. More in the video forecast for February 25 Indicator signals: Moving averages Trade remains in the region of 30- and 50-moving averages, which indicates the lateral nature of the market. Bollinger bands Bollinger Bands indicator volatility is very low, which does not give signals on market entry.
Description of indicators
|
| Posted: 25 Feb 2019 02:57 PM PST Wave counting analysis: On Friday, February 22, trading ended for EUR / USD with a loss of just a few bp. Thus, the wave pattern of the instrument did not encounter any changes. Wave 4 can be completed, and if this is indeed the case, then the instrument can start a new decline within the framework of future wave 5 from current positions with targets located about 12 figures. At the same time, there is a successful attempt to break through the level of 23.6% on the older Fibonacci grid, and better than 50.0% on the lower grid. This will indicate that the pair is ready to continue the increase. In this case, wave 4 can be identified as a new uptrend with the first targets located near the level of 61.8%. Sales targets: 1.1228 - 0.0% Fibonacci 1.1215 - 0.0% Fibonacci Shopping goals: 1.1356 - 23.6% Fibonacci 1.1408 - 61.8% Fibonacci General conclusions and trading recommendations: The pair allegedly assured the construction of wave 4. Thus, if the level of 23.6% holds, then I recommend selling the pair given the calculation for building wave 5 of the downtrend trend with goals located near the estimated marks 1.1228 and 1.1215. A successful attempt to break through the levels of 23.6% and 50.0% will indicate the continuation of the construction of the upward wave - buy a pair with a target of 1.1408. The material has been provided by InstaForex Company - www.instaforex.com |
| Bitcoin analysis for February 25, 2019 Posted: 25 Feb 2019 06:04 AM PST
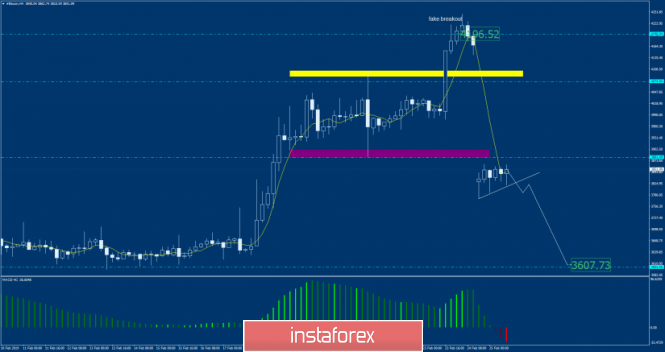
BTC has been trading downwards. The price tested the level of $3.775. In the background, we found a fake breakout of the resistance at the price of $4.050. We also found a potential bearish flag in creation and our advice is to watch for selling opportunities. The key short-term support is set at the price of $3.610. Key short-term resistance is set at the price of $4.200. Trading recommendation: We are looking for the breakout of the $3.775 to confirm further downward continuation. The downward target is set at the price of $3.610. The material has been provided by InstaForex Company - www.instaforex.com |
| You are subscribed to email updates from Forex analysis review. To stop receiving these emails, you may unsubscribe now. | Email delivery powered by Google |
| Google, 1600 Amphitheatre Parkway, Mountain View, CA 94043, United States | |




No comments:
Post a Comment