
Dollar Talking Points:
- The DXY Dollar Index gained modestly this past week, slowing the fastest climb since Oct's peak
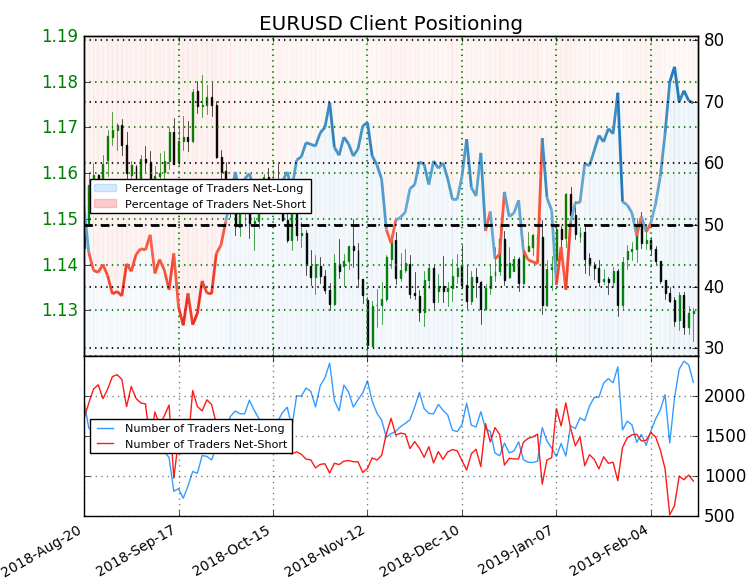
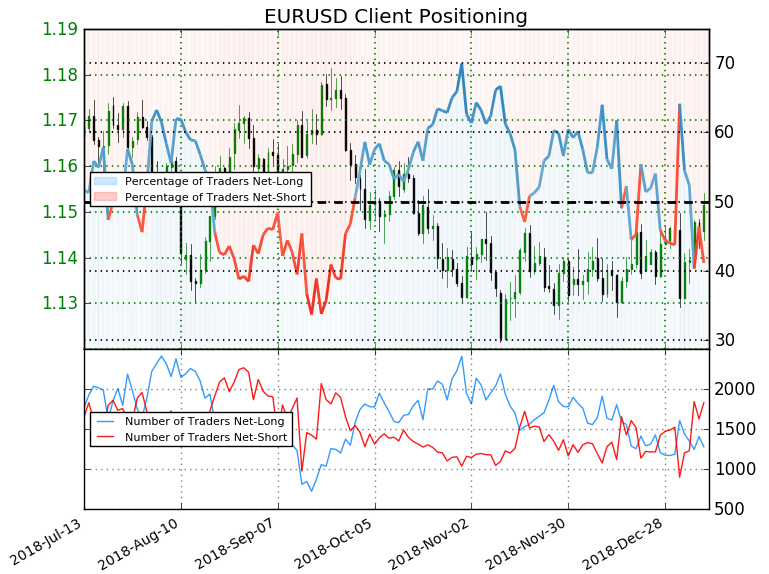
- Retail traders are heavily net long EURUSD – a short Dollar position
- See the 1Q 2019 fundamental and technical forecast for the Dollar updated on our trading guides page
Technical Forecast for US Dollar: Bearish
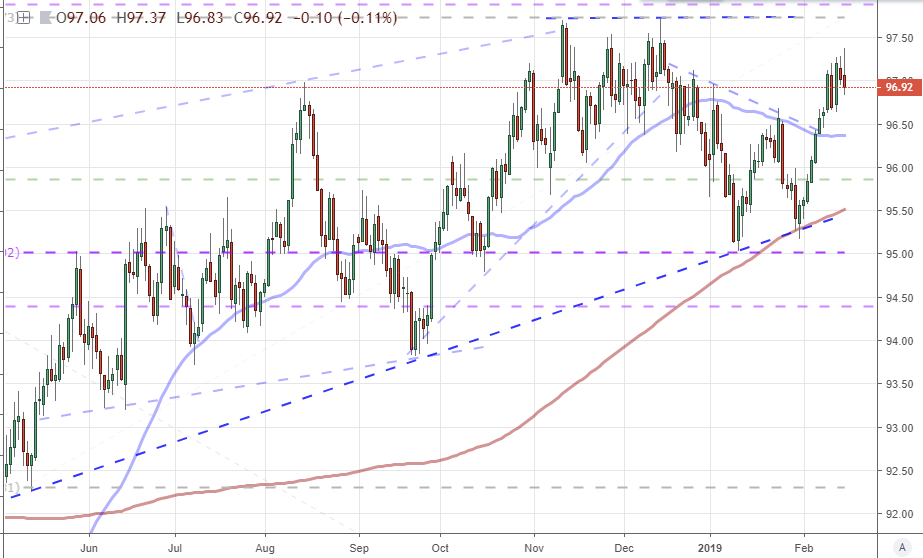
The Dollar eked out moderate gains through the past week if you used the DXY Dollar Index as your benchmark. That puts much of the responsibility behind this lift on the EURUSD which is the heaviest weighting in the index. Elsewhere, noteworthy – but still restrained – gains were made for the Dollar through GBPUSD and USDJPY. These account for the three most liquid majors in the Forex market accounting alone for more than half of all currency-to-currency transactions around the world. Naturally, their influence would readily offset the Greenback's losses against the likes of the Australian, New Zealand and Canadian Dollars. All told, however, the Dollar did not materially alter its bearings through the past week. It still falls comfortably within the rising trend channel stretching back over the past nine months. A bullish breakout will still require a move back to 97.75 (we end the week just below 97) and a true shift into a bear trend would come on a break of the same pattern's floor and the 200-day moving average around 95.50. Anything in between those bounds could qualify as a path-of-least-resistance range swing.
Chart of DXY Dollar Index with 50-Day and 200-Day Moving Average (Daily)
Adding perspective to the default range setting we registered in the past week's price action and the technical restrictions of the past months, the remarkable drop in priced-based activity has dropped to extreme levels. The 20-day (equivalent of one trading month) Average True Range, or ATR, for the DXY continues to hover around levels comparable to the 2017/2018 holiday season – and before that, there is no comparison until we stretch back to summer of 2014. While restricted volatility is to be expected given the range conditions we have experienced, this reading is extreme. And, extreme readings rarely last. Either market conditions are universally going to cool to levels commensurate with the complacency experienced in previous years of unchecked speculative reach, or the Dollar is going to see a charge in the near future. While breakouts are more likely to occur when activity levels are picking up, such an outcome is not a foregone conclusion.
Looking for a fundamental perspective on USD? Check out the Weekly USD Fundamental Forecast.
Chart of DXY Dollar Index with 20-Day Average True Range (Daily)
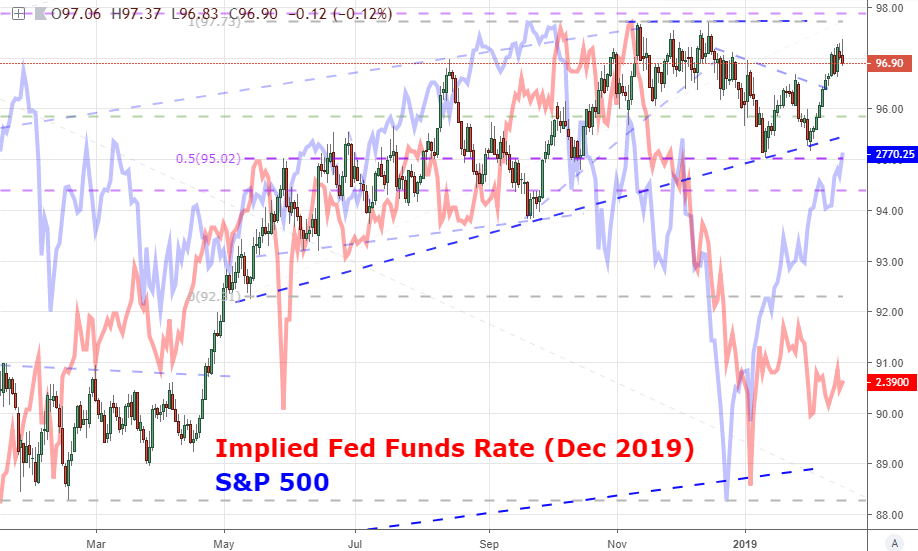
If we are looking for the motivations that could reasonably leverage volatility and sustain it – whether to the ends of a critical breakout/down or simply violent range swings – the movement will likely start with more critical fundamental themes. Keeping tabs on these motivations doesn't require a deep understanding of the economic calendar and abstract themes that are struggling for conviction (though if you want to learn how to trade news, you can read our guide on it). There are two general correlations that I am watching closely for guidance on the Dollar. In some ways, they are related. The implied yield forecast for Fed Funds futures is a measure of the outlook for 'income' return for the currency and thereby its appeal as a carry currency. Therefore, when risk appetite rises – as we would register from the S&P 500 as a reasonable baseline – the Dollar's appeal would be magnified. That said, as interest rate expectations struggle, the S&P 500's rally will have less pull for the Dollar. Yet, if equities were to drop, the disconnect would do little to dampen the negative impact on the currency itself. That puts greater fundamental influence – and volatility – behind bearish perspective.
Looking for a Fundemental perspective on the US Dollar? Check out the Weekly USD Fundemental Forecast. Chart DXY Dollar Index Overlaid with Fed Funds Implied Rate and S&P 500 (Daily)
One alternative, big-picture fundamental driver that could cater to the Dollar's further gains in a scalable way is the sustained broad decline in major USD counterparts. Should the Euro, Pound and Yen extend exceptional losses, the markets will generally move towards deeper liquidity. In that scenario, there is only one major counterpart that would fulfill the market's needs: the Dollar. What motivates a universal loss in currencies, which can be hidden in relative exchange rates? A dovish turn in global monetary policy, a ballooning debt/deficit amongst global leaders, even speculative leverage itself. If you want to keep tabs on this influence, there is a good barometer in the value of gold. The metal has proven itself a preferred alternative-to-traditional-fiat in previous years and cycles, and that role has not changed. Gold is usually priced in Dollars which can offer some skew, but the equally-weighted pricing of the commodity in Dollar, Euro, Pound and Yen below doesn't alter its course much.
Chart of Equally-Weighted Gold Index and 50-Day Moving Average (Daily)

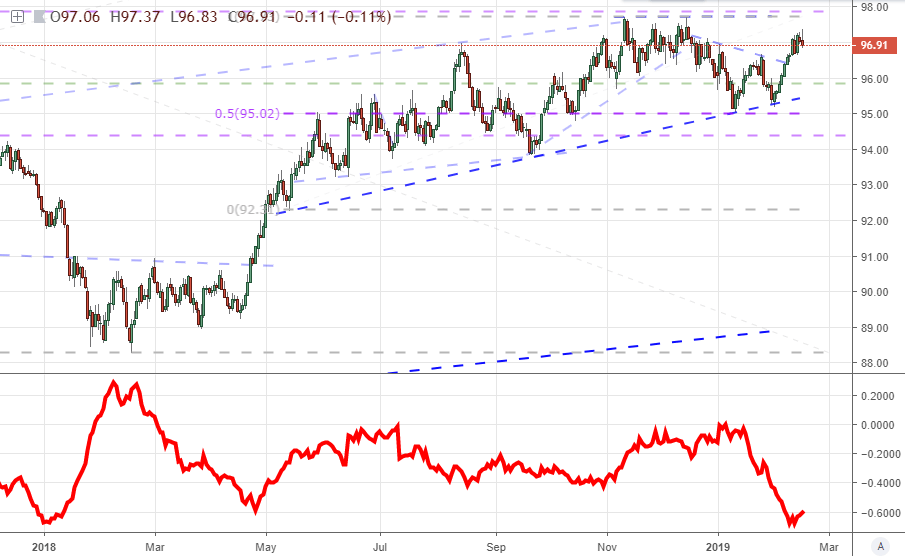
As for the look at positioning behind the Dollar, there is a conflict between the short-term and medium-term intentions – not unsurprising given the months of channel we have carved out. From the futures-based COT report from the CFTC, the (still by four weeks) delayed reading has shown the heavy net long interest built up through 2018 is finally starting to deflate. That said, the shorter-term picture from retail FX positioning via IG clients shows a strong net long EURUSD (short Dollar) view that suits the range established just over the past few months. When range conditions prevail, the speculative view from the retail crowd tends to be more timely while a shift to genuine break and trend is where the slower-to-align futures positioning is often more aligned.
Chart of Net Speculative Positioning in Dollar Futures Positions from CFTC Report (Weekly)
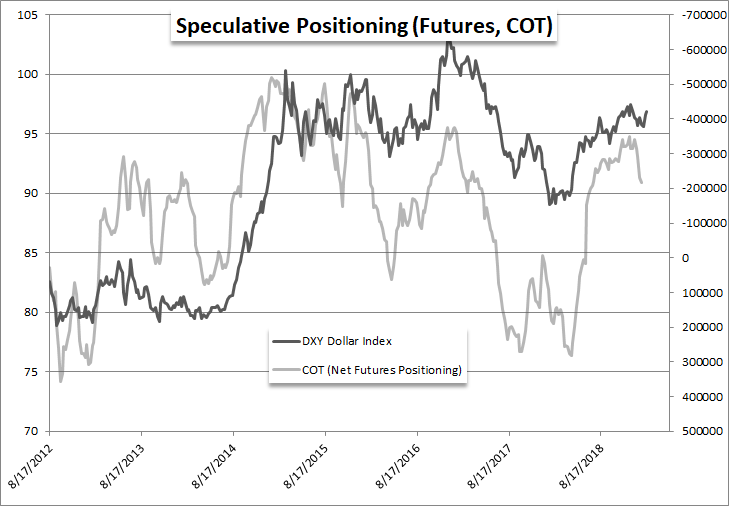
Chart of Retail Trader Positioning from IG Clients (Daily)
Other Weekly Technical Forecasts :
Australian Dollar Forecast – AUD/USD Eyes Resistance, AUD/NZD Resumes Fall, GBP/AUD May BounceOil Forecast – The 2019 Crude Bull Market Has Arrived
British Pound Forecast – GBPUSD & EURGBP
US DOLLARFUNDAMENTAL FORECAST: NEUTRAL
- US Dollar unable to hold up after touching six-week high
- Fundamental driver inconsistency leaves outlook clouded
- Risk trend conviction needed, January FOMC minutes due
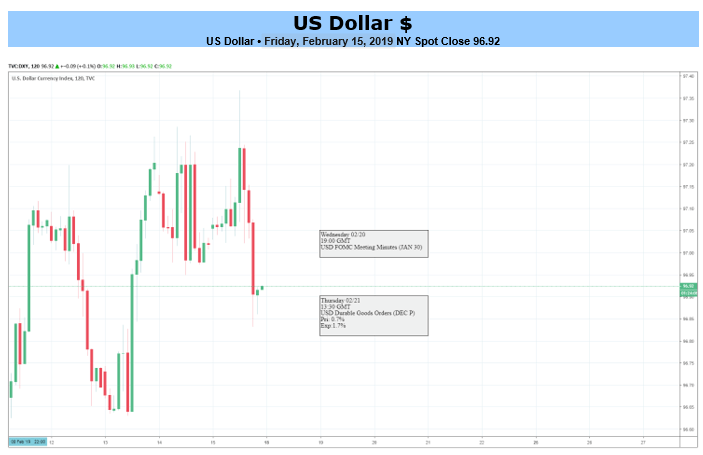
The US Dollar attempted to extend higher last week, touching a six-week high against an average of its major currency counterparts. The move would not prove lasting however, with prices erasing gains to finish Friday's session in essentially the same place as Monday's trade began.
Seesawing performance seems to reflect fundamental cross-currents competing for influence over the Greenback. It can find an appeal in a superior yield profile in risk-on trade or leverage its unrivaled liquidity to attract haven demand when the pendulum swings to a risk-off setting.
Sentiment trends need to remain at least somewhat consistent for either dynamic to build discernible traction. When that is not the case – and last week was a case in point for inconsistency – a clear-cut narrative with follow-on potential is difficult to divine.
The domestic front is unlikely to offer clarity in the week ahead. Minutes from January's FOMC meeting amount to the only bit of top-tier event risk, and they seem unlikely to offer much beyond the "wait-and-see" narrative that Fed officials have presented in a steady stream of recent commentary.
That means a decisive break is likely to need commitment from risk appetite. With mixed reviews of progress in US-China trade talks and reinforcement of global slowdown fears in recent data flow, the path of least resistance probably leans in favor of de-risking. If it can be sustained, USD might find fuel for gains.
Looking for a technical perspective on USD? Check out the Weekly USD Technical Forecast.--- Written by Ilya Spivak, Sr. Currency Strategist for DailyFX.com
US DOLLAR TRADING RESOURCES
OTHER FUNDAMENTAL FORECASTS:
Australian Dollar Forecast –May Head Lower If RBA Jawboning Starts AnewBritish Pound Forecast – Sterling Struggles as the Brexit Clock Ticks
Gold Forecast – Gold Bull-Flag Formation Continues to Unfold Ahead of FOMC Minutes
Source link

Chart Prepared by Jamie Saettele, CMT
DailyFX Trading Guides and Forecasts
-The last update remarked that "low thus far is 47.07 so if crude isn't going to spill then it needs to turn up now. A close back above the 200 day average would be a positive sign (a la what happened in August and November)." Crude closed above the 200 day average on Wednesday. Given the dynamic, I'm positive on crude.
Source link
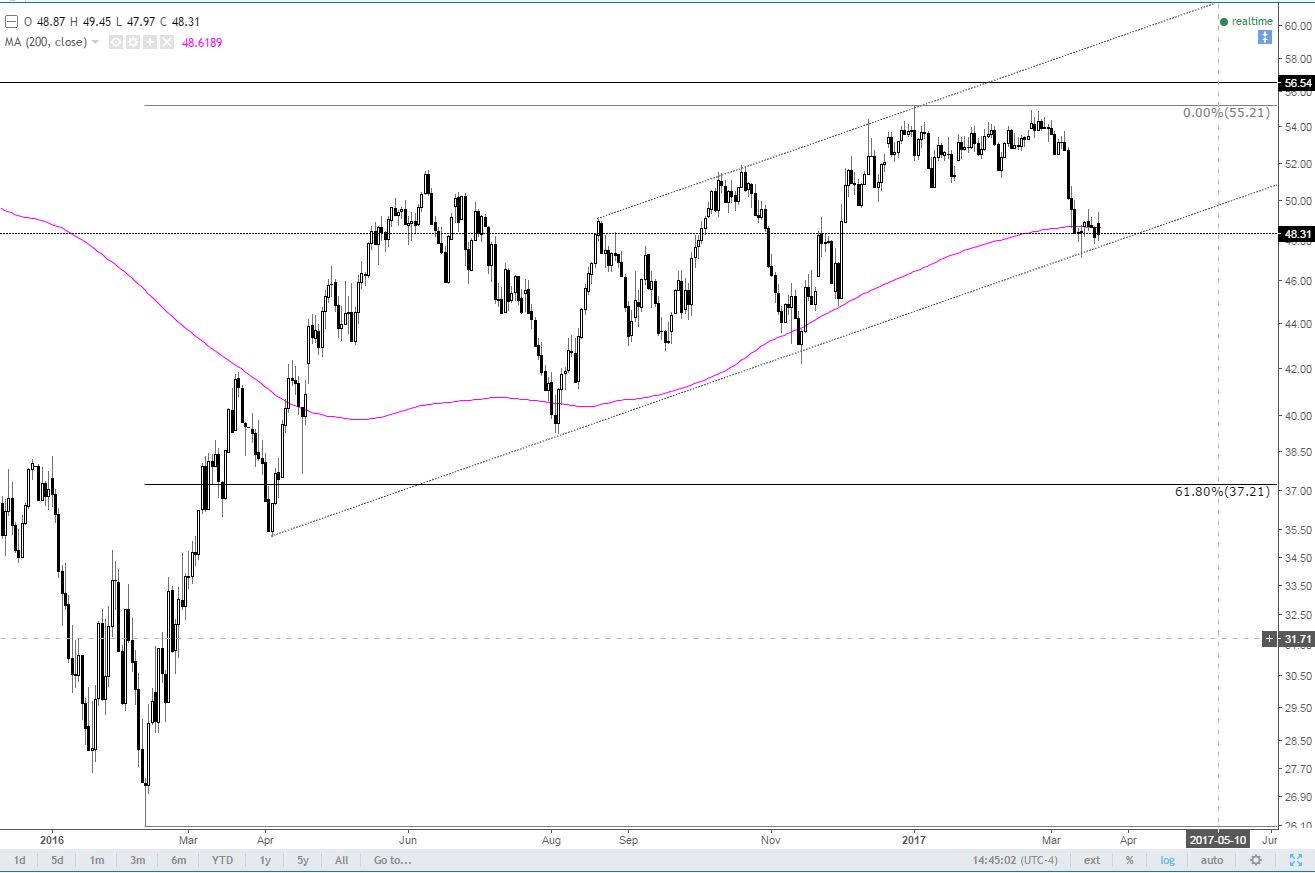
Chart Prepared by Jamie Saettele, CMT
DailyFX Trading Guides and Forecasts
-"Low thus far is 47.07 so if crude isn't going to spill then it needs to turn up now. A close back above the 200 day average would be a positive sign (a la what happened in August and November)." Crude continues to trade around the trendline and 200 day average. I'm positive on crude as long as the trendline holds. Failure to do opens up 42 (March 2015 and November 2016 lows).
Source link
Daily
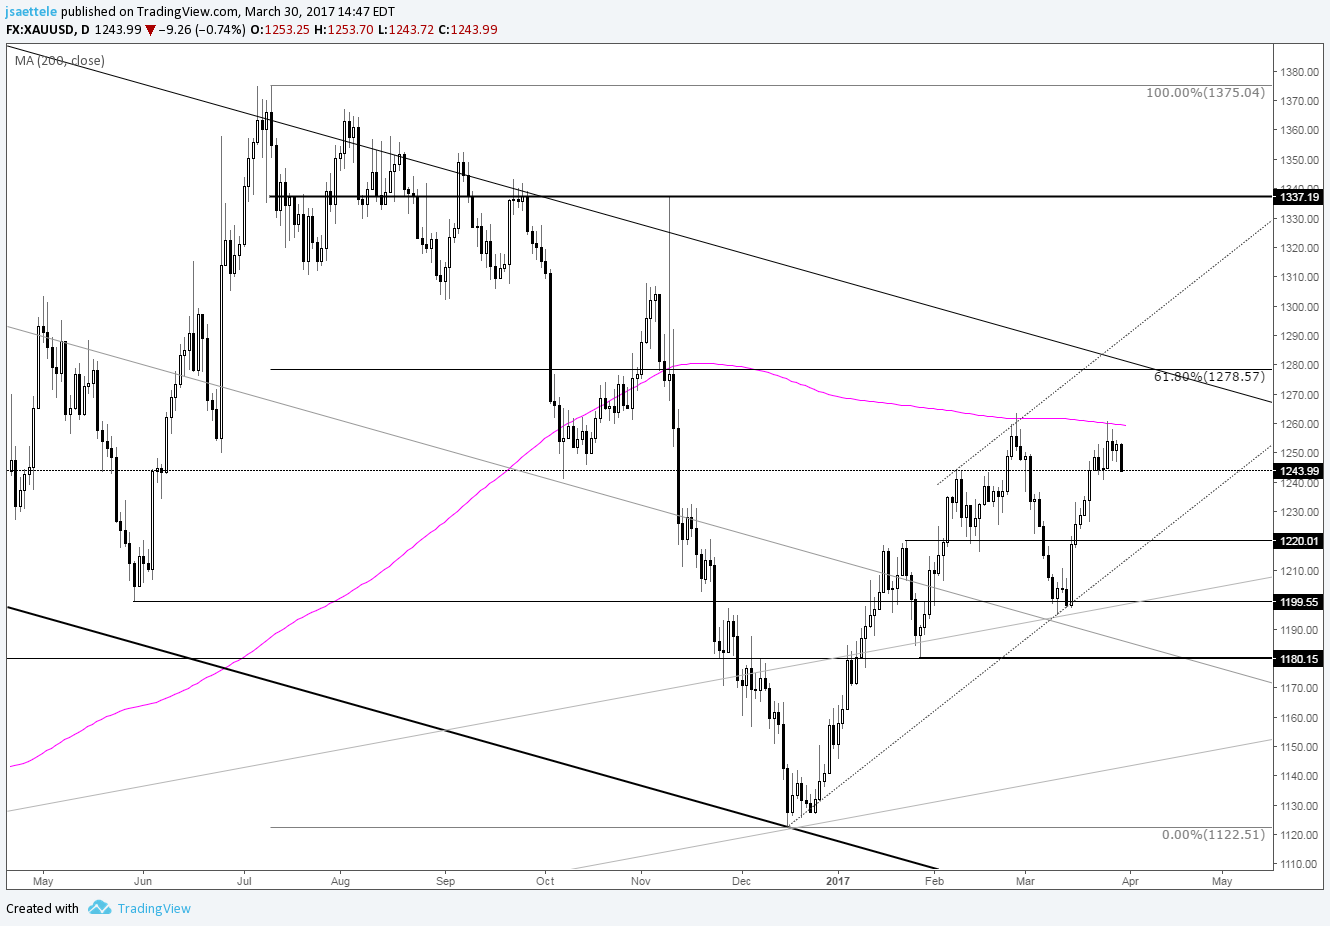
Chart Prepared by Jamie Saettele, CMT
DailyFX Trading Guides and Forecasts
Real Time Positioning
-Gold is finally starting to come off. The metal has been at resistance (1250) for 7 days. Watch 1219 for support. The 200 day average is clearly important here and a push through the average would indicate promise. Short term focus would shift to 1278 (61.8% retracement from 2016 decline).
Chart Prepared by Jamie Saettele, CMT
DailyFX Trading Guides and Forecasts
-"Low thus far is 47.07 so if crude isn't going to spill then it needs to turn up now. A close back above the 200 day average would be a positive sign (a la what happened in August and November)." Crude continues to trade around the trendline and 200 day average. I'm positive on crude as long as the trendline holds. Failure to do opens up 42 (March 2015 and November 2016 lows).
Source link
Daily

Chart Prepared by Jamie Saettele, CMT
DailyFX Trading Guides and Forecasts
Real Time Positioning
-Gold has been at resistance (1250) for most of the last 3 weeks. The 200 day average is clearly important (tested and failed 3 times so far in 2017) but a push through the average would shift focus to 1278 (61.8% retracement from 2016 decline). If gold comes off now, then 1220 (resistance in January and support in February) should be watched for support.
Sterling (GBP) Talking Points: Deal or No Deal
- February 27 may decide Deal or No Deal within the House of Commons.
- Mixed official data but Retail Sales firm unexpectedly.
The DailyFX Q1 GBP Forecasts are available to download including our short- and medium-term look at Sterling.
Fundamental Forecast for GBP: Neutral
Brexit and the British Pound: Why the EU Might Spurn a Last-Minute Deal with the UK.
The British Pound has struggled throughout the week and will close in negative territory but moves lower remain muted as sentiment continues to suggest either a soft deal or an extension of the Brexit date (March 29). MPs voted down a series of non-binding amendments on Thursday leaving PM until February 27 to get concessions from the EU and support from the House. If this does not happen, it is possible that Parliament will take over the process and try and formulate a plan that can command a majority vote. While hardline Eurosceptics still want the No Deal option left on the negotiating table, it is looking more likely that this will be dropped by a majority of MPs and if they can produce a viable plan, the EU may well shift its stance moderately to ease the process through. If the EU feel that a plan is workable, and both sides need more time to finalize it, then the withdrawal date will be extended to help seal the deal.
UK data this week was mixed with growth slipping lower, as expected, inflation coming in below market expectations, manufacturing and industrial production falling, while retail sales figures surprised to the upside.
GBP Shrugs off Weaker UK Inflation as Prospect of No Deal Brexit Recedes
Next week, the ONS will release the latest jobs and wages data on Tuesday, followed by January's public finance numbers on Wednesday.
DailyFX Economic Calendar
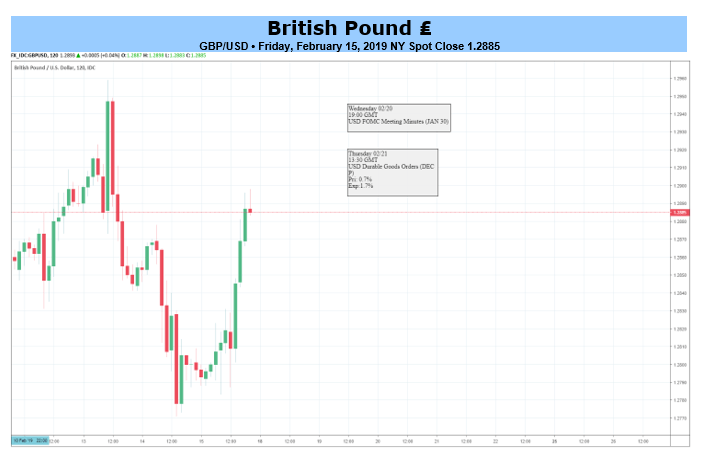
GBPUSD has lost around one cent on the week, due in part to a strong US dollar, and is trading either side of 1.2800 as we end the week. If markets believe that No Deal is still a medium-strong possibility, it is likely that cable would be trading much lower. Either way, the next couple of weeks should start to bring some clarity, albeit clouded by a lot of noise and headlines.
GBPUSD Daily Price Chart (June 2018 – February 15, 2019)

IG Client Sentiment data show 70.2% of traders are net-long GBPUSD. We typically take a contrarian view to crowd sentiment, and the fact traders are net-long suggest that GBPUSD prices may continue to fall. However, if we factor in recent daily and weekly positional changes, we get astronger contrarian bearish trading bias.
Traders may be interested in two of our trading guides, especially in times of volatility – Traits of Successful Traders and Top Trading Lessons – while technical analysts are likely to be interested in our latest Elliott Wave Guide.
--- Written by Nick Cawley, Analyst
To contact Nick, email him at nicholas.cawley@ig.com
Follow Nick on Twitter @nickcawley1
Other Weekly Fundamental Forecast:
Australian Dollar Forecast –May Head Lower If RBA Jawboning Starts AnewOil Forecast – Price Tied to Non-OPEC Supply Concerns, Lower Demand
Source link
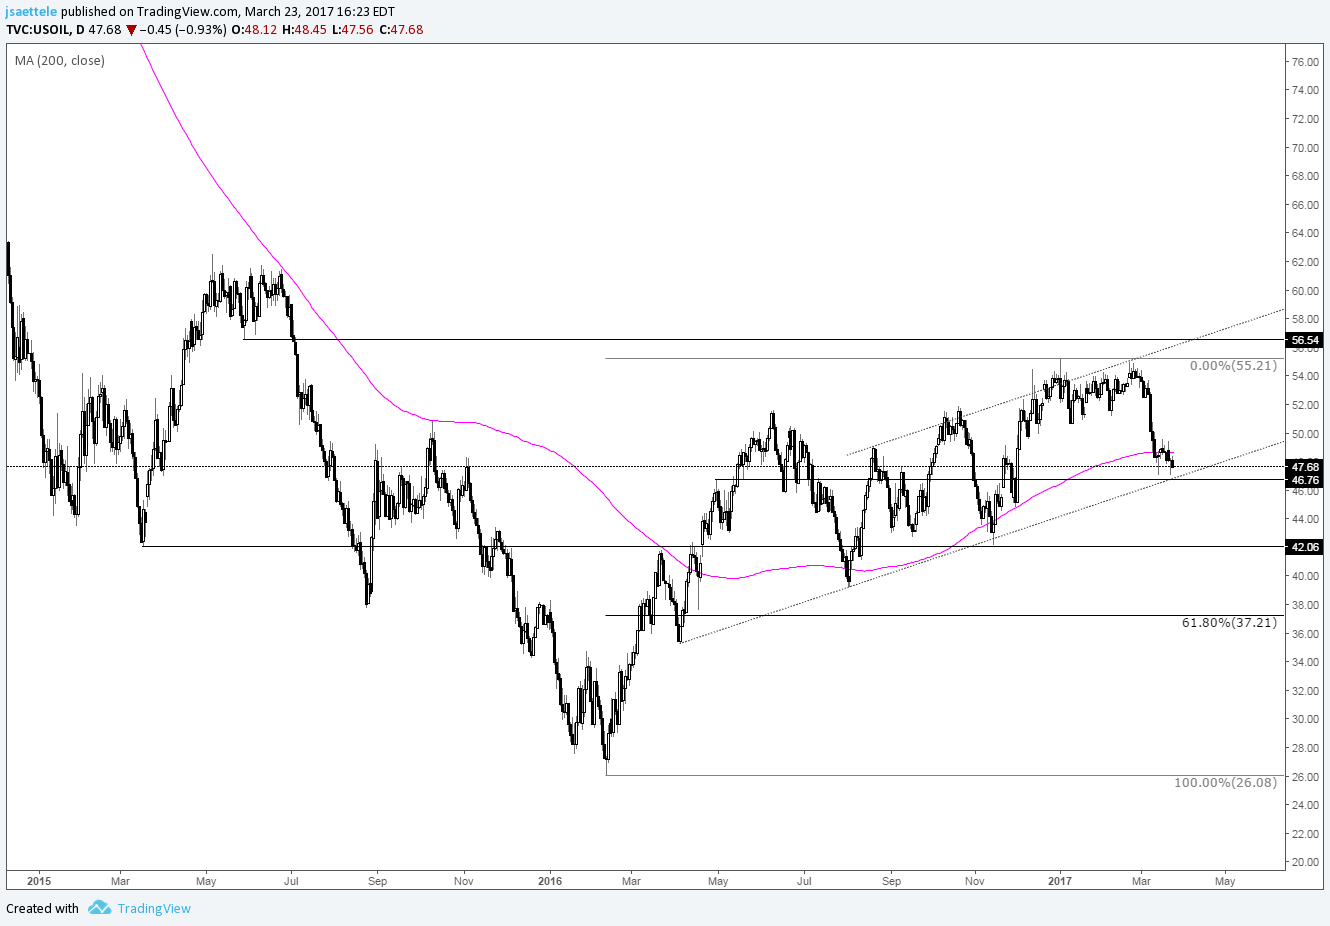
Chart Prepared by Jamie Saettele, CMT
DailyFX Trading Guides and Forecasts
-Crude continues to trade around the trendline and 200 day average. I'm positive on crude as long as the trendline holds. Failure to do opens up 42 (March 2015 and November 2016 lows) and maybe even a 37 handle at some point (61.8% retracement and August 2015 low).
Source link
Daily

Chart Prepared by Jamie Saettele, CMT
DailyFX Trading Guides and Forecasts
Real Time Positioning
-Gold has been at resistance (1250) for most of the last 3 weeks. The 200 day average is clearly important (tested and failed 4 times so far in 2017) but a push through the average would shift focus to 1278 (61.8% retracement from 2016 decline). If gold comes off now, then 1220 (resistance in January and support in February) should be watched for support.
To see what fundamentals may drive the next move in EUR/USD, check out the DailyFX Q1 Euro Forecast.
Not long ago I discussed Euro volatility and how not only volatility was low and set to climb, but that volatility of volatility was also low and ready to rise. This analysis implied that the latter (vol of vol) would change and that the level of volatility itself would rise with it.
That discussion was a month ago and vol of vol did indeed rise a bit, but actual volatility fell instead of rose. Disappointing but not altogether surprising. Macro situations can take longer to develop than initially expected, and of course longer than we would like to have our patience tested.
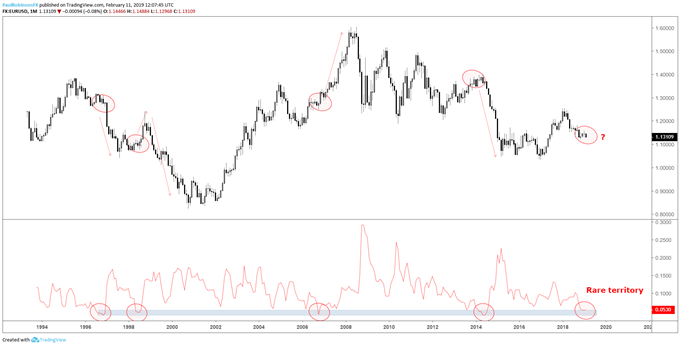
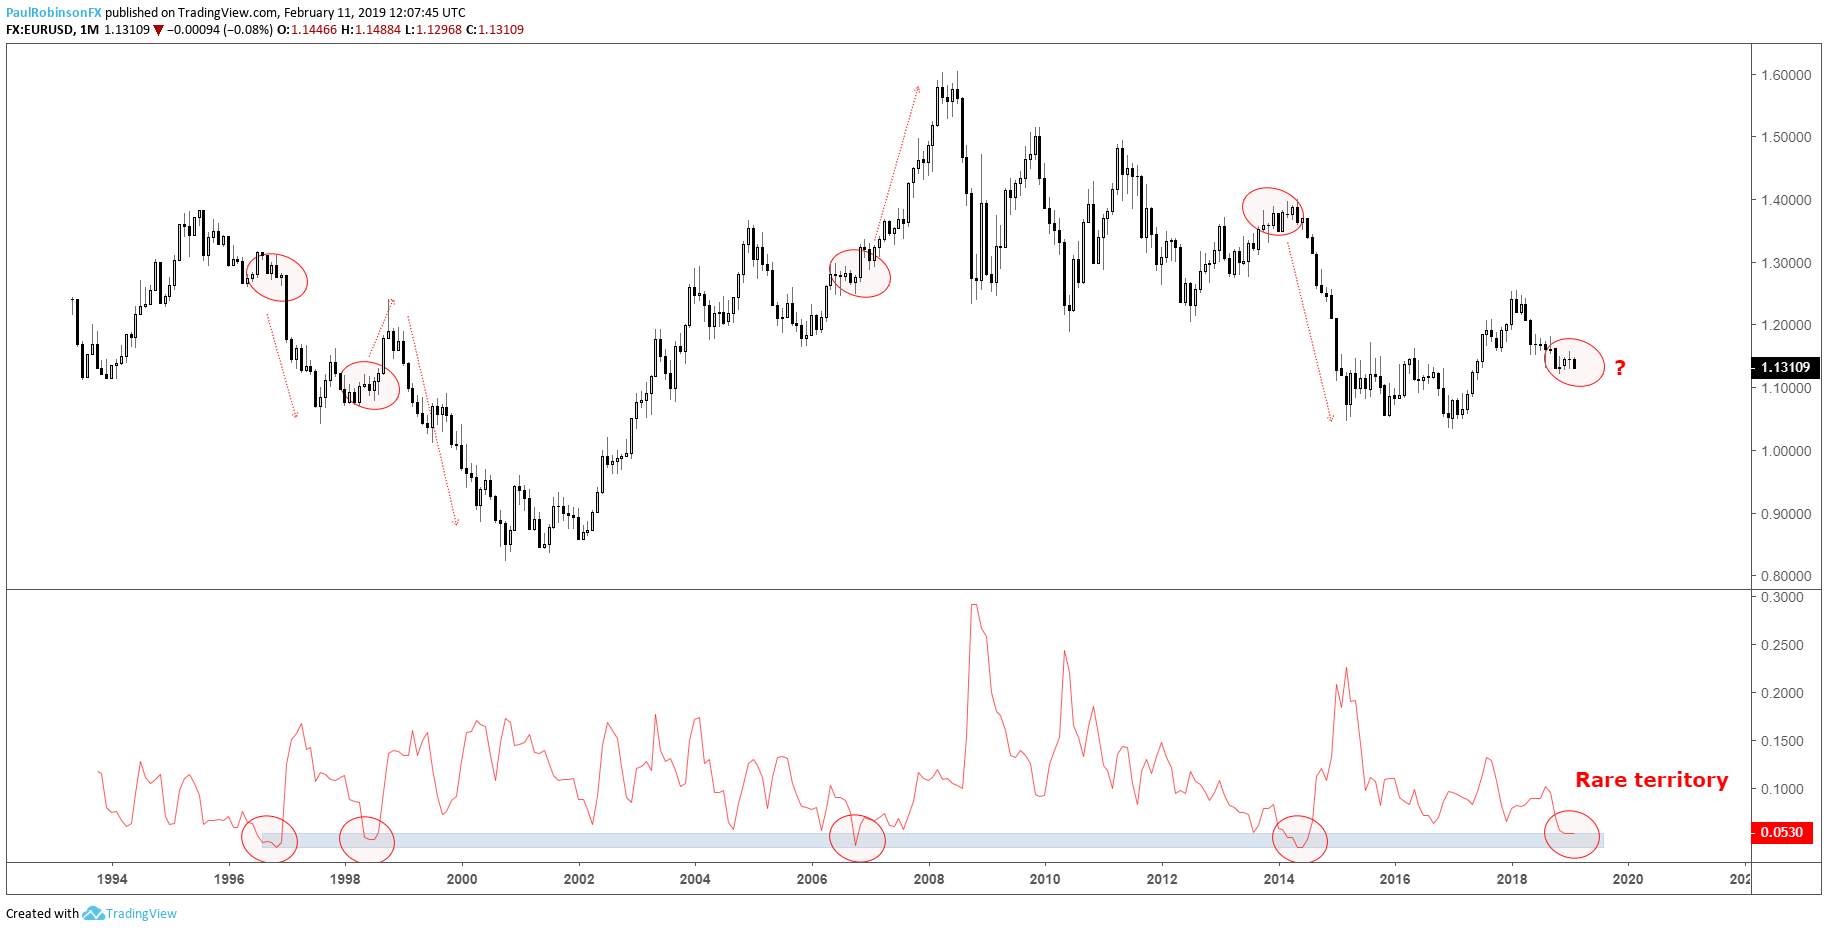
The 6-month historical range percentage of the Euro is at only about 5%, which puts it in rare territory. The last time there was this tight of a range was prior to the beginning of the 2014/15 melt-down. Prior to that it was late 2006 before the Euro rallied to record heights, and before that was a pair of instances in the 1990s (Euro price created synthetically from its current participants) where EUR/USD also embarked on large intermediate to big-picture price swings. A couple of those instances took some time before the really big volatility hit, but even an minor uptick in vol from here would be a welcomed event.
To see how other traders are positioned in the Euro and how this may forecast the next price move, check out the IG Client Sentiment page.
All-in-all, while the short-term trading environment is difficult and could remain so for a while longer, better days for trend/momentum traders lies somewhere on the horizon. The prudent approach is to continue taking current trading conditions at face value and be careful not to chop yourself up, but don't be lulled asleep as a higher volatile regime nears.
***Further discussion on this topic will continue in the trading/technical outlook webinars held on Tuesdays and Fridays. If you are looking for ideas and feedback on how to improve your overall approach to trading, join me on Thursday's for the Becoming a Better Trader webinar series.
---Written by Paul Robinson, Market Analyst
You can follow Paul on Twitter at @PaulRobinsonFX
EUR/USD Volatility & Technical Highlights
- Euro multi-month trading range historically low
- Current trading environment may continue, but not forever
Euro multi-month trading range historically low
It's been a frustrating past few months for directional traders, as every time the Euro starts to pick up momentum in either direction it's stopped in its tracks and reverses. The bad news is that we may be on the cusp of yet another one of these reversal events along with more low volatility as EUR/USD sits on significant support. The good news is that at some point the pattern will be broken and the Euro will offer up a big directional move.Not long ago I discussed Euro volatility and how not only volatility was low and set to climb, but that volatility of volatility was also low and ready to rise. This analysis implied that the latter (vol of vol) would change and that the level of volatility itself would rise with it.
That discussion was a month ago and vol of vol did indeed rise a bit, but actual volatility fell instead of rose. Disappointing but not altogether surprising. Macro situations can take longer to develop than initially expected, and of course longer than we would like to have our patience tested.
The 6-month historical range percentage of the Euro is at only about 5%, which puts it in rare territory. The last time there was this tight of a range was prior to the beginning of the 2014/15 melt-down. Prior to that it was late 2006 before the Euro rallied to record heights, and before that was a pair of instances in the 1990s (Euro price created synthetically from its current participants) where EUR/USD also embarked on large intermediate to big-picture price swings. A couple of those instances took some time before the really big volatility hit, but even an minor uptick in vol from here would be a welcomed event.
To see how other traders are positioned in the Euro and how this may forecast the next price move, check out the IG Client Sentiment page.
EUR/USD Monthly Chart w/Historical 6-mo Range
All-in-all, while the short-term trading environment is difficult and could remain so for a while longer, better days for trend/momentum traders lies somewhere on the horizon. The prudent approach is to continue taking current trading conditions at face value and be careful not to chop yourself up, but don't be lulled asleep as a higher volatile regime nears.
***Further discussion on this topic will continue in the trading/technical outlook webinars held on Tuesdays and Fridays. If you are looking for ideas and feedback on how to improve your overall approach to trading, join me on Thursday's for the Becoming a Better Trader webinar series.
Resources for Forex & CFD Traders
Whether you are a new or experienced trader, we have several resources available to help you; indicator for tracking trader sentiment, quarterly trading forecasts, analytical and educational webinars held daily, trading guides to help you improve trading performance, and one specifically for those who are new to forex.---Written by Paul Robinson, Market Analyst
You can follow Paul on Twitter at @PaulRobinsonFX
Source link

Chart Prepared by Jamie Saettele, CMT
DailyFX Trading Guides and Forecasts
Real Time Positioning
-No change on crude other than adding that the long wicks on the daily candles are indicative of support. "Crude continues to trade around the trendline and 200 day average. I'm positive on crude as long as the trendline holds. Failure to do opens up 42 (March 2015 and November 2016 lows) and maybe even a 37 handle at some point (61.8% retracement and August 2015 low)."
Source link
Daily
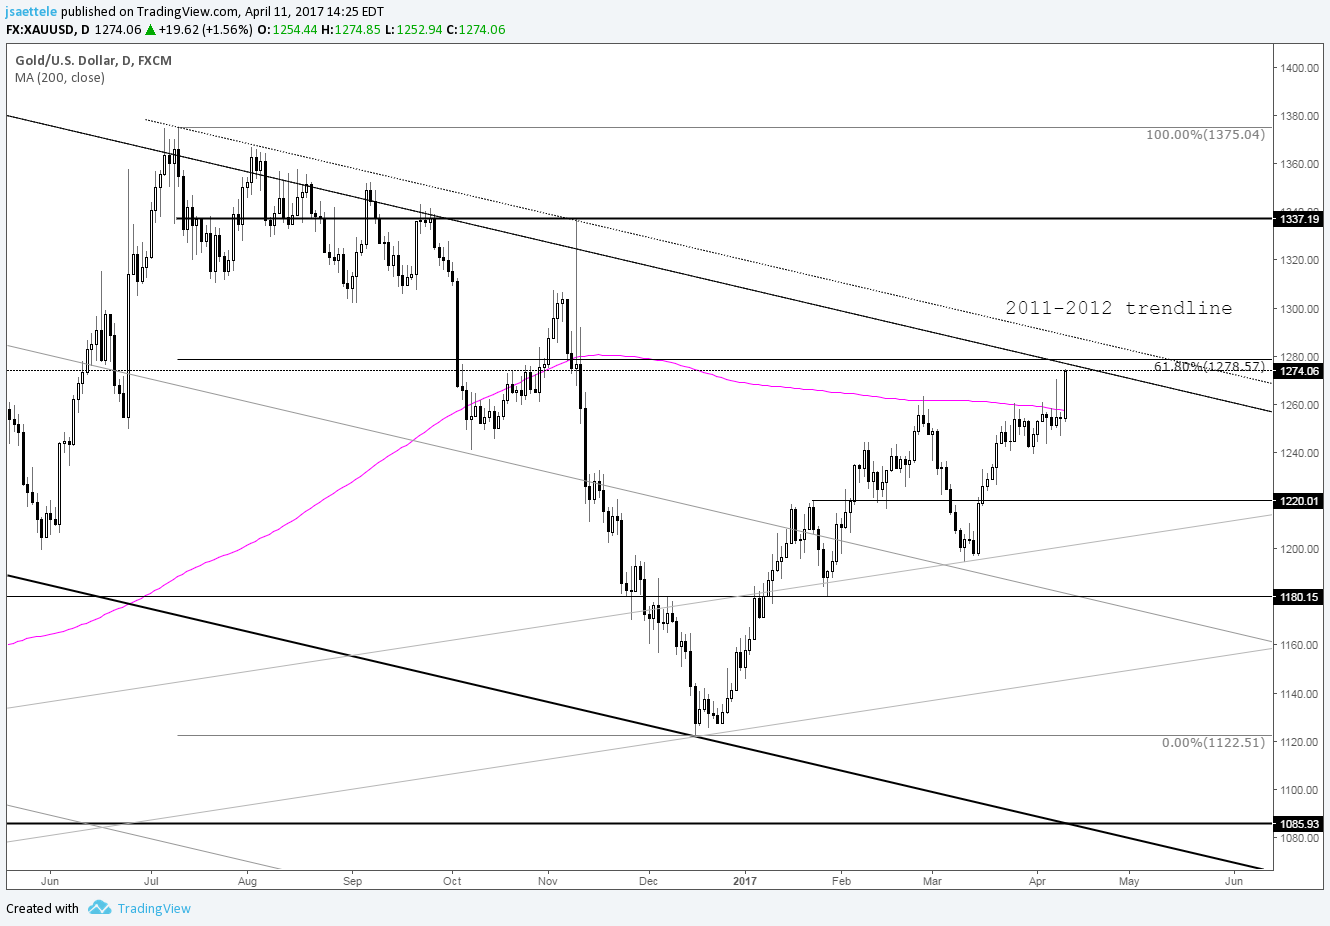
Chart Prepared by Jamie Saettele, CMT
DailyFX Trading Guides and Forecasts
Real Time Positioning
-"The 200 day average is clearly important (tested and failed 4 times so far in 2017) but a push through the average would shift focus to 1278 (61.8% retracement from 2016 decline)." Gold break through today (4/11) and is closing in on the mentioned 1278. The 2011-2012 trendline is up here too. A weekly close above the level (trendline and 1278) would be viewed as a major development.
The S&P 500 and Dow put in for tentative but high profile reversals this past week. Amid a steady decline in volatility and volume readings, the early vestiges of a turn will draw greater scrutiny.
Source link
- A government budget resolution and reports of progress in US-China trade negotiations closed this past week to strong risk appetie
- Dollar's climb has cooled before breakout velocity could be found with concerns of growth and rate forecasts dragging the currency
- Gold extends its climb to a more-than two-year high while crude oil tentatively breaks a 'neckline' around 55.50
What do the DailyFX Analysts top trades for 2019? Download our favorite opportunities, top lessons learned from 2018 and 1Q forecasts for the major currencies, indices and commodities fromthe DailyFX Trading Guides page.
Fundamental Tail Winds to Close the Week
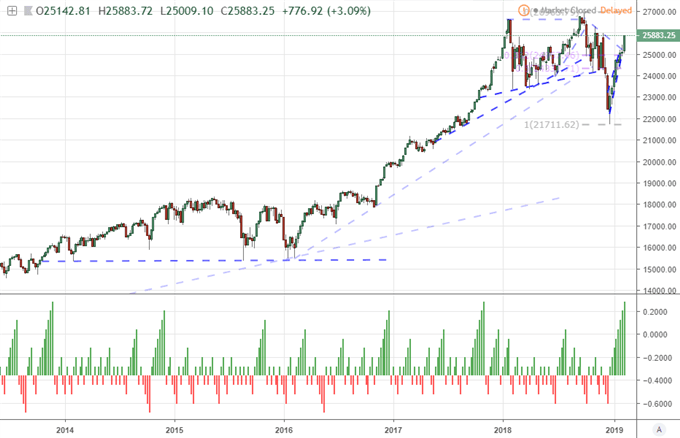
There was a strong run of speculative enthusiasm to close this past week, and it was no wonder where the motivation originated. Though it was essentially resolved a few days before the official due date, the US government's ability to avoid a return to a partial shutdown offered a clear sense of relief to traders. Even a partial closure in the government of the world's largest economy has an extraordinary impact on growth. More significant though is the erosion in confidence that regular conflicts have on expectations for more substantial hopes for programs like an infrastructure program. This is good fodder for a relief rally, but its capacity to charge bulls depends on its how much discount was priced into the markets at peak fear. Much larger in scope and complexity - and further from a definitive resolution - the US-China trade war is another front for which there was considerable, perceived progress this past week.
According to headlines, the US and Chinese negotiators were closing in on an agreement with a Xinhua report indicating the former was close to receiving everything it wants in the negotiations. President Trump suggested he was confident they could find a deal, reiterating his willingness to extend the pause on tariff hikes and suggesting he expects heavier trade between the two countries into the future. Negotiators are expected to meet again next week in the US with reports Presidents Xi and Trump will meet soon after. Given these headlines, it should come as little surprise that the S&P 500 and Dow extended their rallies back towards the records left behind in September/October. That said, it is somewhat surprising that the risk appetite wasn't more aggressive for US equities or spread more evenly across the risk-sensitive world. If this swell of optimism continues, we should expect speculative appetite make greater strides...otherwise caution is warranted.
Chart of Dow Jones Index and Consecutive Weekly Advance/Decline (Weekly)
Dollar Overdue for a Break and Euro Threatening to Do Just That
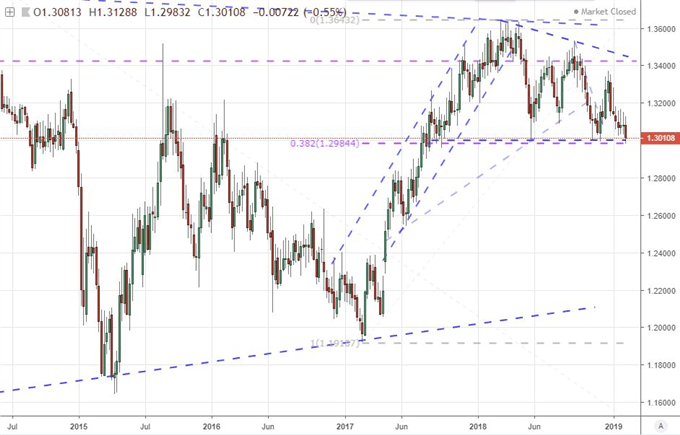
In the FX market, there is a range of high-profile fundamental themes competing for the traders' attention which in turn is preventing some majors from finding serious progress. The Yen crosses been are disconnected from day-to-day risk trends, which seems as much a disconnect from the carry trade as an issue inherent to JPY. The Pound will find most attempts to forge meaningful runs - bullish or bearish - will likely evaporate without a critical bead on the Brexit. For the US Dollar, the mix is even more complicated, which is befitting the most liquid currency in the market. Interest rate expectations have dropped sharply without dragging the currency lower. Risk trends experienced their uneven climb which didn't seem to stretch to the currency's modest carry appeal nor is it a detriment as its absolute safe haven status has not triggered even during the fourth quarter tumble in capital markets. So what could force the Dollar from its 9-month channel or EURUSD to clear 1.1200 support or 1.1500 resistance? Fed speak, some delayed data and general risk trends will test conviction this week.
As for the second most liquid currency in the market, there is a far more intense technical pressure building. A look to the equally-weighted Euro index shows it leaning heavily on support stretching back to August 2017. This past week's troubled German GDP reading, the further deterioration of political conditions and questions over the ECB's intentions after supposedly capping its easing cycle are all possible cracks in conviction. For data ahead, the ZEW investor sentiment and timelier February PMIs are going to hit a familiar chord, while the ECB's Governor Council meeting minutes may give fresh forward guidance. Another open-ended risk to be aware of is the possibility that the trade war bug spreads to the US-Eurozone relationship. With the US Commerce Department due to issue its recommendations after its review of auto imports, there may be consider risk that comes out of this update.
Equally-Weighted Euro Index (Weekly)
Gold and Oil Post Bullish Closes with Very Different Intensity
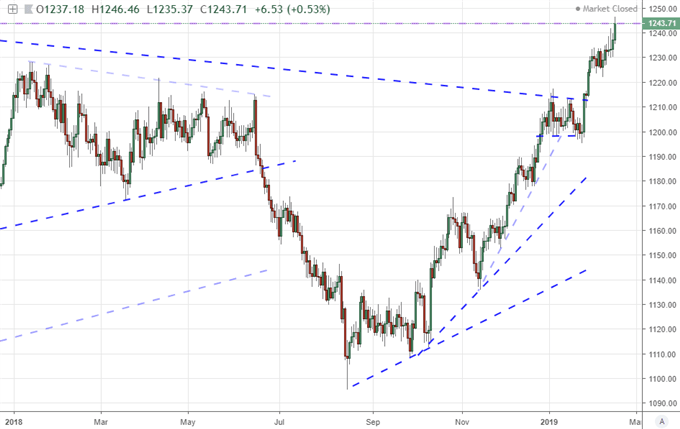
Perhaps one of the most impressive runs from the broader markets this past week comes from Gold. The precious metal earned a late-in-the-week rally Friday which would resolve a short-term wedge - though it wouldn't overtake the past month's high to extend a multi-month bull trend. What is remarkable about this move is that is developing without inflation expectations gaining, with risk assets advancing (against its safe haven appeal) and with the Dollar itself (the benchmark pricing instrument) climbing as well. When we diversify away from USD to look at an index based in Dollar, Euro, Pound and Yen, gold has hit its highest levels in over two-years through Friday's close.
Though far less productive in its own move, oil will be a focal point for many speculators to start the new trading week. Through Friday's close, the commodity closed above $55.50 which is the 38.2% Fibonacci retracement of the October to December slide and a 'neckline' in a very prominent head-and-shoulders pattern. There is more to this setup than how excited technical oil traders may be. Underlying growth and a significant connection to risk trends will prove a critical determinant to establishing follow through or collapse - not OPEC or inventory headlines. We discuss all this and more impacting the markets over the week ahead in this weekend Trading Video.
Equally-Weighted Gold Index (Daily)
Source link
The pair has a very intriguing technical backdrop that should allow for some clear-cut price levels, but a Bank of Canada rate decision may have extended the timeframe.
Source link
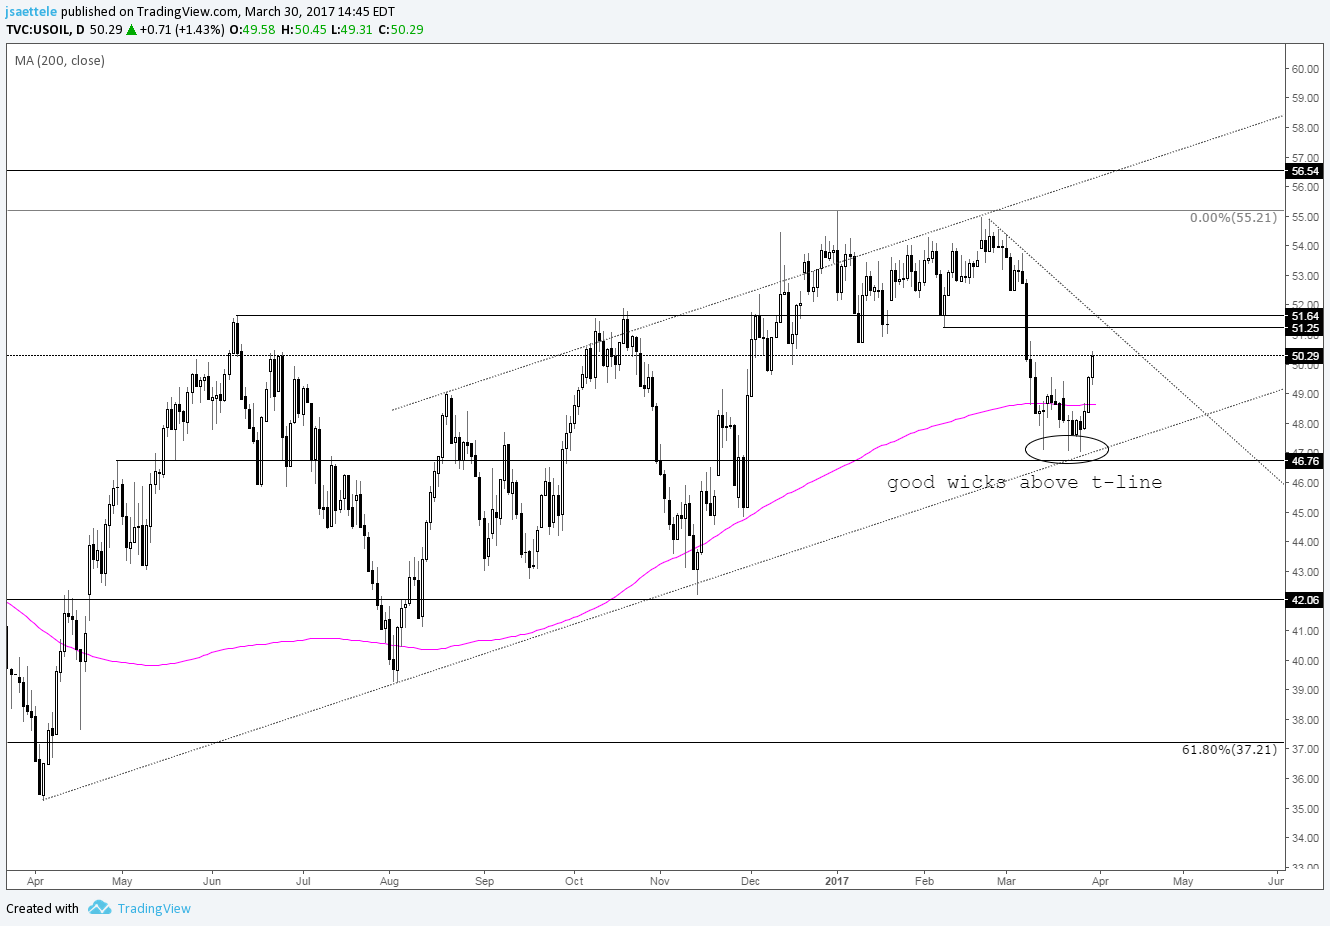
Chart Prepared by Jamie Saettele, CMT
DailyFX Trading Guides and Forecasts
Real Time Positioning
-"I'm positive on crude as long as the trendline holds. Failure to do opens up 42 (March 2015 and November 2016 lows) and maybe even a 37 handle at some point (61.8% retracement and August 2015 low)." Now that's a hold! Lows from January and February stretch from 50.69 to 51.25. The upper end of this range looks like the 'best' level for resistance (trendline intersection).
Source link

Crude OilTalking Points:
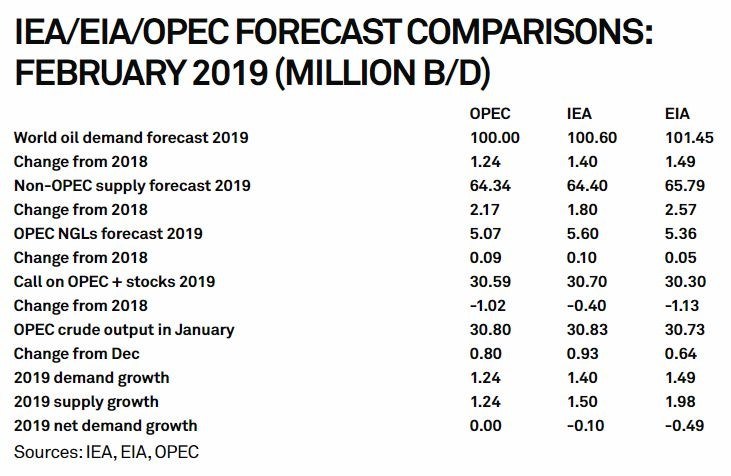
- Three top oil forecasting agencies have highlighted non-OPEC supply as a downward pressure
- Despite an OPEC cut, supply should remain considerable despite US sanctions on Iran and Venezuela
- Supply glut comes as crude demand questioned
Crude Oil Price Outlook - Fundamental
Forecast: Bearish
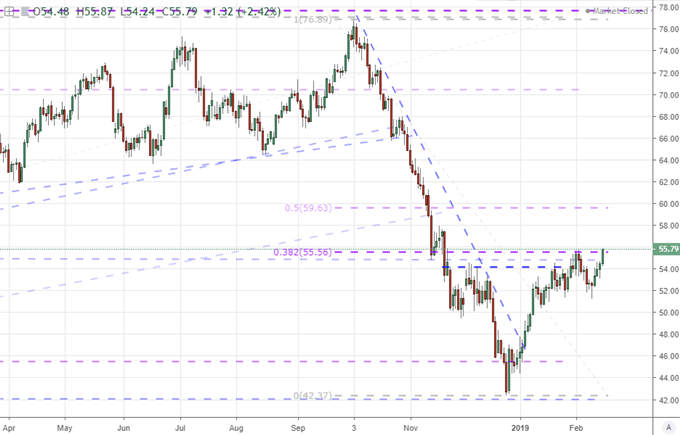
West Texas Intermediate (WTI) crude oil posted solid gains last week, climbing from roughly $52.60 to close Friday around $55.20. While the week helped the broader effort to rebound from the precipitous decline that started in October, crude has slowed its ascent considerably from earlier in the year. With that said, last week's gains were posted amid a bearish report from the IEA that warned of considerable production capacity from non-OPEC members.
Source: S&P Global
Looking for a technical perspective on Crude Oil? Check out the Weekly Crude Oil Technical Forecast.
The report echoed warnings from the EIA and OPEC, also closely watched crude forecasting agencies. With all three sounding off on a seemingly bearish development, the outlook for the week ahead will reflect as such.
Want to try your hand at trading Crude Oil? Check out our Understanding the Core Fundamentals of Oil Trading Guide.
Crude's price may see compounded pressure as the outlook for fuel demand is called into question amid global growth concerns. Both the IEA and EIA have forecasted a decrease in crude demand for 2019 while OPEC envisions no change from 2018. Barring further OPEC cuts or a surprise fundamental development, crude looks to remain pressured.
Read more: Consumer Confidence Ticks Higher, Inflation Expectations Plummet
--Written by Peter Hanks, Junior Analyst for DailyFX.com
Contact Peter on Twitter at @PeterHanksFX
DailyFX forecasts on a variety of currencies such as the US Dollar or the Yen are available from the DailyFX Trading Guides page. If you're looking to improve your trading approach, check out Traits of Successful Traders. And if you're looking for an introduction to the Forex market, check out our New to FX Guide.
Other Weekly Fundamental Forecast:
Source link
Weekly
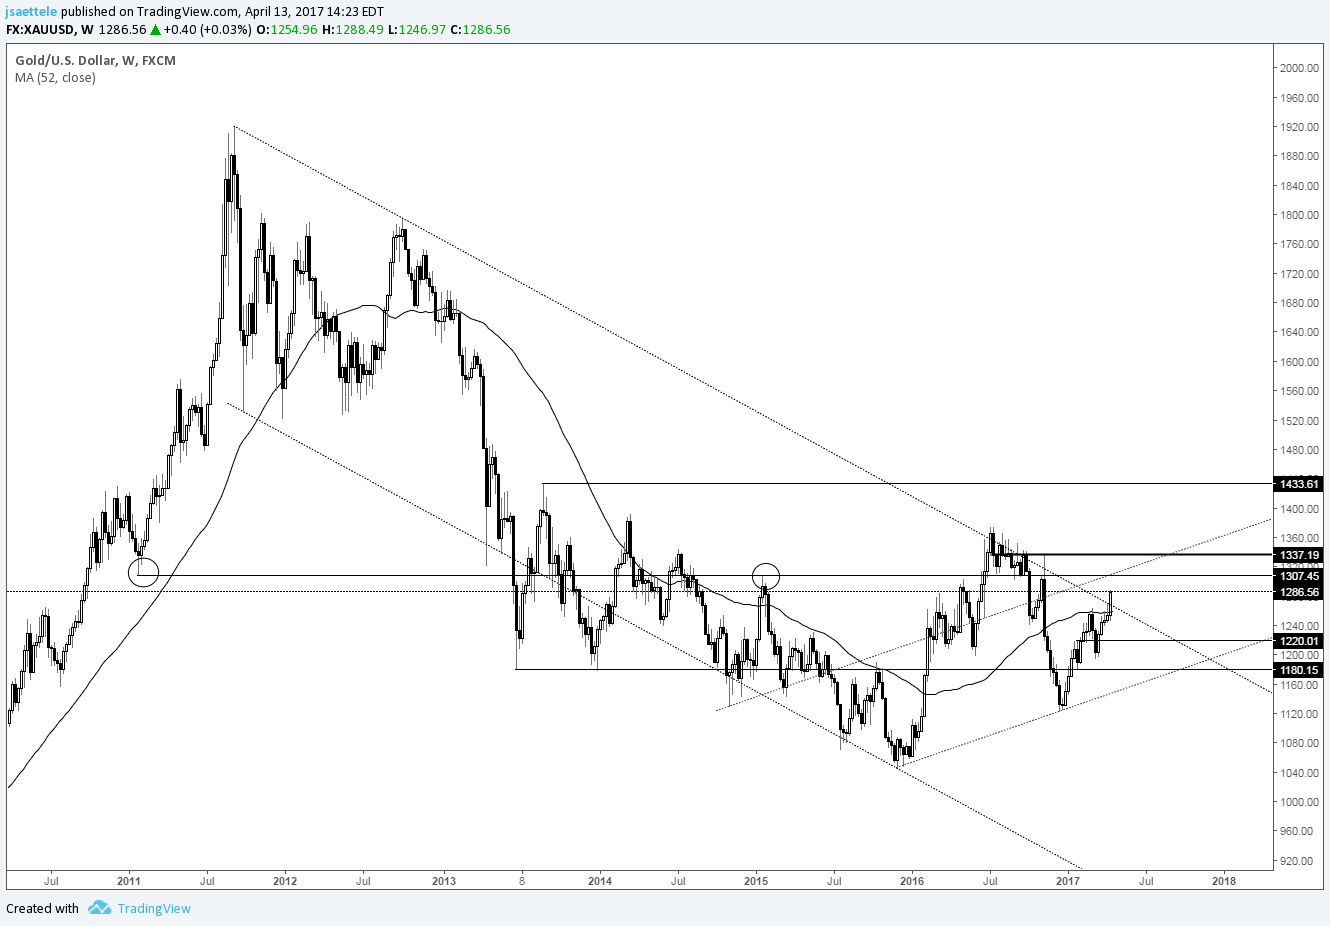
Chart Prepared by Jamie Saettele, CMT
DailyFX Trading Guides and Forecasts
Real Time Positioning
-Tomorrow's close for gold is important as a close above the 2011-2012 trendline would be the strongest indication yet of a major trend change. 1307 (big low in 2011 and high in December 2014) lines up as a level to pay attention to from a tactical standpoint.
Crude Oil Price Forecast Talking Points:
- The ONE Thing: The bullish dominos keep falling for crude oil in 2019 with demand stable despite other economic indicators tipping into the red with sanctions and production cuts the world over
- North American production continues to stymie efforts from OPEC & their allies, which has prevented crude oil from rising further and helps to explain the widening premium of Brent over WTI.
- Welcome to the rebound! Brent crude broke above the 28.2% Fibonacci retracement of the Q4 2018 range when it traded above the $64/bbl market, and the price is trading above key short-term moving averages of 5-,8-, and 13-day moving Averages. Brent has traded above the top Bollinger Band, but oil has a history of walking up the upper BB over multiple weeks over the last year.
You are in luck, DailyFX's Q1 2019 Crude Oil Forecast was just released
Technical Forecast for USOIL: Bullish

Chart Source: IG UK Price Feed. Created by Tyler Yell, CMT
History does not repeat, but it sure does rhyme, and that should be music the crude oil bull's ears. Crude's bounce has been aggressive, and one of the more exciting and quick retracements that crude oil traders have seen in a while.
Crude topped in June 2014 and would not find a bottom until January 2016 after falling 77%, and it would take a little more than 22 months before it would jump above the 38.2% retracement. Afterwards crude would go on to rally another 43% or $21/bbl before hitting the October 2018 high.
The concern for the current rally is that stockpiles were seen rising in the US per the EIA Crude Oil Inventory Report on February 12 while much of the bullish move is being driven by production cuts and geopolitical tensions. The supply cuts are coming from OPEC and their allies while the geopolitical concerns are from the depleted stockpiles of Venezuela's PDVSA.
Looking for a fundamental perspective on Crude oil? Check out the Weekly Crude Oil Fundamental Forecast.
A Look at The Price & Bollinger Band Relationship
Crude oil traders are likely placing themselves in a buy or 'wait to sell' modality. That is the beauty of technical analysis, especially in commodity markets. When markets are trending higher, as they currently are, bears don't have to fight the flow of fundamental crosswinds like sanctions and production cuts; they can wait (patiently) for a break of key support as opposed to fighting the trend.A key technical indicator you can look to for this aspect is the Bollinger Band with 2 std. deviations and a 20-period moving average. Since early 2018, the upper band has been touched three times (not including the current touch on Brent), and twice in August & March, the price has walked up the upper Bollinger band for multiple weeks in a melt-up before breaking down.
In other words, with this recent move higher with fundamental support, bears should tread carefully or hibernate till support breaks.
---Written by Tyler Yell, CMT
Tyler Yell is a Chartered Market Technician. Tyler provides Technical analysis that is powered by fundamental factors on key markets as well as trading educational resources. Read more of Tyler's Technical reports via his bio page.
Communicate with Tyler and have your shout below by posting in the comments area. Feel free to include your market views as well.
Checkout DailyFX's New Podcast: Trading Global Market's Decoded on iTunes
Talk markets on twitter @ForexYell
Other Weekly Technical Forecast:
Australian Dollar Forecast –AUD/USD Eyes Resistance, AUD/NZD Resumes Fall, GBP/AUD May BounceSource link
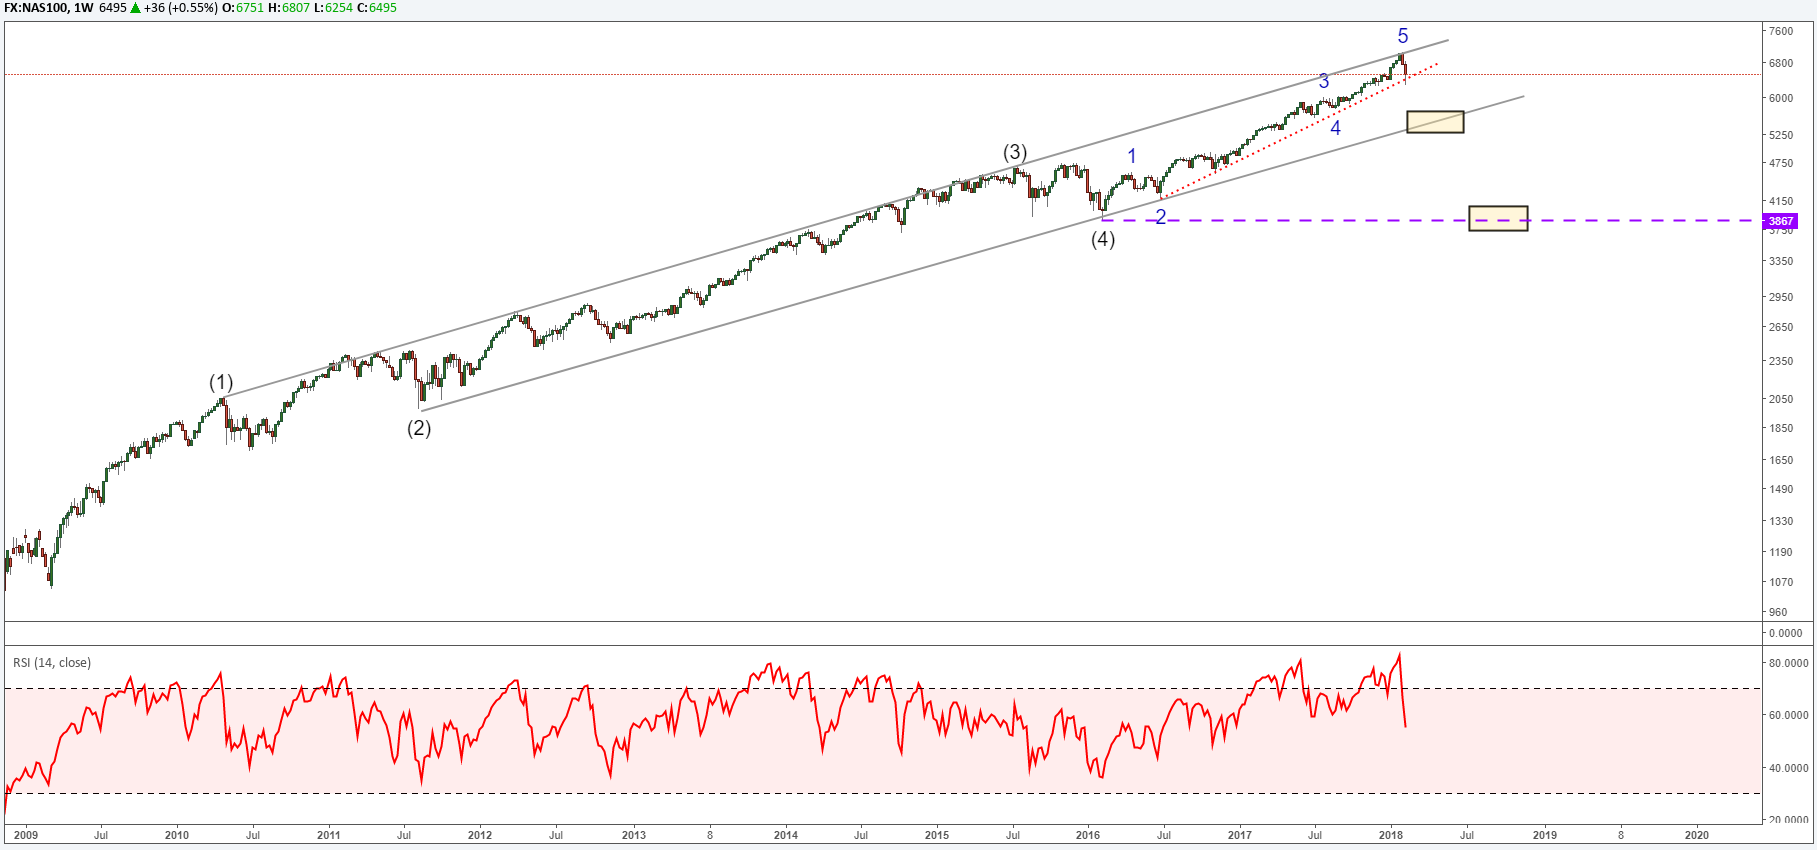
Dow Jones, Nasdaq, Dax 30 Elliott Wave Analysis Talking Points
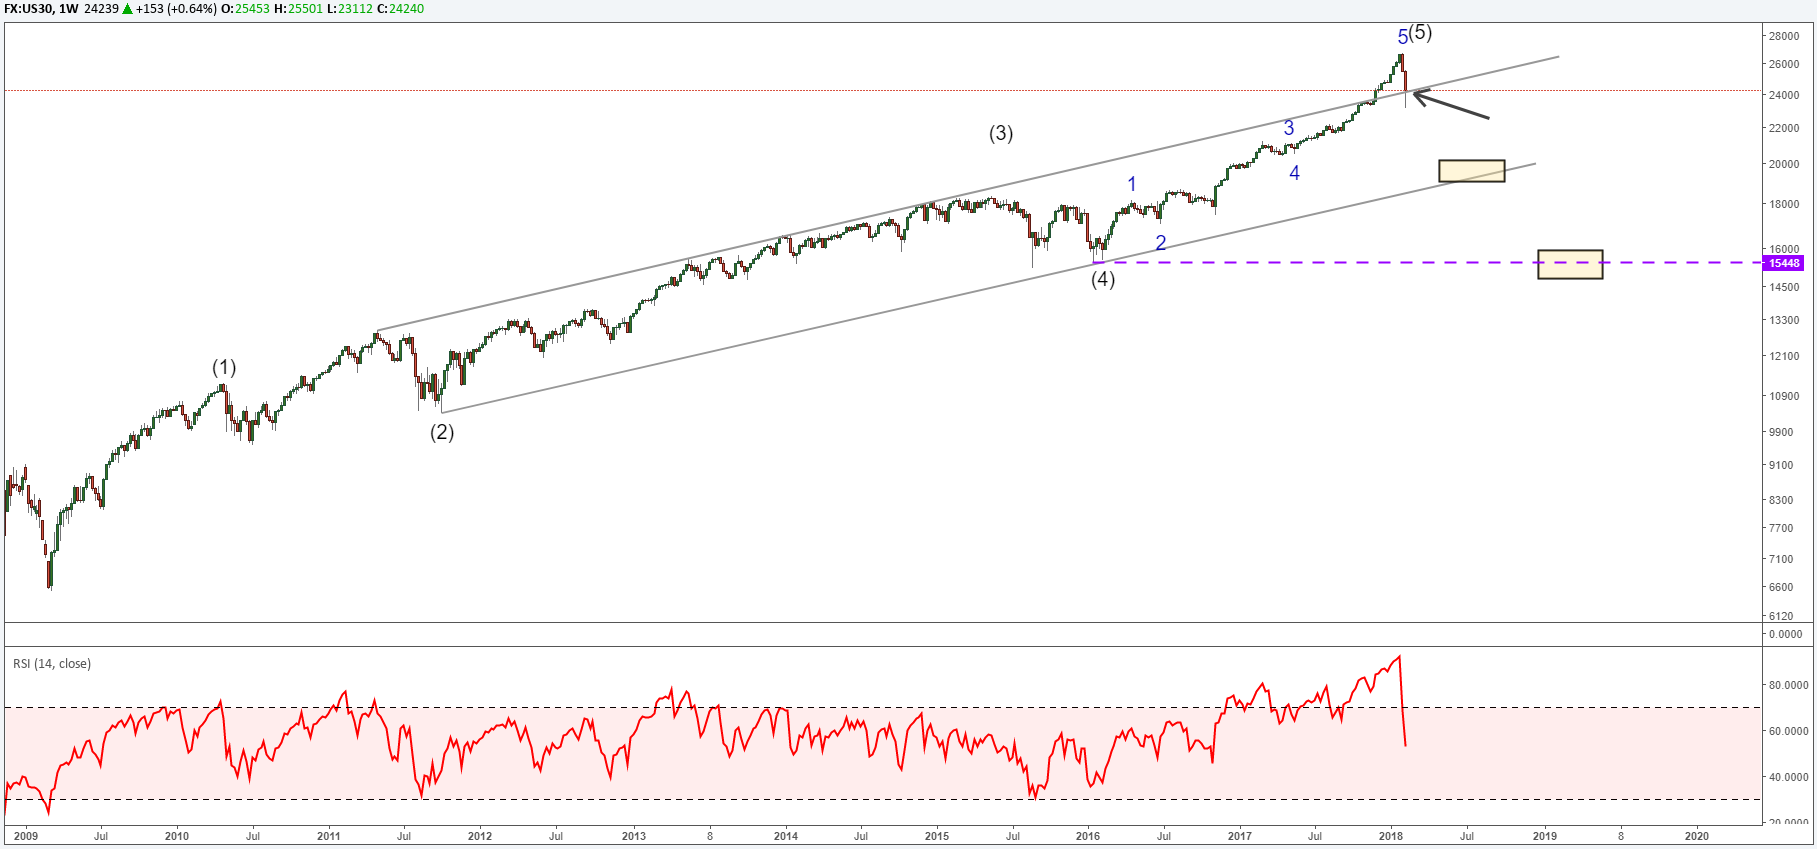
- Dow Jones Industrial Average holds above Elliott Wave channel
- Nasdaq bearish reversal at Elliott Wave channel
- Dax 30 is the weakest as it could not reach Elliott Wave channel midline
Dow Jones Industrial Average Sticks on Top of Elliott Wave Channel
Many times Elliott Wave impulses form a price channel by connecting the extremes of waves 2 and 4 and projecting it over wave 3. Dow Jones Industrial Average has rallied past the upper channel line in a blow off top. Returning inside the Elliott Wave channel can be a signal that the rally is over. Dow Jones Industrial Average is hovering near the channel line so continued weakness in the market may confirm the top is in.If DJIA is successful in returning inside the Elliott Wave channel, then the next level of support enters the picture near the lower channel boundary near 20,000. If this area fails to contain DJIA, then the next level of support is near the fourth wave extreme at 15,500.
Nasdaq Reverses at Elliott Wave Channel High and Targets 5300
As discussed above, the Elliott Wave channel can offer target zones within an impulse wave. Nasdaq has rallied since 2009 in a five-wave impulse reaching the upper channel line. There is a small internal support trend line Nasdaq is trying to pierce. If it is successful, then continued weakness is anticipated to lower channel support near 5300.
If Nasdaq cannot find support at the lower channel line, then we will look for continued weakness to the fourth wave extreme near 3900.
Dax 30 Cannot Reach Its Elliott Wave Channel Midline
Notice the difference in Dax 30 relative to Dow Jones Industrial Average or Nasdaq. Dax 30 could not rally to the grey dotted line that represents the midline of the Elliott Wave channel. This is indicative of a very weak market.The lower channel line may provide temporary support near 11,500. If Dax 30 is able to rally to new highs from this level, then we can count it simply as a wave 4 (the alternate shown on the chart). If Dax 30 breaks outside of the Elliott Wave channel below 11,500, then we will look at the fourth wave extreme near 8700 as the next level of support.
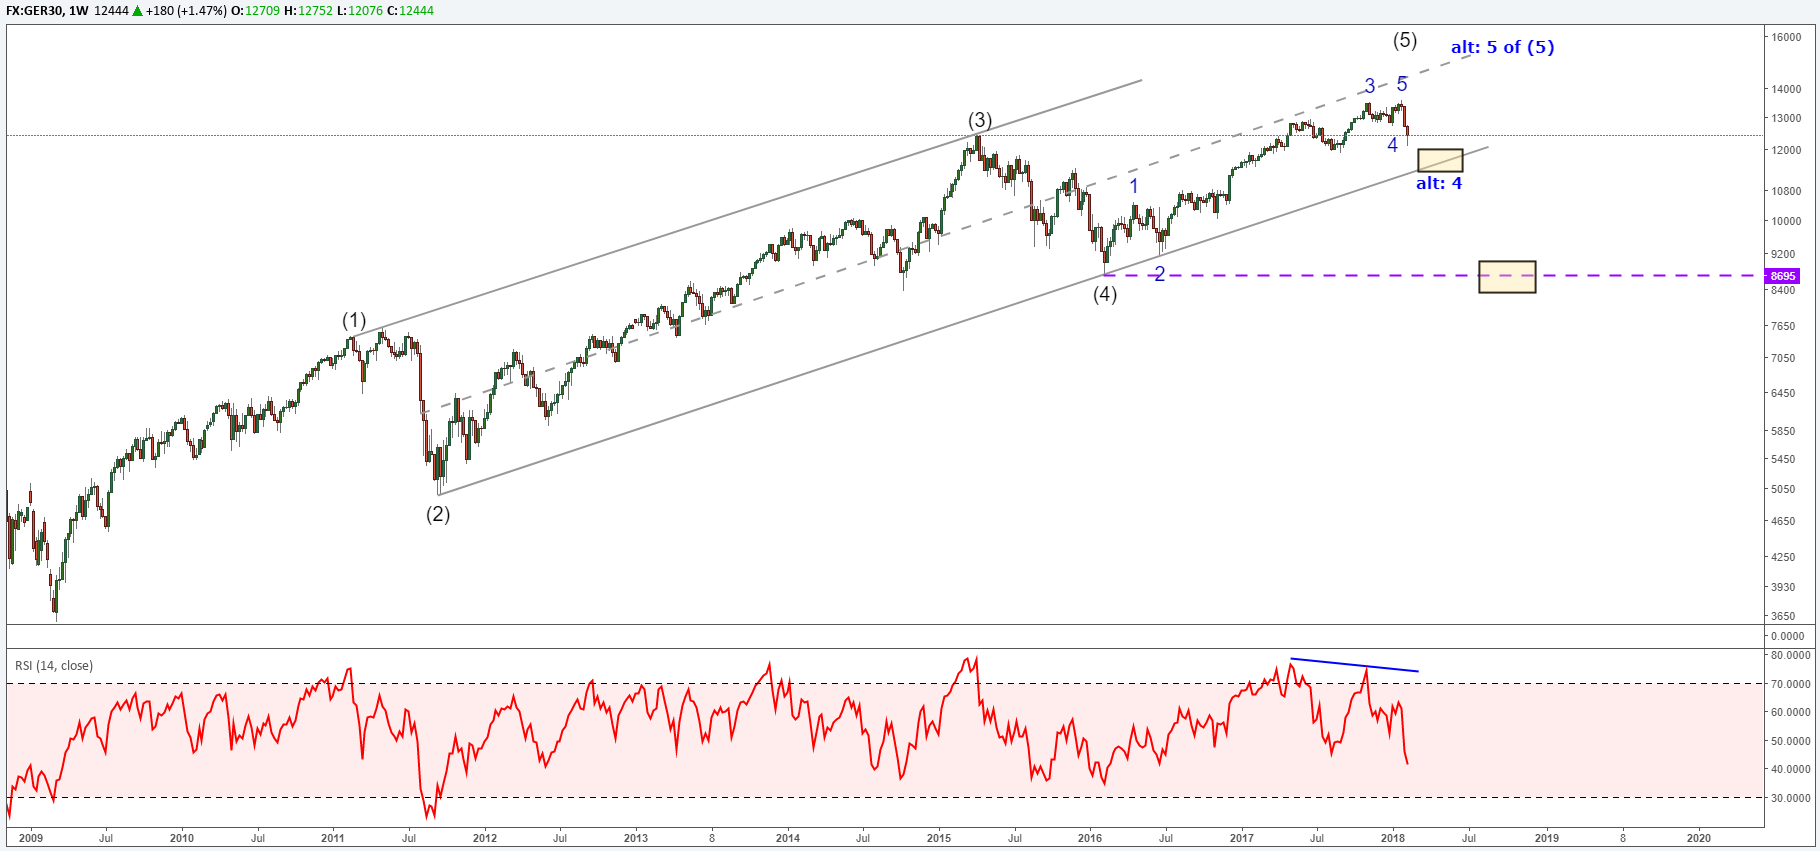
The bottom line for all three markets noted above is that absent an immediate print to new highs, this bearish sequence appears incomplete and trade make take place to lower levels in the coming weeks.
Elliott Wave FAQs
What is Elliott Wave Theory?Elliott Wave Theory is a trading study that identifies the highs and lows of price movements on charts via wave patterns. Traders often analyze the 5-wave impulse sequence and 3-wave corrective sequence to help them trade strategically. We cover these wave sequences in our beginners and advanced Elliott Wave trading guides.
I hear that many traders struggle with profitability, why?
Regardless of the style of analysis, many traders do lose money because they do not take the time to study the market and the effect of leverage. At DailyFX, we have studied millions of live trades and boiled our study down into a Traits of Successful Traders guide. You will find how leverage and human nature affects our trading so you can be better prepared for the next correction.
Elliott Wave Theory can be applied to a variety of highly liquid markets. FX is one of my favorite markets to apply the Elliott Wave principle. Learn more about trading FX with this guide specifically designed for you.
---Written by Jeremy Wagner, CEWA-M
Jeremy is a Certified Elliott Wave Analyst with a Master's designation. These articles are designed to illustrate Elliott Wave applied to the current market environment.
Communicate with Jeremy and have your shout below by posting in the comments area. Feel free to include your Elliott Wave count as well.
Discuss this market with Jeremy in Monday's US Opening Bell webinar.
Follow on twitter @JWagnerFXTrader .
Source link
- Crude oil will start the week with a traditional breakout tapping into more significant themes than just a technical groundswell
- EURUSD is a prime candidate of frustrating range, but any progress it finds will be a strong barometer on global fundamental issues
- As risk appetite seems to stretch its legs once again, focus on leverage calls attention to the explosion of government debt
See how retail traders are positioning in US Crude Oil, EURUSD, FX majors, indices, commodities and cryptocurrency on an intraday basis using theDailyFX speculative positioning data on the sentiment page.
There are a range of impressive charts shaping up across the financial system. The S&P 500 and Dow are continuing their climb back towards the record highs set in October. Gold has rallied despite the positive sentiment lean and firm Dollar. And I made my case recently for USDCHF as a large wedge that still has considerable room for the Dollar to rally should it find an unexpected charge. Yet, as impressive as these pictures are, they are not my top three charts to watch moving forward.
1 Crude Oil Sports a Head-and-Shoulders Break and Connect to Critical Themes
Perhaps one of the most technically-loaded charts among the markets I regularly keep track of comes from the benchmark US crude oil contract, WTI. It is difficult to miss the very large inverse head-and-shoulders pattern the commodity has carved out over the past few months. In such patterns, the lead in to the congestion is as important as the supposed reversal structure itself. Here, we have the incredible slide between October and December to reflect the wind up. Therefore, the break above the supposed 'neckline' that falls at the convergence of a multi-week trendline of highs and the 38.2% Fibonacci retracement of the aforementioned tumble is no small development. That said, there is a vast difference between a break and a trend. Follow through often requires more motivation than just a simple technical trigger, and therein rests the true success or failure of this move. It won't be headlines on production from OPEC or important non-OPEC members, nor US inventory updates that facilitate a trend of this scale. True risk appetite and the related conviction in global growth are the deep themes that would shrug off the restraints on this market.
Chart of US Oil (Daily)
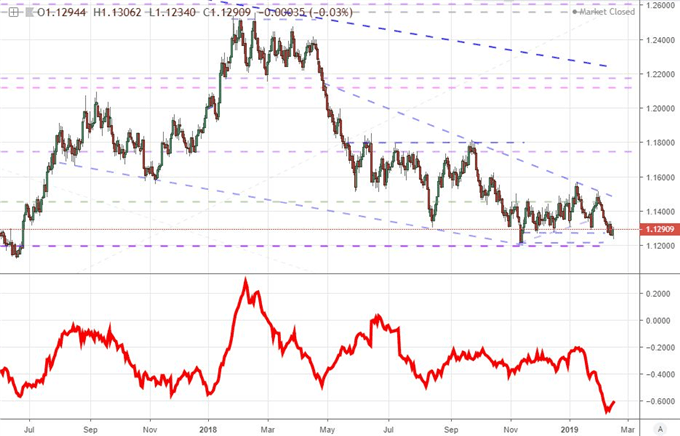
2 EURUSD's Range Signals More than Just Frustration for Trend-Starved Traders
The second chart on my list is the EURUSD's progress. Here, there is a very different perspective than what we see in crude. Whereas the commodity is on the cusp of a significant technical transition, this benchmark pair is still comfortably within its range. In fact, the 20-day ATR (Average True Range) on this pair has dropped to its lowest level since the Summer of 2014 - a period that haunts FX traders for how extreme it was. This restriction to a 1.1550 to 1.1200 span belies the laundry list of critical fundamental themes that are all converging on the pair. Relative monetary policy and rate forecasts is critical and unresolved. Risk trends are a related concern which does not find an overt return and haven currency in the pairing - despite a clear yield differential. Growth considerations, political unbalance and the risk of aggressive trade policy adoption (a trade war could be provoked between the US and Eurozone should auto tariffs be pursued) are all critically important yet lost in the deluge. This mix is so remarkable, that when it does clear; it must be developing under remarkable circumstances. In other words, if you want to know what critical fundamental theme is prevailing for the broader financial system, keep tabs on EURUSD.
Chart of EURUSD and the 20-day ATR (Daily)
3 A Swell in US Federal Debt May Prove the Next 'Monetary Policy' or 'Trade War' Theme
This is where I may lose people looking for a quick turn or charge in a specific asset, but this chart's importance is far more significant for the long-term. The US is facing an unprecedented $22 trillion debt and a deficit that is expected to charge to levels that should make us more conscious of budgets. The US is projected to run a 4.6% deficit-to-GDP ratio this year - the highest in a non-recession year on record. This spending meant to amplify growth, but it has thus far done little to boost the restricted pace of a US economy that is conforming to wavering experienced across the globe. The real issue comes should capital markets start to implode and/or the economy stalls in spite of the government's support. Then what capacity is there to fight a serious problem? The same risk exists with the state of global monetary policy. There is great capacity for this otherwise 'boring' issue to fuel an unrelenting crisis. It could become as ubiquitous a fundamental talking point among investors as trade wars, monetary policy and financial leverage have been at different times over the past two decades.
Chart of the S&P 500 and US Federal Deficit as Ratio of GDP in Red (Annually)
Source link
Long USDCAD – 1.3190
IG Client Sentiment Datashows how retail investors are positioned in a range of currencies and asset markets.
Traders may be interested in two of our trading guides – Traits of Successful Traders and Top Trading Lessons – while technical analysts are likely to be interested in our latest Elliott Wave Guide.
What is your view on USDCAD – bullish or bearish?? You can let us know via the form at the end of this piece or you can contact the author at nicholas.cawley@ig.comor via Twitter @nickcawley1.
Source link
Stop Loss – 1.3100
Target 1 (50%) – 1.3330
Target 2 (50%) – 1.3390
USDCAD Oversold and Looking for a Short-Term Bounce
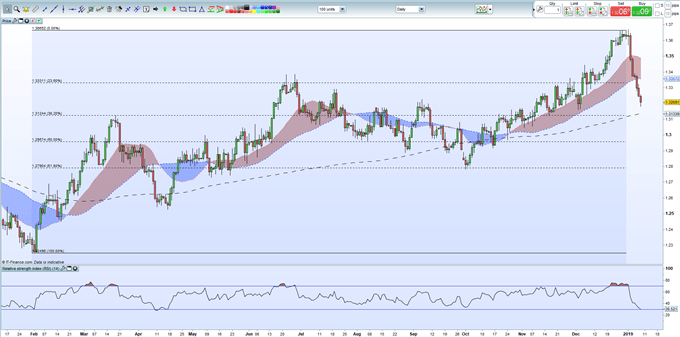
We look to go long USDCAD for a quick trade with a time frame of one day to one week. The near five point drop this year has sent the pair into oversold territory -the RSI indicator at the bottom of the chart - and heading towards the 200-day moving average (1.3135) for the first time since late-October 2018. Just below here, 38.2% Fibonacci retracement at 1.3124 adds further support.
To the upside, the 23.6% Fibonacci retracement at 1.3330 is our first target (50%) before the bottom of the 20- and 50-day cloud at 1.3360 (50%).
From a fundamental stance, the Canadian dollar is reaping the benefit of expected monetary tightening in 2019, although the market is only pricing in around 11bps of rate hikes this year – roughly 50% chance of a 25bp hike – while over in the US rate a 25bp rate hike is expected but not until mid-year, or when/if data allows.
A high risk trade which should be approached as such – i.e.. small size and a tight, guaranteed stop.
USDCAD Daily Price Chart (January 2018 – January 9, 2018)
IG Client Sentiment Datashows how retail investors are positioned in a range of currencies and asset markets.
Traders may be interested in two of our trading guides – Traits of Successful Traders and Top Trading Lessons – while technical analysts are likely to be interested in our latest Elliott Wave Guide.
What is your view on USDCAD – bullish or bearish?? You can let us know via the form at the end of this piece or you can contact the author at nicholas.cawley@ig.comor via Twitter @nickcawley1.
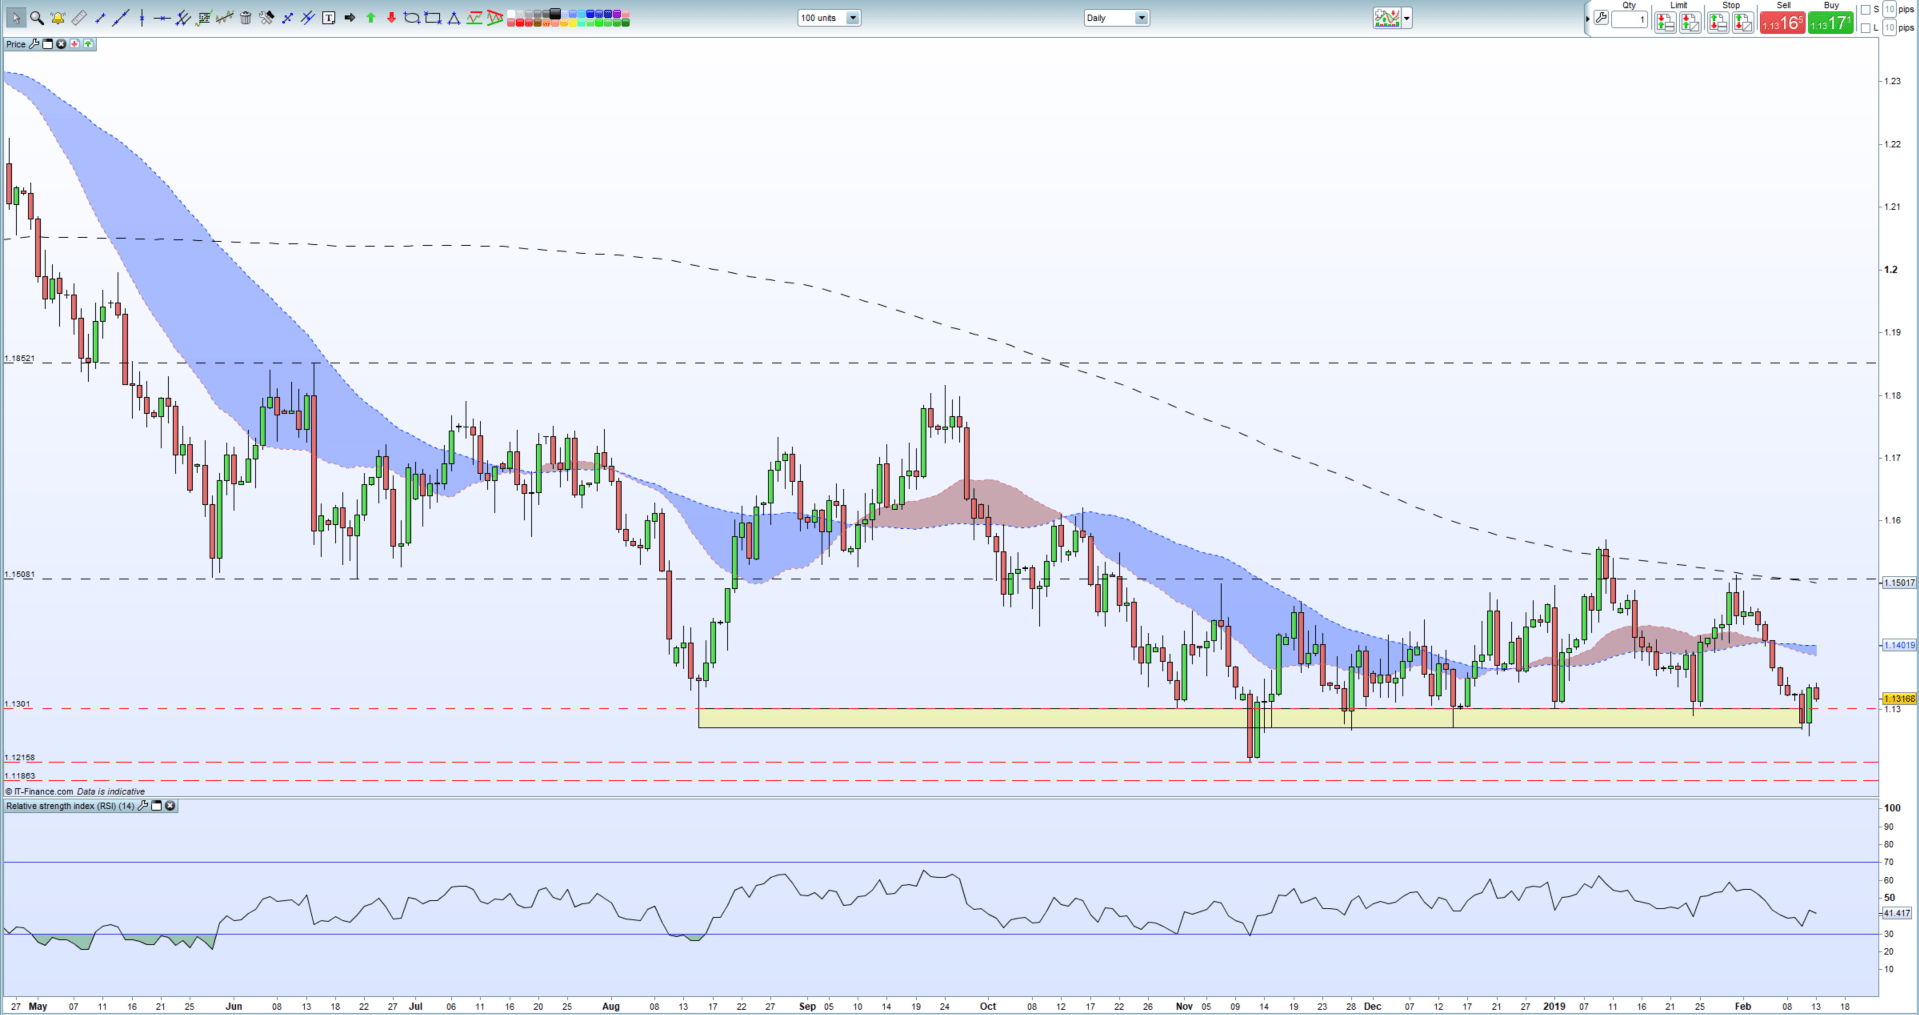
EURUSD Price, Analysis and Chart:
- Euro-Zone growth will likely remain weak.
- EURUSD technical set-up remains flat-to-negative.
EURUSD Bounce Fueled by US Dollar Slippage
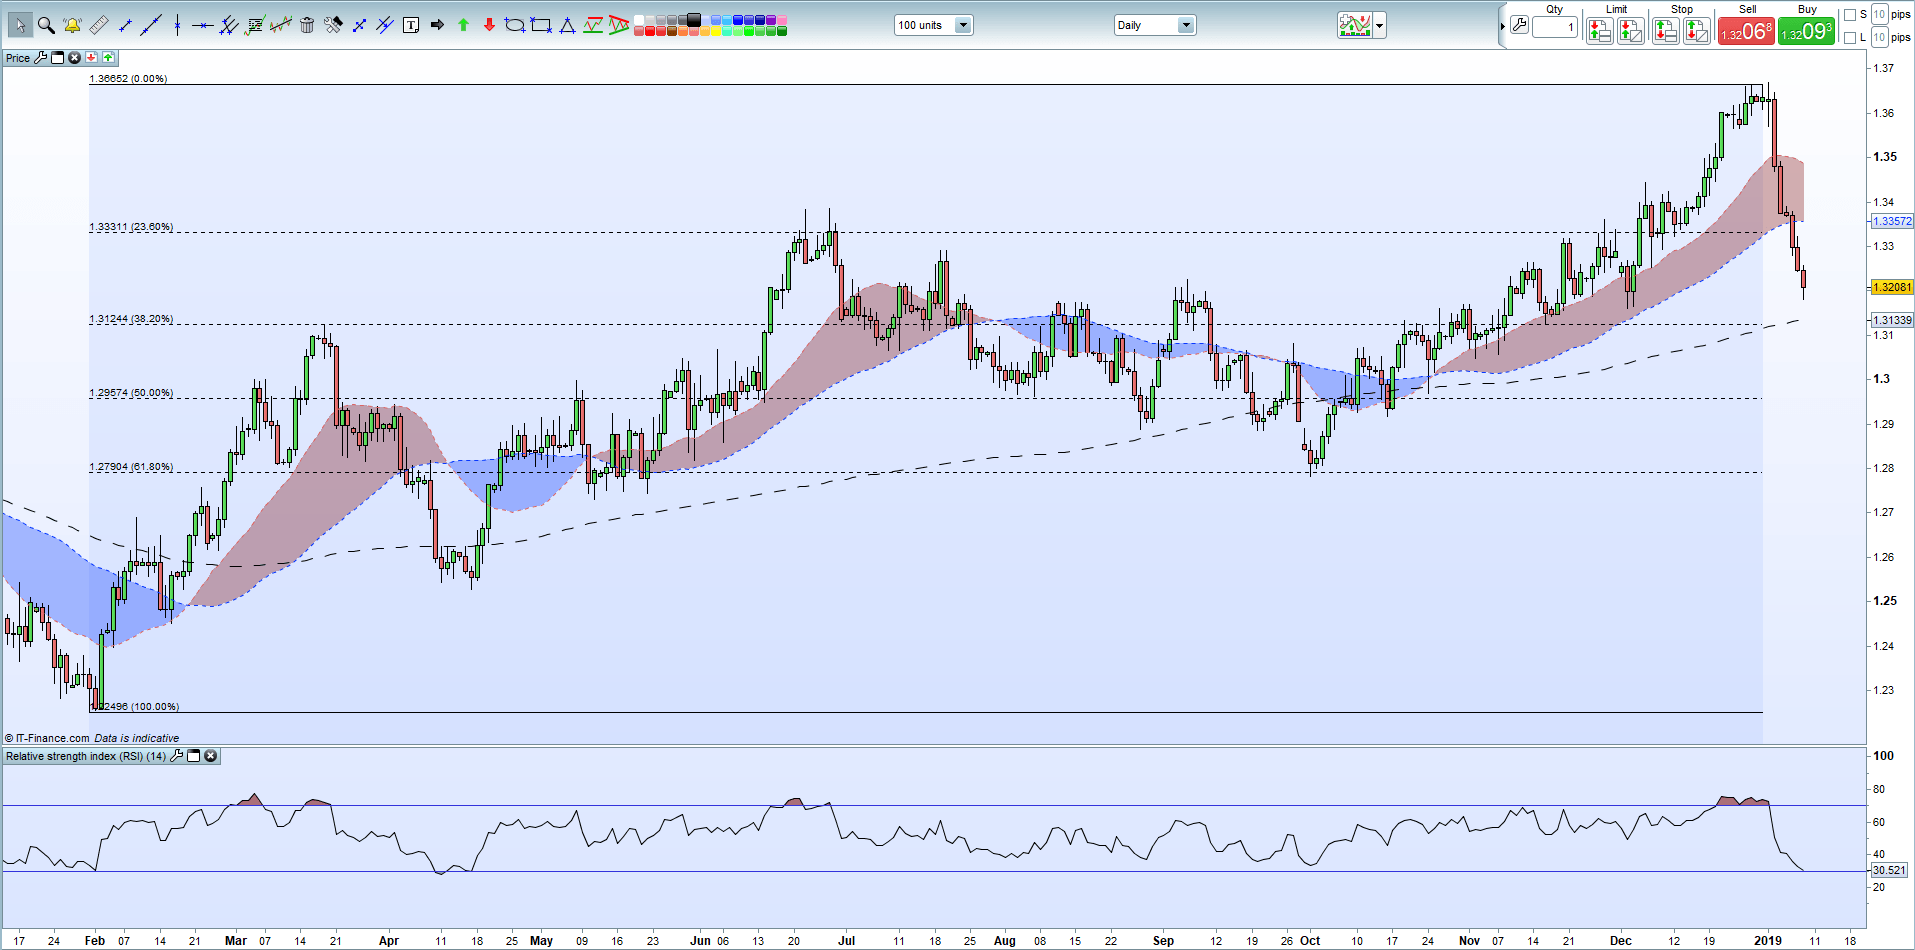
After touching a low just above 1.1255 on Tuesday, the lowest level since mid-November, EURUSD has rallied back to around 1.1320, making a third higher high in a row. The pair are currently being moved around by the US dollar, although EU and German data on Thursday will likely take over the wheel and steer the pair going into the end of the week.
German q/q GDP is released early Thursday morning and is expected to show growth of a miserly 0.1% in Q4, although some in the market are speculating that the reading may be flat for the quarter. German Q3 GDP rocked the market at -0.2% and 2019 German growth is now expected to be just 1%, down from expectations around 1.7% late last year. A slowing global economy, ongoing gloom in the auto industry and fears that a hard Brexit will impact German exporters hard have all added to the slowdown and will likely remain so over the coming months.
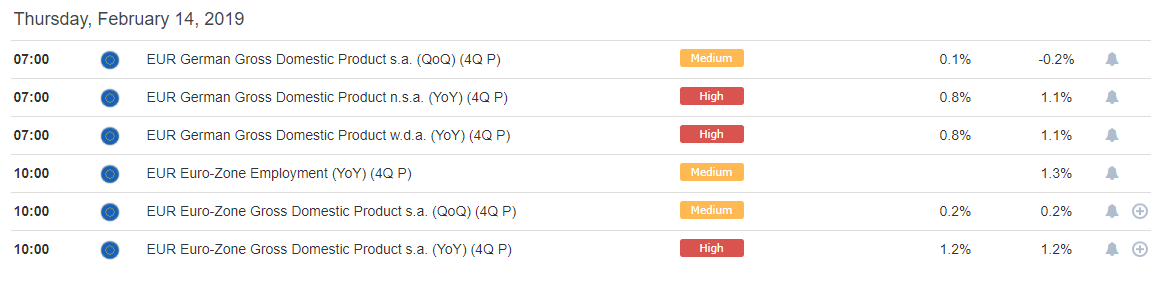
DailyFX Calendar
IG Client Sentiment data currently shows retail are 70.4% net-long EURUSD, a bearish contrarian indicator. However, the combination of current sentiment and recent changes gives us a mixed EURUSD trading bias.
EURUSD remains negative overall, trading well below all three moving averages and just above the 1.1300 area that seems to currently be stemming further losses. If we break and close below 1.1215, a level last seen in June 2017, further losses are likely. Option expires at 1.1350/5 and 1.1375 may also cap upside movement in the short-term. One caveat – the 1.1300 barrier continues to produce reversals with talk that central banks are active around this level. However, a resurgent US dollar and weak data on Thursday may test these buyers resolve and finally see the single currency break lower.
Foundations of Technical Analysis: A Step-by-Step Trade Walk-Through. EURUSD Daily Price Chart (May 2018 – February 13, 2019)
Traders may be interested in two of our trading guides – Traits of Successful Traders and Top Trading Lessons – while technical analysts are likely to be interested in our latest Elliott Wave Guide.
What is your view on EURUSD – bullish or bearish?? You can let us know via the form at the end of this piece or you can contact the author at nicholas.cawley@ig.comor via Twitter @nickcawley1.

Chart Prepared by Jamie Saettele, CMT
DailyFX Trading Guides and Forecasts
Real Time Positioning
-"I'm positive on crude as long as the trendline holds. Now that's a hold! Lows from January and February stretch from 50.69 to 51.25. The upper end of this range looks like the 'best' level for resistance (trendline intersection)." Crude is a few ticks from the upper end of the noted range. As such, respect potential for a pause in the move higher but the broader constructive outlook remains.
Source link
Weekly
Chart Prepared by Jamie Saettele, CMT
DailyFX Trading Guides and Forecasts
Real Time Positioning
-Tomorrow's close for gold is important as a close above the 2011-2012 trendline would be the strongest indication yet of a major trend change. 1307 (big low in 2011 and high in December 2014) lines up as a level to pay attention to from a tactical standpoint.
Recent changes in sentiment warn that the current US 500 price trend may soon reverse lower despite the fact traders remain net-short.
Source link
The BIG Idea: When looking to the interest rate futures market, there is an expected cut by the Federal Reserve in the US reserve rate from June 2019-June 2020. When looking to the Federal Reserve's expectations (aka educated guesses), they are looking to two cuts, which would likely be firmed on a Trade War 'truce' between the US & China. Ironically, the US Dollar is falling because the Fed is concerned the environment is turning too sour to warrant further hikes. However, an improvement in data would reignite the Fed's outlook and firm up expectations for future Fed hikes that would likely strengthen the US Dollar.
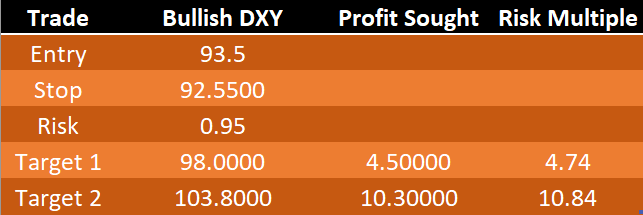
Point to Establish View: Initiation near 94-93 (H2 2018 support zone)
Spot: DXY @ 94.809
Objective 1: 98 (Fibonacci target,) > 1:1 Risk: Reward Ratio
Objective 2: 103.80 (2016 high)1:10.8 Risk: Reward Ratio
Objective 3: Hold with Trailing Stopon a close below 50-DMA or Ichimoku Cloud
Idea Invalidation Level: 92.55 (50% of 2018 range) 145-45 pip stop depending on entry
View Structure
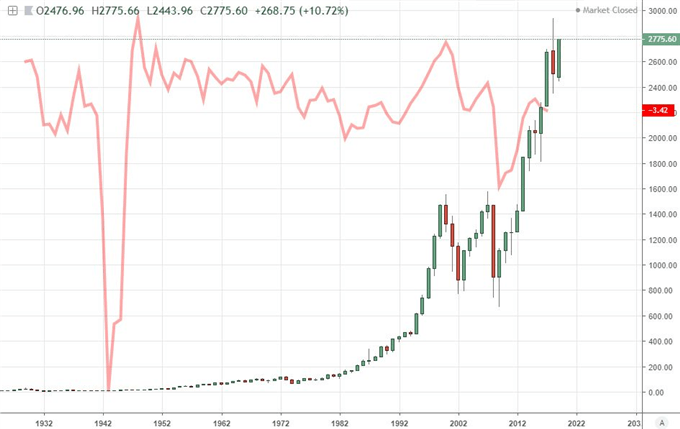
The BIG Picture:
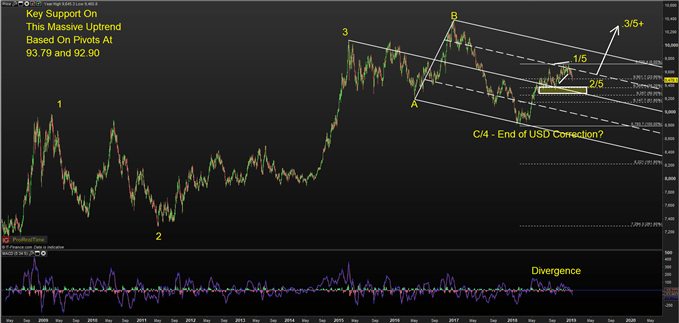
Chart Source: Pro Real Time with IG UK Price Feed. Created by Tyler Yell, CMT
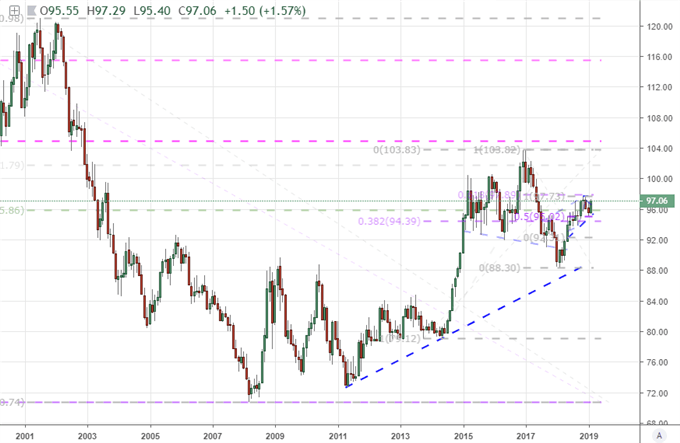
The challenge with Elliott Wave is deciphering the correct corrective/ non-trending moves. These are seen as waves 2-4-B. These are important Because waves 1-3-5-A-C being the strongest and most aggressive moves in the direction of the trend.
Above, you'll notice that the expanded wave fourlabeled A-B-C from 2015-2018 is seen as preceding a potential wave five that could take the US Dollar to new post-2008 highs. The set-up for this trade anticipates that we're in corrective-wave 2 of wave five that could aggressively move higher if this move plays out as analyzed.
Lastly, the relationship between the corrective waves is very important. The 2009-2011 corrective wave 2 was 113 weeks or 2 years and two months. The 2015-2018 was near 1.382% (a Fibonacci relationship) the length of the 2009-2011 correction at 153 weeks.
Should we be embarking on the start of wave 3 of 5 in DXY, we could see a very strong rally that could have EUR/USD lower and USD/JPY much higher.
The big idea behind why the market would start to price in a strong US Dollar has mainly to do with the recent US Dollar weakness that began on December 14 on the market's belief that the Fed will pull way back their expected rate hikes in 2019, and may even cut to support the economy.
There is one problem with this view though. The Fed is still expecting to hike twice though Powell recently noted a needed 'patience' in understanding the data, and what it means for whether the economy can withstand more hikes.
I argue that a key factor or main reason why the economy has shifted to this view is likely transitory factors like the US-China Trade War, which if a 'truce' is obtained, could lead to the Fed reaffirming their two+ hike view in 2019.
Ironically, the weakening backdrop that has encouraged the Fed to push back their rate hike bets has aligned with an incredible bounce of the SPX500. Since the close December 24, the SPX500 has jumped 11.6%, and more could be on the way on further US Dollar weakness. The SPX500 strength can be labelled under FOMO, but the environment that it is built upon seems shakier than ever as a weaker US Dollar would likely only result from a backdrop that leads to materially weaker revenue outlooks for constituents of the index.
Put simply, I would argue that the end of the world is overstated, and when positive developments return and the Fed pricing returns to rate normalization (i.e., hikes) that the US Dollar will resume the rally it began in February.
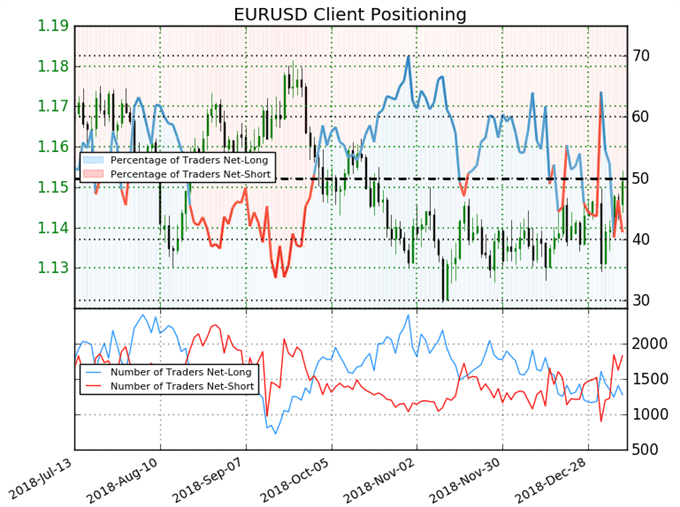
Source: IG Client Sentiment
For EURUSD,IG Client Sentiment retail trader data shows 41.1% of traders are net-long with the ratio of traders short to long at 1.43 to 1. Please note, EUR/USD is utilized as it makes up 56.8% of the DXY, and the sentiment picture can provide deep insight to the outlook of DXY.
We typically take a contrarian view to crowd sentiment, and the fact traders are net-short suggests EURUSD prices may continue to rise. Traders are further net-short than yesterday and last week, and the combination of current sentiment and recent changes gives us a stronger EURUSD-bullish contrarian trading bias(emphasis mine.)
The reason I share this with you is that it seems to indicate that Dollar weakness could continue in the near-term. You'll notice the long entry order is below current market on the Dollar Index so IGCS appears to be showing that we could see the entry order triggered with a relatively tight stop loss relative to the expected profit targets.
DailyFX offers a surplus of helpful trading tools, indicators, and resources to help traders. For those looking for trading ideas, our IG Client Sentiment shows the positioning of retail traders with actual live trades and positions.
Our trading guides bring our DailyFX Quarterly Forecasts and our Top Trading Opportunities, and our real-time news feedhas intra-day interactions from the DailyFX team. And if you're looking for real-time analysis, our DailyFX Webinars offer numerous sessions each week in which you can see how and why we're looking at what we watch.
If you're looking for educational information, our New to FX guide is there to help new(er) traders while our Traits of Successful Traders research is built to help sharpen the skill set by focusing on risk and trade management.
---Written by Tyler Yell, CMT
Tyler Yell is a Chartered Market Technician. Tyler provides Technical analysis that is powered by fundamental factors on key markets as well as trading educational resources. Read more of Tyler's Technical reports via his bio page.
Communicate with Tyler and have your shout below by posting in the comments area. Feel free to include your market views as well.
Talk markets on twitter @ForexYell
Point to Establish View: Initiation near 94-93 (H2 2018 support zone)
Spot: DXY @ 94.809
Objective 1: 98 (Fibonacci target,) > 1:1 Risk: Reward Ratio
Objective 2: 103.80 (2016 high)1:10.8 Risk: Reward Ratio
Objective 3: Hold with Trailing Stopon a close below 50-DMA or Ichimoku Cloud
Idea Invalidation Level: 92.55 (50% of 2018 range) 145-45 pip stop depending on entry
View Structure
The BIG Picture:
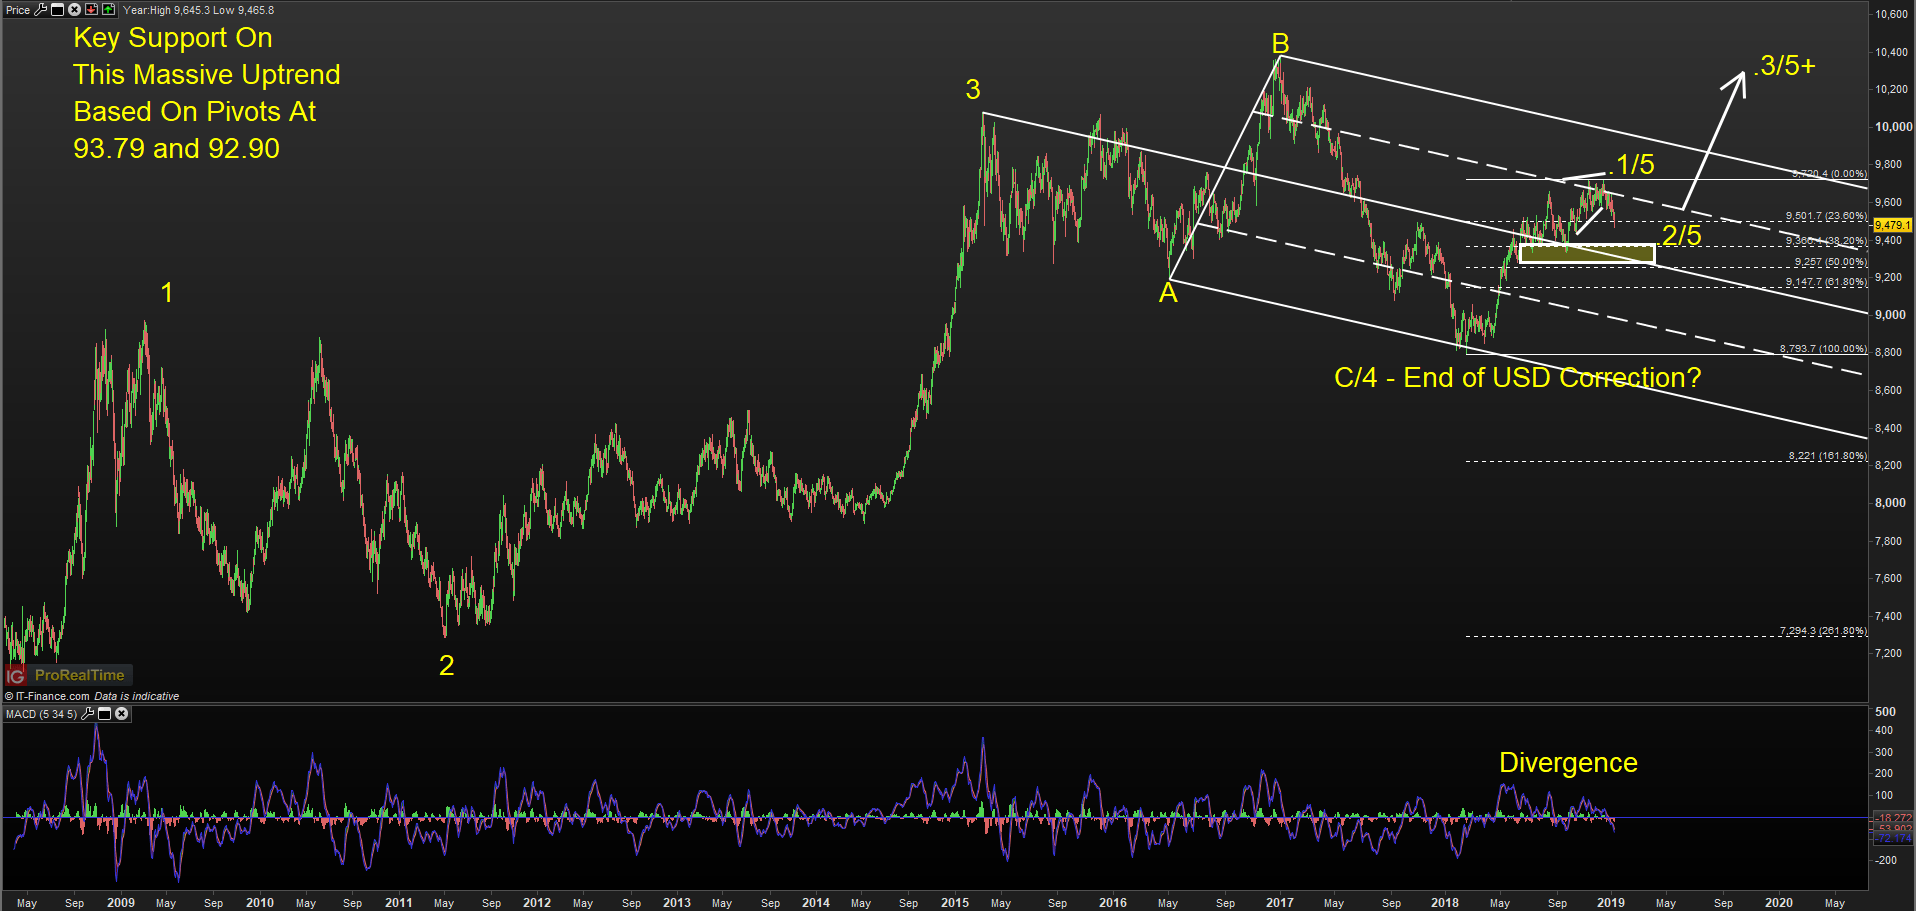
Chart Source: Pro Real Time with IG UK Price Feed. Created by Tyler Yell, CMT
Technical Reasoning Behind the Trade
The labels on the DXY chart above align with Elliott Wave analysis. The purpose of Elliott Wave is to put current market moves in a context that can help you create probability weighted outcomes that can help traders anticipate opportunities and manage risk for when the outlook changes.The challenge with Elliott Wave is deciphering the correct corrective/ non-trending moves. These are seen as waves 2-4-B. These are important Because waves 1-3-5-A-C being the strongest and most aggressive moves in the direction of the trend.
Above, you'll notice that the expanded wave fourlabeled A-B-C from 2015-2018 is seen as preceding a potential wave five that could take the US Dollar to new post-2008 highs. The set-up for this trade anticipates that we're in corrective-wave 2 of wave five that could aggressively move higher if this move plays out as analyzed.
Lastly, the relationship between the corrective waves is very important. The 2009-2011 corrective wave 2 was 113 weeks or 2 years and two months. The 2015-2018 was near 1.382% (a Fibonacci relationship) the length of the 2009-2011 correction at 153 weeks.
Should we be embarking on the start of wave 3 of 5 in DXY, we could see a very strong rally that could have EUR/USD lower and USD/JPY much higher.
Fundamental Justification For Bullish DXY View
The technical justification can be summarized as saying, I think we're about to embark on the strongest part of wave 5, which began in February 2018. The fundamental justification can be summarized as believing that the market swung too aggressively in pricing out FOMC hikes and into FOMC cuts, and normalization of this extreme view may lead to USD strength.The big idea behind why the market would start to price in a strong US Dollar has mainly to do with the recent US Dollar weakness that began on December 14 on the market's belief that the Fed will pull way back their expected rate hikes in 2019, and may even cut to support the economy.
There is one problem with this view though. The Fed is still expecting to hike twice though Powell recently noted a needed 'patience' in understanding the data, and what it means for whether the economy can withstand more hikes.
I argue that a key factor or main reason why the economy has shifted to this view is likely transitory factors like the US-China Trade War, which if a 'truce' is obtained, could lead to the Fed reaffirming their two+ hike view in 2019.
Ironically, the weakening backdrop that has encouraged the Fed to push back their rate hike bets has aligned with an incredible bounce of the SPX500. Since the close December 24, the SPX500 has jumped 11.6%, and more could be on the way on further US Dollar weakness. The SPX500 strength can be labelled under FOMO, but the environment that it is built upon seems shakier than ever as a weaker US Dollar would likely only result from a backdrop that leads to materially weaker revenue outlooks for constituents of the index.
Put simply, I would argue that the end of the world is overstated, and when positive developments return and the Fed pricing returns to rate normalization (i.e., hikes) that the US Dollar will resume the rally it began in February.
What is IG Client Sentiment Saying?
Source: IG Client Sentiment
For EURUSD,IG Client Sentiment retail trader data shows 41.1% of traders are net-long with the ratio of traders short to long at 1.43 to 1. Please note, EUR/USD is utilized as it makes up 56.8% of the DXY, and the sentiment picture can provide deep insight to the outlook of DXY.
We typically take a contrarian view to crowd sentiment, and the fact traders are net-short suggests EURUSD prices may continue to rise. Traders are further net-short than yesterday and last week, and the combination of current sentiment and recent changes gives us a stronger EURUSD-bullish contrarian trading bias(emphasis mine.)
The reason I share this with you is that it seems to indicate that Dollar weakness could continue in the near-term. You'll notice the long entry order is below current market on the Dollar Index so IGCS appears to be showing that we could see the entry order triggered with a relatively tight stop loss relative to the expected profit targets.
FOREX TRADING RESOURCES TO SUPPORT YOUR STRATEGY
We hope you enjoy DailyFX's new podcast: Trading Global Markets DecodedDailyFX offers a surplus of helpful trading tools, indicators, and resources to help traders. For those looking for trading ideas, our IG Client Sentiment shows the positioning of retail traders with actual live trades and positions.
Our trading guides bring our DailyFX Quarterly Forecasts and our Top Trading Opportunities, and our real-time news feedhas intra-day interactions from the DailyFX team. And if you're looking for real-time analysis, our DailyFX Webinars offer numerous sessions each week in which you can see how and why we're looking at what we watch.
If you're looking for educational information, our New to FX guide is there to help new(er) traders while our Traits of Successful Traders research is built to help sharpen the skill set by focusing on risk and trade management.
---Written by Tyler Yell, CMT
Tyler Yell is a Chartered Market Technician. Tyler provides Technical analysis that is powered by fundamental factors on key markets as well as trading educational resources. Read more of Tyler's Technical reports via his bio page.
Communicate with Tyler and have your shout below by posting in the comments area. Feel free to include your market views as well.
Talk markets on twitter @ForexYell
Source link
GBP price, news and analysis:
- The headline measure of UK inflation fell to 1.8% year/year in January, down from 2.1% in December and below analysts' consensus forecast of 2.0%.
- However, GBP was underpinned by private comments Tuesday from the UK's chief Brexit negotiator implying that Members of the UK Parliament would have to choose between a reworked Brexit deal or a potentially significant delay.
- That suggests the chances of a no-deal Brexit are receding: a positive for the Pound as the March 29 deadline approaches.
UK inflation eases in January
UK inflation fell to 1.8% year/year in January, down from 2.1% in December, below analysts' consensus forecast of 2.0% and under the Bank of England's 2.0% target. Core inflation was unchanged at 1.9%, as predicted.The latest 1.8% figure is the lowest for two years and the Office for National Statistics attributed the drop to cheaper gas, electricity and petrol prices, partly offset by cheaper ferry tickets and air fares.
In theory, the data make a tightening of UK monetary policy less likely, are therefore negative for the Pound and back up comments Tuesday by Bank of England Governor Mark Carney, who said provided economic expansion continues a modest tightening of monetary policy over time will likely be sufficient to achieve the central bank's inflation target.
Nonetheless, the principal driver of GBP remains Brexit and the Pound fell only marginally Wednesday as concerns eased that the UK will leave the EU on March 29 without a deal.
GBPUSD Price Chart, Daily Timeframe (September 21, 2018 – February 13, 2019)
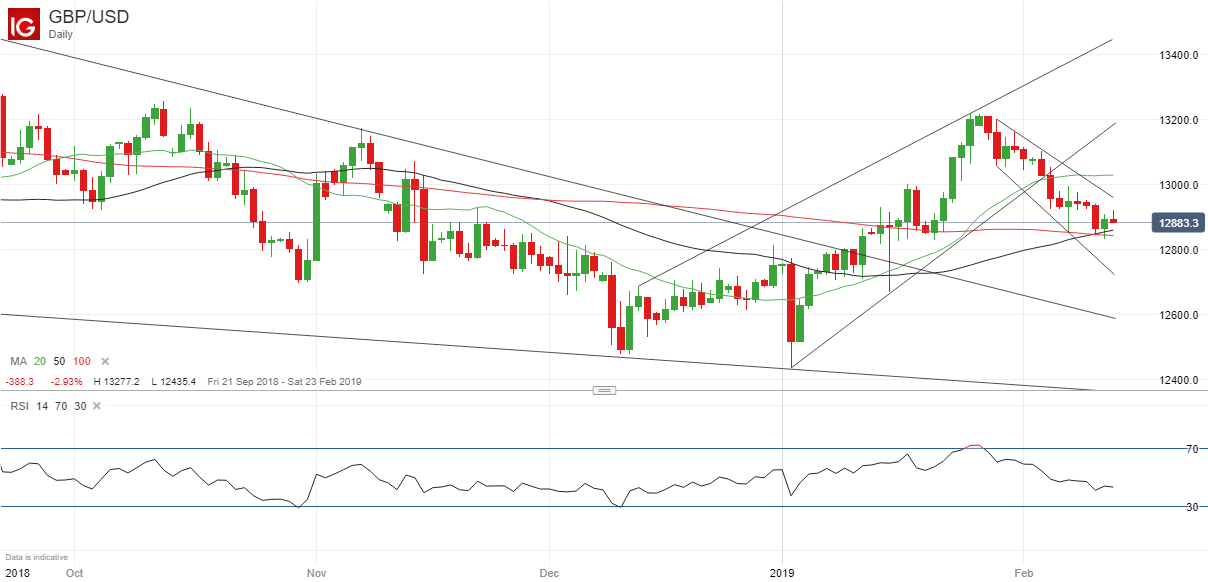
Chart by IG (You can click on it for a larger image)
Robbins says May's deal or long delay
Sterling's better tone Tuesday was due principally to a private comment by Olly Robbins, the UK's chief Brexit negotiator, who was reported to have said that the British Parliament will face a choice between UK Prime Minister Theresa May's Brexit deal or a long extension of the March 29 deadline.Robbins was reportedly overheard by an ITV correspondent at a hotel bar in Brussels saying lawmakers would have to choose whether to accept a reworked Brexit deal or a potentially significant delay. "Got to make them believe that the week beginning end of March... Extension is possible but if they don't vote for the deal then the extension is a long one,"the broadcaster quoted Robbins as saying.
Brexit Secretary Steve Barclay said later that he did not want to comment on conversations heard second hand in a noisy bar but the government's position was that the UKwould leave the EU on March 29 but wanted to do so with a deal.
Taken together, the comments seem to imply that a no-deal Brexit is no longer an option – a helpful development for the Pound – but nonetheless one that still cannot be ruled out entirely.
More to read:
Brexit Effect on Pound and UK Stocks: Impact of Deal or No DealBrexit and the Pound: Why EU Might Spurn a Last-Minute Deal With the UK
Resources to help you trade the forex markets:
Whether you are a new or an experienced trader, at DailyFX we have many resources to help you:--- Written by Martin Essex, Analyst and Editor
Feel free to contact me via the comments section below, via email at martin.essex@ig.com or on Twitter @MartinSEssex
Source link
EUR/USD Elliott Wave Analysis Talking Points:
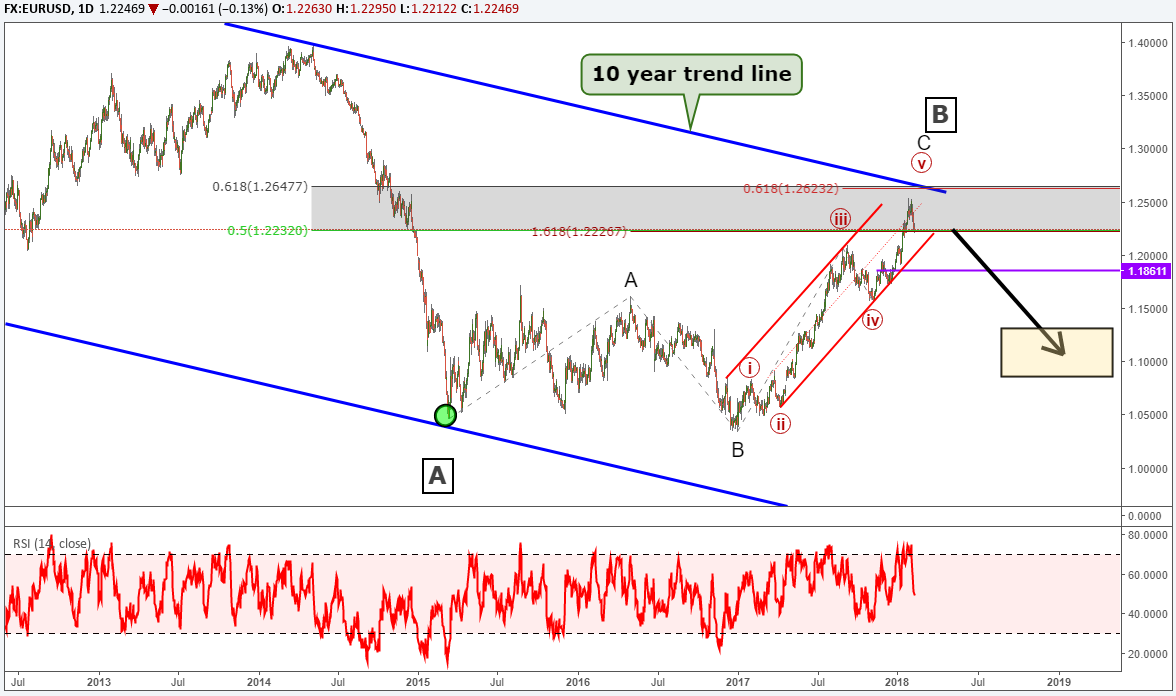
- EURUSD is very close to completing a three year Elliott Wave expanded flat pattern
- The final wave is taking shape with some targets near the 10 year trend at 1.26
- A bearish reversal has an initial target of 1.15 with a secondary zone 1.09-1.12
Elliott Wave Flat Pattern Began in 2015
EUR/USD has been correcting sideways since March of 2015 as an A-B-C wave. This three-wave move is shaped as an expanded flat pattern.According to the Elliott Wave principle, the 'C' wave of the flat would need to carve in five waves and it is the terminal wave of the larger pattern. We can see from the chart below that the pattern is nearly complete as the fifth and final wave is advanced in length.
Elliott Wave Theory 5th Wave of a 5th Wave underfoot
One benefit of reading the charts using Elliott Wave Theory is that we can determine the maturity of the trend based on how many waves have formed. As mentioned above, we appear advanced within the fifth and final wave of 'C'. As we inspect the fifth wave that began in November, we can count four waves complete or nearly so (grey waves on the chart). As a result, the fifth wave of a fifth wave represents an aging trend that is ripe for reversal. For those keeping score at home, EURUSD is in wave (v) of ((v)) of C. Each of those three wave are ending waves.
Elliott Wave Forecasted Reversal Zone
According to the Elliott Wave principle, there are guidelines for estimating the distance of fifth waves and multiple wave relationships appear near 1.26. We believe EUR/USD may rise to finish the three-year expanded flat pattern and reverse near 1.26. If EUR/USD overshoots 1.26, that is ok, because the wave relationships are guidelines to help anchor you on the maturity of the current trend.Within an impulse wave, there are wave relationships we can use to estimate the length of the fifth wave. Many times, the fifth wave is .382 or .618 times the length of waves 1 through 3. Essentially, the fourth wave divides the whole impulse wave with the golden ratio.
- Grey wave (v) is .382 times waves (i) through (iii) at 1.2588.
- Red circle wave 'v' is .618 times waves 'I' through 'iii' at 1.2623
- The 10 year resistance trend line for EUR/USD crosses near 1.2620
- The fibonacci 61.8% retracement of the 2014 sell off is at 1.2648
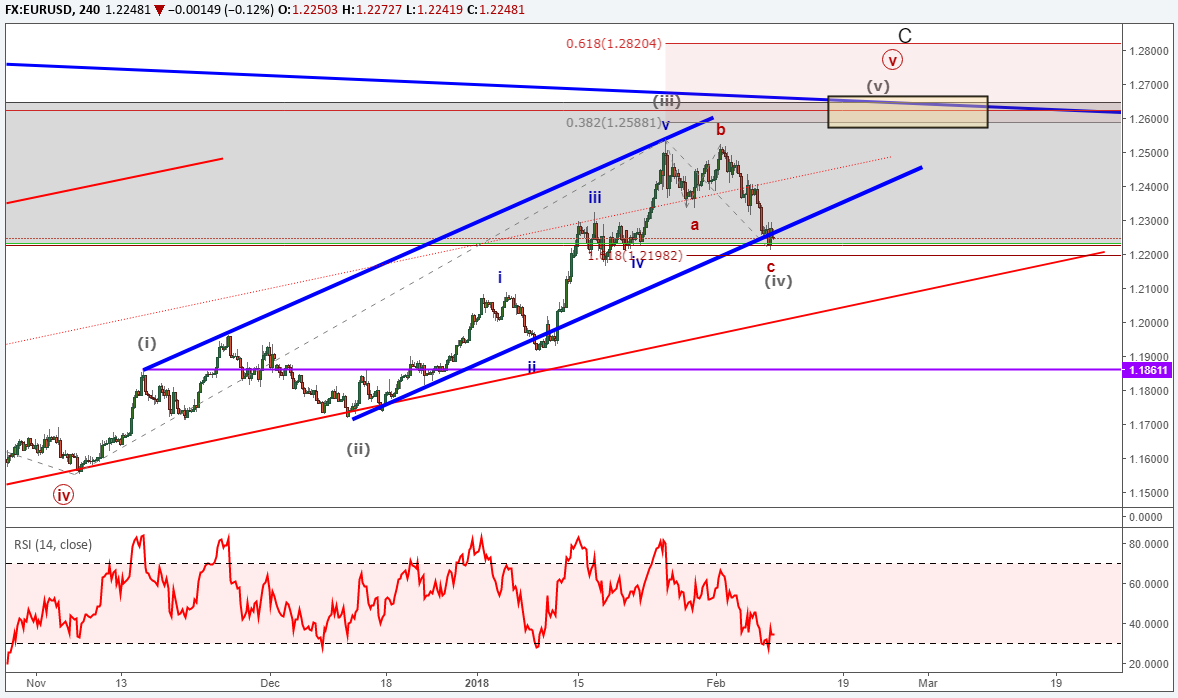
As you can see, several wave relationships appear in a tight price zone near 1.26. As a result, if EUR/USD does extend towards these levels, we believe it is higher probability of a bearish trend reversal than a bullish breakout.
What is the EURUSD Trading Opportunity?
Though EURUSD may advance to 1.26, we are nearing the exit ramp on the freeway. The better opportunities are when we have more reward relative to the risk. Though smaller trades can be considered to the bullish side, the better risk to reward ratios are if EURUSD is successful in reaching the 1.26 zone. At 1.26, good risk to reward ratios are available for short positions strategically placed. We will discuss those strategies (like breakouts) in future writings. Our Traits of Successful Traders research unpacks the importance of risk to reward ratios and how our mind handles winning and losing trades.If EURUSD does turn lower, our initial target is 1.15 that contains the previous fourth wave low. Secondary targets arrive near 1.09-1.12.
Elliott Wave Theory FAQs
"The Elliott Wave principle seems subjective!"Well, I would disagree, as the EWP rules are not broken. The challenge is most likely the result of forecasting error. Even I make forecasting mistakes and it happens to everyone as we are assessing a live market environment. One key for budding Elliott Wave technicians is to learn the main patterns, and then minimize those errors by following the larger trend. We discuss this and other expert tips in our beginners and advanced trading guides.
How will I know if EUR/USD has topped using Elliott Wave?
There are certain Elliott Wave patterns that indicate a new trend in the opposite direction is forming. First, I look for a five-wave motive wave to carve to the downside. Secondly, we look for a three wave partial retracement higher. This 5-3 pattern is an early warning indication the near term trend has reversed from up to down. We have a one-hour webinar recording on "How to Start Your Elliott Wave Analysis".
New to trading FX? This guide is just for you.
---Written by Jeremy Wagner, CEWA-M
Jeremy Wagner is a Certified Elliott Wave Analyst with a Master's designation. Jeremy provides Elliott Wave analysis on key markets as well as Elliott Wave educational resources. Read more of Jeremy's Elliott Wave reports via his bio page.
Communicate with Jeremy and have your shout below by posting in the comments area. Feel free to include your Elliott Wave count as well.
Follow on twitter @JWagnerFXTrader .
Join Jeremy's distribution list.
Source link
- My medium-term bias for the Dollar is bearish with issues such as slowing growth, a tempered Fed and trade war blowback coalescing
- There are certainly scenarios in which the Greenback could recharge its rally such as full-tilt risk aversion or Brexit fallout
- Having an 'alternative view' analysis and trade option in hand - for this or any market/theme - is good practice and preparation
See how retail traders are positioning in USDCHF, EURUSD, GBPUSD and other major currency pairs along with indices, commodities and cryptocurrency on an intraday basis using theDailyFX speculative positioning data on the sentiment page.
My Leading Expectation for the Dollar
It is important to establish a sense of conviction in a market, but also to realize that there are frequent phases that see all assets and regions abstain from bullish or bearish momentum as speculators search for a clear thread. With that said, I have a general, medium-term bearish bias for the US Dollar. 'Medium-term' from my perspective is a view ranging from one to six months into the future. Where does this perspective come from, particularly considering it contradicts the prevailing momentum over the past 9 months? Despite the drift for the benchmark currency, the motivations for bulls over the past few years have notably deflated while new, questionable contributions are starting to draw greater scrutiny over the question of 'winners' and 'losers' to the policy being pursued. As risk trends ebb, we have drawn greater attention to the Dollar's young role as a carry currency. That is both a detriment as a carry unwind can hurt the preemptive chase for yield at the same time that rate forecasts themselves slide. Growth forecasts have similarly come under pressure in the US - as they have globally. Yet, coupled with the pursuit of policy that looks to earn greater domestic expansion at the expense of trade, the concerns of blowback from aggressive policies are starting to gain traction. Beyond these more immediate issues, the tectonic shifts in the Greenback's reserve currency status and its traditional valuation limits via debt analysis pose a deep risk that are only starting to creep into mainstream conversation.
Chart of DXY Dollar Index (Monthly)
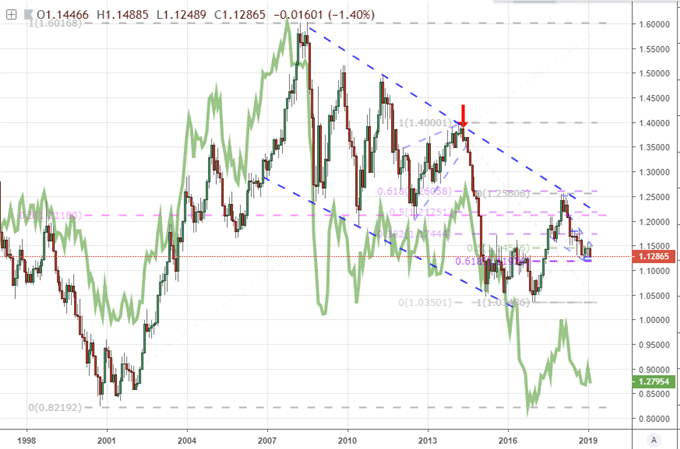
The Value of Alternative Views and the Problem with Most Dollar-Based Majors
Having a prevailing view is evaluating probabilities - and, in the long-run, success in investing translates directly into our ability to pursue reliable outcomes. However, surprises are inevitable as the markets are sometimes dictated by change that defies reasonable expectations. We can face this inevitability in one of two ways. We could make it part of our trade management to recognize when conditions have changed in our analysis or active trade, cut and move on to the next scenario that fits our given criteria. Alternatively, we could proactively consider what a productive alternative scenario outcome (one in which generates significant market movement rather than stagnation) and establish possible setups that could take advantage of the market's development. With that objective in mind, what Dollar pairs are strong candidates for a further bullish run? As we have seen from the likes of EURUSD and GBPUSD, there is natural appeal for the Greenback via its position as a principal alternative to top liquidity currencies. Yet, how productive of a role will that prove for a sustained trend? Such a motivation requires an extreme backdrop which can invite numerous, unexpected complications. Furthermore, when we look to the big-picture technical standings of the majors, there are few instances where there is plenty of historical range for which the currency can run from a long-discounted position. EURUSD closing on 1.1200 would only reasonably open up to 1.0500 as a multi-decade low. GBPUSD is even more restricted as 1.1900 is a three-decade low. The commodity pairings (AUDUSD, NZDUSD, USDCAD) have seen their high-yield components collapse while USDJPY is a confusion on a key fundamental theme: risk trends.
Chart of EURUSD and GBPUSD in Green (Monthly)
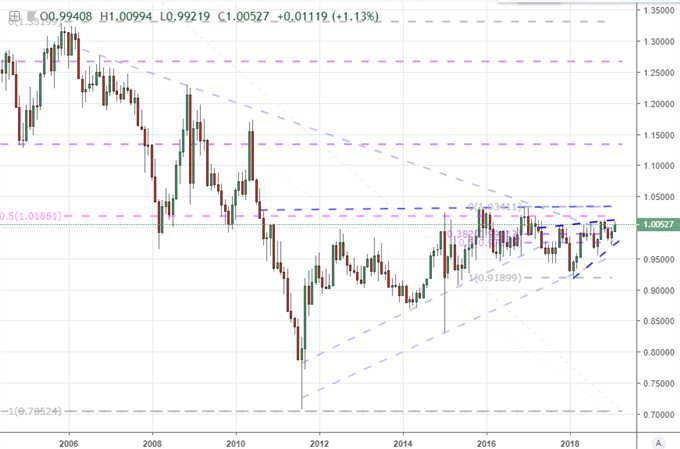
A Long 'Pros' List for USDCHF Than Most Others
In a list of poor candidates, the USDCHF is perhaps one of the most appealing of the Dollar-based majors when we are contemplating USD-bullish scenarios. On the fundamental side, there is some safe haven conflict between the two currencies, but that is far less complicated than say USDJPY. Carry has played little role in this particular pair owing to the extreme (arguably desperate) monetary policy of the Swiss National Bank. The systemic questions of reserve status are going to be serious questions for both push-come-to-shove, and simple growth forecasts find both under pressure (the US for its own issues and the Swiss for their connection to mainland Europe). On the technical side, there is a long-term discount still priced into USDCHF. This is in part a product of the Franc, but it also has a strategic connection to the Euro's influence. Taking a look at a weekly chart, there is the potential for significant resistance clearance in the 1.0100 to 1.0300 area. Should the long-term wedge top fall, there is plenty of open air for follow through dating back to previous decades. We consider the best candidate for the alternative to my prevailing Dollar outlook in today's Quick Take video.
Chart of USDCHF (Monthly)
Source link
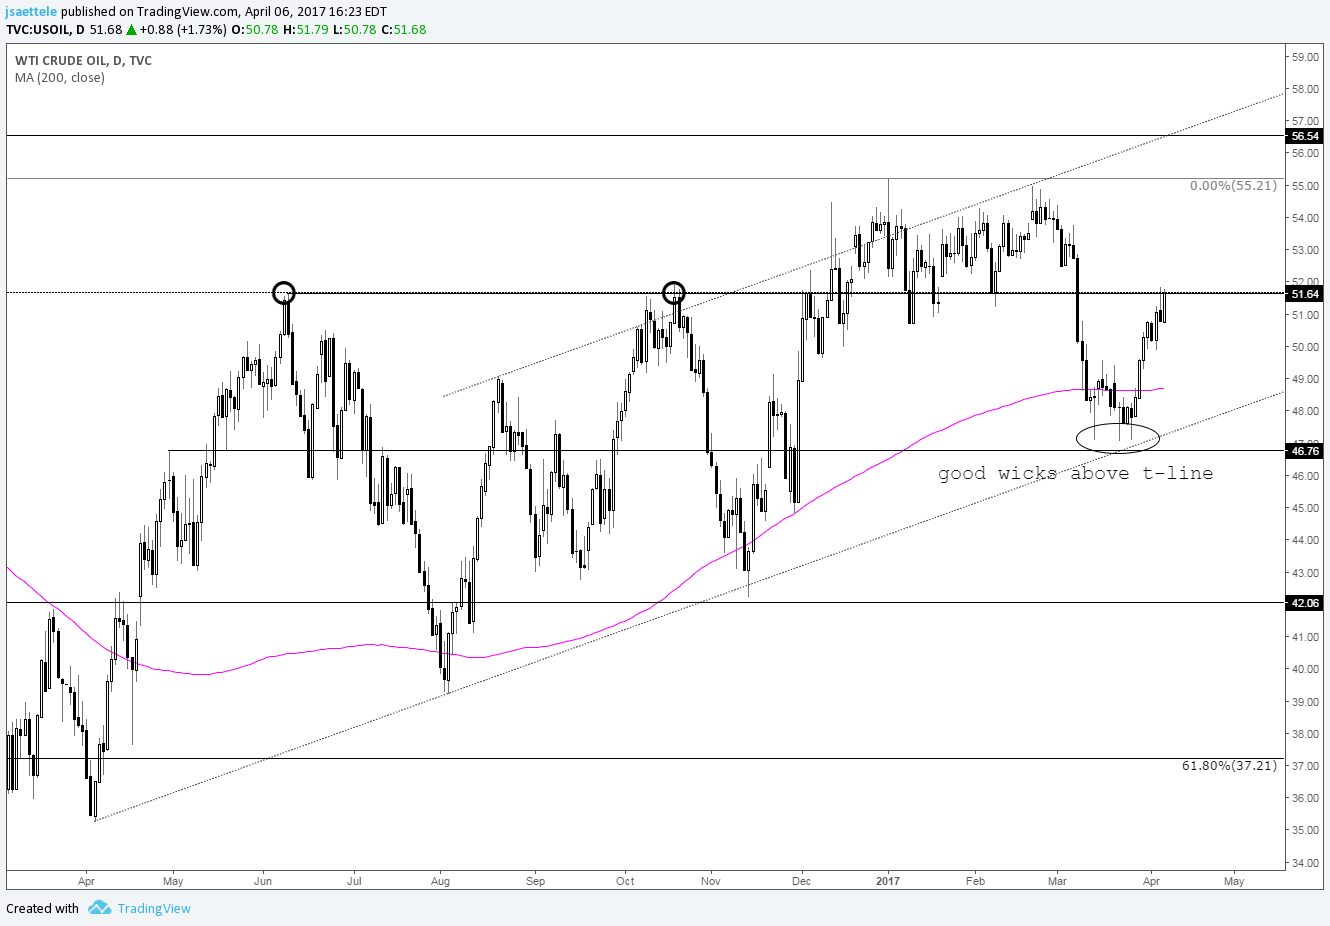
Chart Prepared by Jamie Saettele, CMT
DailyFX Trading Guides and Forecasts
Real Time Positioning
-"I'm positive on crude as long as the trendline holds. Now that's a hold! Lows from January and February stretch from 50.69 to 51.25. The upper end of this range looks like the 'best' level for resistance (trendline intersection)." Crude is above the top of the noted range and trading at the highs from June and October 2016. As such, respect potential for a pause in the move higher but the broader constructive outlook remains.
Source link
Weekly
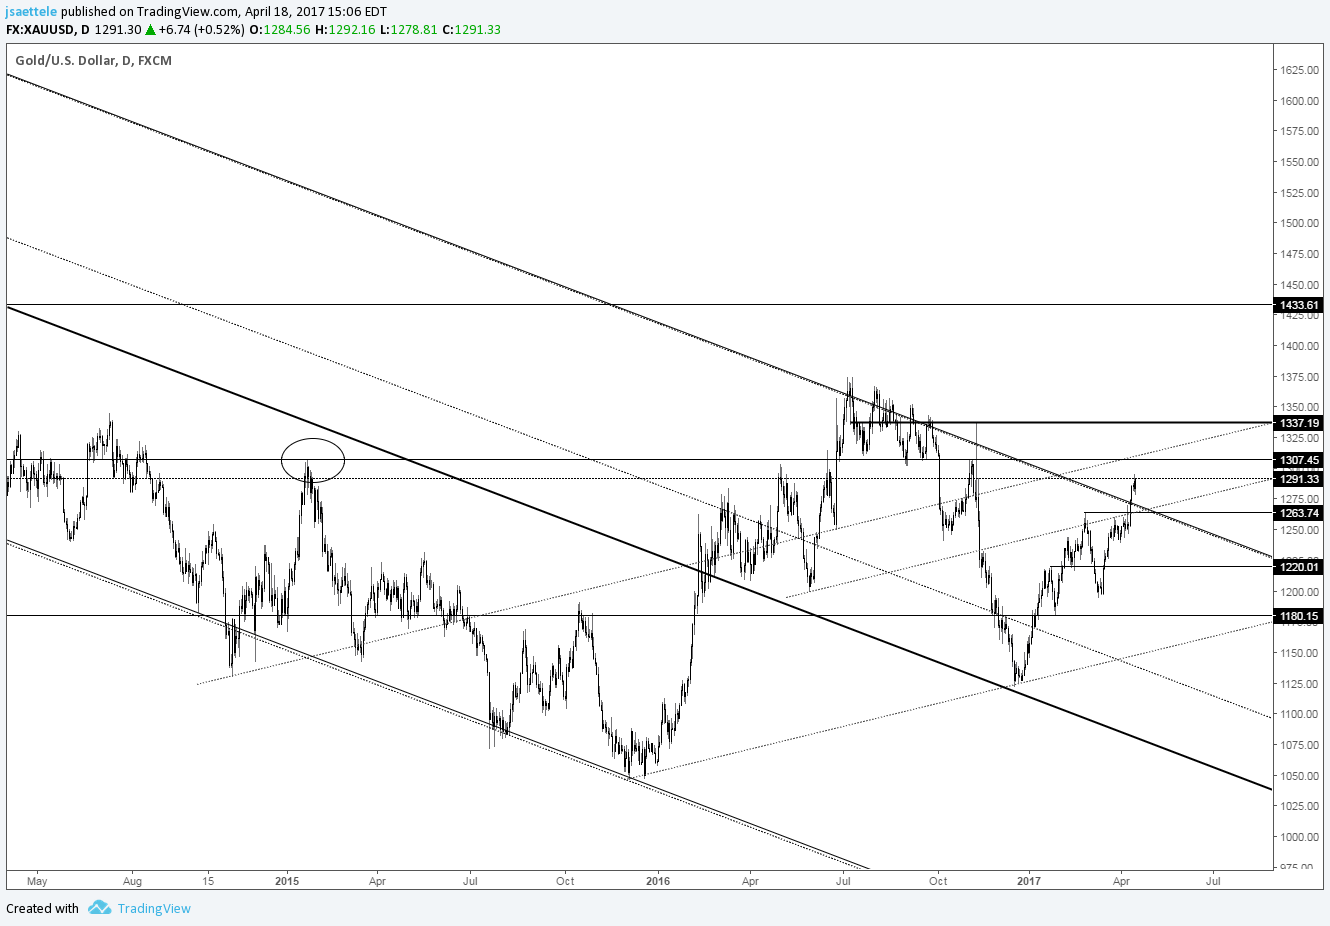
Chart Prepared by Jamie Saettele, CMT
DailyFX Trading Guides and Forecasts
Real Time Positioning
-I noted last update that "the weekly close for gold is important as a close above the 2011-2012 trendline would be the strongest indication yet of a major trend change. 1307 (big low in 2011 and high in December 2014) lines up as a level to pay attention to from a tactical standpoint." The 2011-2012 trendline has been broken. For more on gold, check out this video.
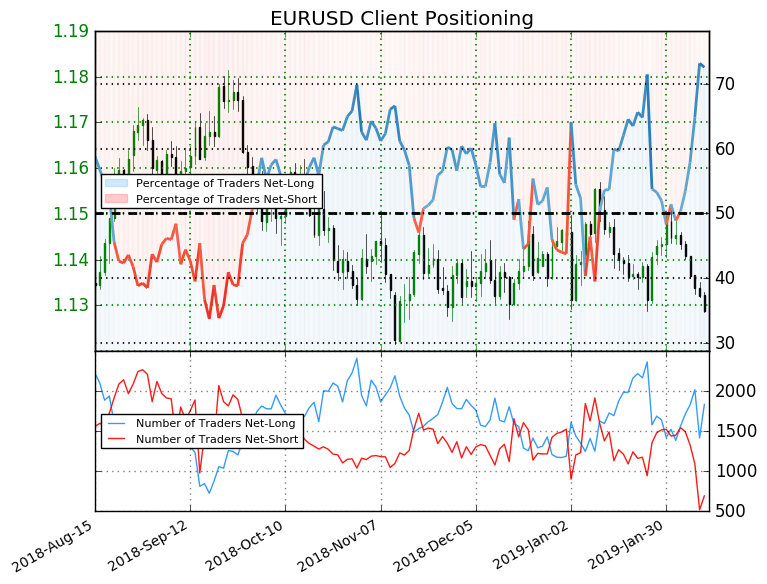
72.6% OF TRADERS ARE NET-LONG
EURUSD: Retail trader data shows 72.6% of traders are net-long with the ratio of traders long to short at 2.65 to 1. The number of traders net-long is 13.9% lower than yesterday and 17.1% higher from last week, while the number of traders net-short is 32.8% lower than yesterday and 56.4% lower from last week.For more in-depth analysis, check out the Q1 2019 Forecast for the Euro
EURUSD SENTIMENT SUGGESTS BEARISH TRADING BIAS
We typically take a contrarian view to crowd sentiment, and the fact traders are net-long suggests EURUSD prices may continue to fall. Traders are further net-long than yesterday and last week, and the combination of current sentiment and recent changes gives us a stronger EURUSD-bearish contrarian trading bias.Having trouble developing your strategy? Here's the #1 mistake that traders make.
--- Written by Nancy Pakbaz, CFA, DailyFX Research
Follow Nancy on Twitter @NancyPakbazFX
Source link
The BIG Idea: When looking to the interest rate futures market, there is an expected cut by the Federal Reserve in the US reserve rate from June 2019-June 2020. When looking to the Federal Reserve's expectations (aka educated guesses), they are looking to two cuts, which would likely be firmed on a Trade War 'truce' between the US & China. Ironically, the US Dollar is falling because the Fed is concerned the environment is turning too sour to warrant further hikes. However, an improvement in data would reignite the Fed's outlook and firm up expectations for future Fed hikes that would likely strengthen the US Dollar.
Point to Establish View: Initiation near 94-93 (H2 2018 support zone)
Spot: DXY @ 94.809
Objective 1: 98 (Fibonacci target,) > 1:1 Risk: Reward Ratio
Objective 2: 103.80 (2016 high)1:10.8 Risk: Reward Ratio
Objective 3: Hold with Trailing Stopon a close below 50-DMA or Ichimoku Cloud
Idea Invalidation Level: 92.55 (50% of 2018 range) 145-45 pip stop depending on entry
View Structure
The BIG Picture:
Chart Source: Pro Real Time with IG UK Price Feed. Created by Tyler Yell, CMT
The challenge with Elliott Wave is deciphering the correct corrective/ non-trending moves. These are seen as waves 2-4-B. These are important Because waves 1-3-5-A-C being the strongest and most aggressive moves in the direction of the trend.
Above, you'll notice that the expanded wave fourlabeled A-B-C from 2015-2018 is seen as preceding a potential wave five that could take the US Dollar to new post-2008 highs. The set-up for this trade anticipates that we're in corrective-wave 2 of wave five that could aggressively move higher if this move plays out as analyzed.
Lastly, the relationship between the corrective waves is very important. The 2009-2011 corrective wave 2 was 113 weeks or 2 years and two months. The 2015-2018 was near 1.382% (a Fibonacci relationship) the length of the 2009-2011 correction at 153 weeks.
Should we be embarking on the start of wave 3 of 5 in DXY, we could see a very strong rally that could have EUR/USD lower and USD/JPY much higher.
The big idea behind why the market would start to price in a strong US Dollar has mainly to do with the recent US Dollar weakness that began on December 14 on the market's belief that the Fed will pull way back their expected rate hikes in 2019, and may even cut to support the economy.
There is one problem with this view though. The Fed is still expecting to hike twice though Powell recently noted a needed 'patience' in understanding the data, and what it means for whether the economy can withstand more hikes.
I argue that a key factor or main reason why the economy has shifted to this view is likely transitory factors like the US-China Trade War, which if a 'truce' is obtained, could lead to the Fed reaffirming their two+ hike view in 2019.
Ironically, the weakening backdrop that has encouraged the Fed to push back their rate hike bets has aligned with an incredible bounce of the SPX500. Since the close December 24, the SPX500 has jumped 11.6%, and more could be on the way on further US Dollar weakness. The SPX500 strength can be labelled under FOMO, but the environment that it is built upon seems shakier than ever as a weaker US Dollar would likely only result from a backdrop that leads to materially weaker revenue outlooks for constituents of the index.
Put simply, I would argue that the end of the world is overstated, and when positive developments return and the Fed pricing returns to rate normalization (i.e., hikes) that the US Dollar will resume the rally it began in February.
Source: IG Client Sentiment
For EURUSD,IG Client Sentiment retail trader data shows 41.1% of traders are net-long with the ratio of traders short to long at 1.43 to 1. Please note, EUR/USD is utilized as it makes up 56.8% of the DXY, and the sentiment picture can provide deep insight to the outlook of DXY.
We typically take a contrarian view to crowd sentiment, and the fact traders are net-short suggests EURUSD prices may continue to rise. Traders are further net-short than yesterday and last week, and the combination of current sentiment and recent changes gives us a stronger EURUSD-bullish contrarian trading bias(emphasis mine.)
The reason I share this with you is that it seems to indicate that Dollar weakness could continue in the near-term. You'll notice the long entry order is below current market on the Dollar Index so IGCS appears to be showing that we could see the entry order triggered with a relatively tight stop loss relative to the expected profit targets.
DailyFX offers a surplus of helpful trading tools, indicators, and resources to help traders. For those looking for trading ideas, our IG Client Sentiment shows the positioning of retail traders with actual live trades and positions.
Our trading guides bring our DailyFX Quarterly Forecasts and our Top Trading Opportunities, and our real-time news feedhas intra-day interactions from the DailyFX team. And if you're looking for real-time analysis, our DailyFX Webinars offer numerous sessions each week in which you can see how and why we're looking at what we watch.
If you're looking for educational information, our New to FX guide is there to help new(er) traders while our Traits of Successful Traders research is built to help sharpen the skill set by focusing on risk and trade management.
---Written by Tyler Yell, CMT
Tyler Yell is a Chartered Market Technician. Tyler provides Technical analysis that is powered by fundamental factors on key markets as well as trading educational resources. Read more of Tyler's Technical reports via his bio page.
Communicate with Tyler and have your shout below by posting in the comments area. Feel free to include your market views as well.
Talk markets on twitter @ForexYell
Point to Establish View: Initiation near 94-93 (H2 2018 support zone)
Spot: DXY @ 94.809
Objective 1: 98 (Fibonacci target,) > 1:1 Risk: Reward Ratio
Objective 2: 103.80 (2016 high)1:10.8 Risk: Reward Ratio
Objective 3: Hold with Trailing Stopon a close below 50-DMA or Ichimoku Cloud
Idea Invalidation Level: 92.55 (50% of 2018 range) 145-45 pip stop depending on entry
View Structure
The BIG Picture:
Chart Source: Pro Real Time with IG UK Price Feed. Created by Tyler Yell, CMT
Technical Reasoning Behind the Trade
The labels on the DXY chart above align with Elliott Wave analysis. The purpose of Elliott Wave is to put current market moves in a context that can help you create probability weighted outcomes that can help traders anticipate opportunities and manage risk for when the outlook changes.The challenge with Elliott Wave is deciphering the correct corrective/ non-trending moves. These are seen as waves 2-4-B. These are important Because waves 1-3-5-A-C being the strongest and most aggressive moves in the direction of the trend.
Above, you'll notice that the expanded wave fourlabeled A-B-C from 2015-2018 is seen as preceding a potential wave five that could take the US Dollar to new post-2008 highs. The set-up for this trade anticipates that we're in corrective-wave 2 of wave five that could aggressively move higher if this move plays out as analyzed.
Lastly, the relationship between the corrective waves is very important. The 2009-2011 corrective wave 2 was 113 weeks or 2 years and two months. The 2015-2018 was near 1.382% (a Fibonacci relationship) the length of the 2009-2011 correction at 153 weeks.
Should we be embarking on the start of wave 3 of 5 in DXY, we could see a very strong rally that could have EUR/USD lower and USD/JPY much higher.
Fundamental Justification For Bullish DXY View
The technical justification can be summarized as saying, I think we're about to embark on the strongest part of wave 5, which began in February 2018. The fundamental justification can be summarized as believing that the market swung too aggressively in pricing out FOMC hikes and into FOMC cuts, and normalization of this extreme view may lead to USD strength.The big idea behind why the market would start to price in a strong US Dollar has mainly to do with the recent US Dollar weakness that began on December 14 on the market's belief that the Fed will pull way back their expected rate hikes in 2019, and may even cut to support the economy.
There is one problem with this view though. The Fed is still expecting to hike twice though Powell recently noted a needed 'patience' in understanding the data, and what it means for whether the economy can withstand more hikes.
I argue that a key factor or main reason why the economy has shifted to this view is likely transitory factors like the US-China Trade War, which if a 'truce' is obtained, could lead to the Fed reaffirming their two+ hike view in 2019.
Ironically, the weakening backdrop that has encouraged the Fed to push back their rate hike bets has aligned with an incredible bounce of the SPX500. Since the close December 24, the SPX500 has jumped 11.6%, and more could be on the way on further US Dollar weakness. The SPX500 strength can be labelled under FOMO, but the environment that it is built upon seems shakier than ever as a weaker US Dollar would likely only result from a backdrop that leads to materially weaker revenue outlooks for constituents of the index.
Put simply, I would argue that the end of the world is overstated, and when positive developments return and the Fed pricing returns to rate normalization (i.e., hikes) that the US Dollar will resume the rally it began in February.
What is IG Client Sentiment Saying?
Source: IG Client Sentiment
For EURUSD,IG Client Sentiment retail trader data shows 41.1% of traders are net-long with the ratio of traders short to long at 1.43 to 1. Please note, EUR/USD is utilized as it makes up 56.8% of the DXY, and the sentiment picture can provide deep insight to the outlook of DXY.
We typically take a contrarian view to crowd sentiment, and the fact traders are net-short suggests EURUSD prices may continue to rise. Traders are further net-short than yesterday and last week, and the combination of current sentiment and recent changes gives us a stronger EURUSD-bullish contrarian trading bias(emphasis mine.)
The reason I share this with you is that it seems to indicate that Dollar weakness could continue in the near-term. You'll notice the long entry order is below current market on the Dollar Index so IGCS appears to be showing that we could see the entry order triggered with a relatively tight stop loss relative to the expected profit targets.
FOREX TRADING RESOURCES TO SUPPORT YOUR STRATEGY
We hope you enjoy DailyFX's new podcast: Trading Global Markets DecodedDailyFX offers a surplus of helpful trading tools, indicators, and resources to help traders. For those looking for trading ideas, our IG Client Sentiment shows the positioning of retail traders with actual live trades and positions.
Our trading guides bring our DailyFX Quarterly Forecasts and our Top Trading Opportunities, and our real-time news feedhas intra-day interactions from the DailyFX team. And if you're looking for real-time analysis, our DailyFX Webinars offer numerous sessions each week in which you can see how and why we're looking at what we watch.
If you're looking for educational information, our New to FX guide is there to help new(er) traders while our Traits of Successful Traders research is built to help sharpen the skill set by focusing on risk and trade management.
---Written by Tyler Yell, CMT
Tyler Yell is a Chartered Market Technician. Tyler provides Technical analysis that is powered by fundamental factors on key markets as well as trading educational resources. Read more of Tyler's Technical reports via his bio page.
Communicate with Tyler and have your shout below by posting in the comments area. Feel free to include your market views as well.
Talk markets on twitter @ForexYell
Source link
- Improved Risk Sentiment Provides Support
- Brent Crude Technical Analysis
Improved Risk Sentiment Provides Support
While yesterday's jawboning from OPEC continues to keep the oil complex bid. The improvement in the global risk tone has also provided a lift for Brent crude futures. Overnight, government shutdown fears had abated slightly after reports suggested that President Trump may reluctantly accept the bi-partisan agreement thus avoiding another government shutdown. On the Trade front, sentiment has picked up following news that President Xi were to meet with the Trump administration later this week, while President Trump has also hinted that the US could extend the March 1st deadline, provided that an agreement could be reached in the near-term, consequently reducing investor angst that trade tensions will escalate.
Brent Crude Technical Analysis
Brent crude futures continue to track higher with bulls eying a break above the 2019 peak ($63.63/bbl). A closing break above could see Brent make a test of the $64 handle in the near-term. As reminder, yesterday's API crude inventory data showed a surprise drawdown of 998kbbls, as such, confirmation by today's DoE data with a larger drawdown could see Brent at $64.
BRENT CRUDE PRICE CHART: Daily Time Frame (Oct 2018 – Feb 2019)

Oil Impact on FX
Net Oil Importers: These countries tend to be worse off when the price of oil rises. This includes, KRW, ZAR, INR, TRY, EUR, CNY, IDR, JPY
Net Oil Exporters: These counties tend to benefit when the price of oil rises. This includes RUB, CAD, MXN, NOK.
Recommended Reading
What Traders Need to Know When Trading the Oil MarketImportant Difference Between WTI and Brent
--- Written by Justin McQueen, Market Analyst
To contact Justin, email him at Justin.mcqueen@ig.com
Follow Justin on Twitter @JMcQueenFX
Source link
No longer interested email from Forex News 24?. Please click here to unsubscribe