
Dow Jones, Nasdaq, Dax 30 Elliott Wave Analysis Talking Points
- Dow Jones Industrial Average holds above Elliott Wave channel
- Nasdaq bearish reversal at Elliott Wave channel
- Dax 30 is the weakest as it could not reach Elliott Wave channel midline
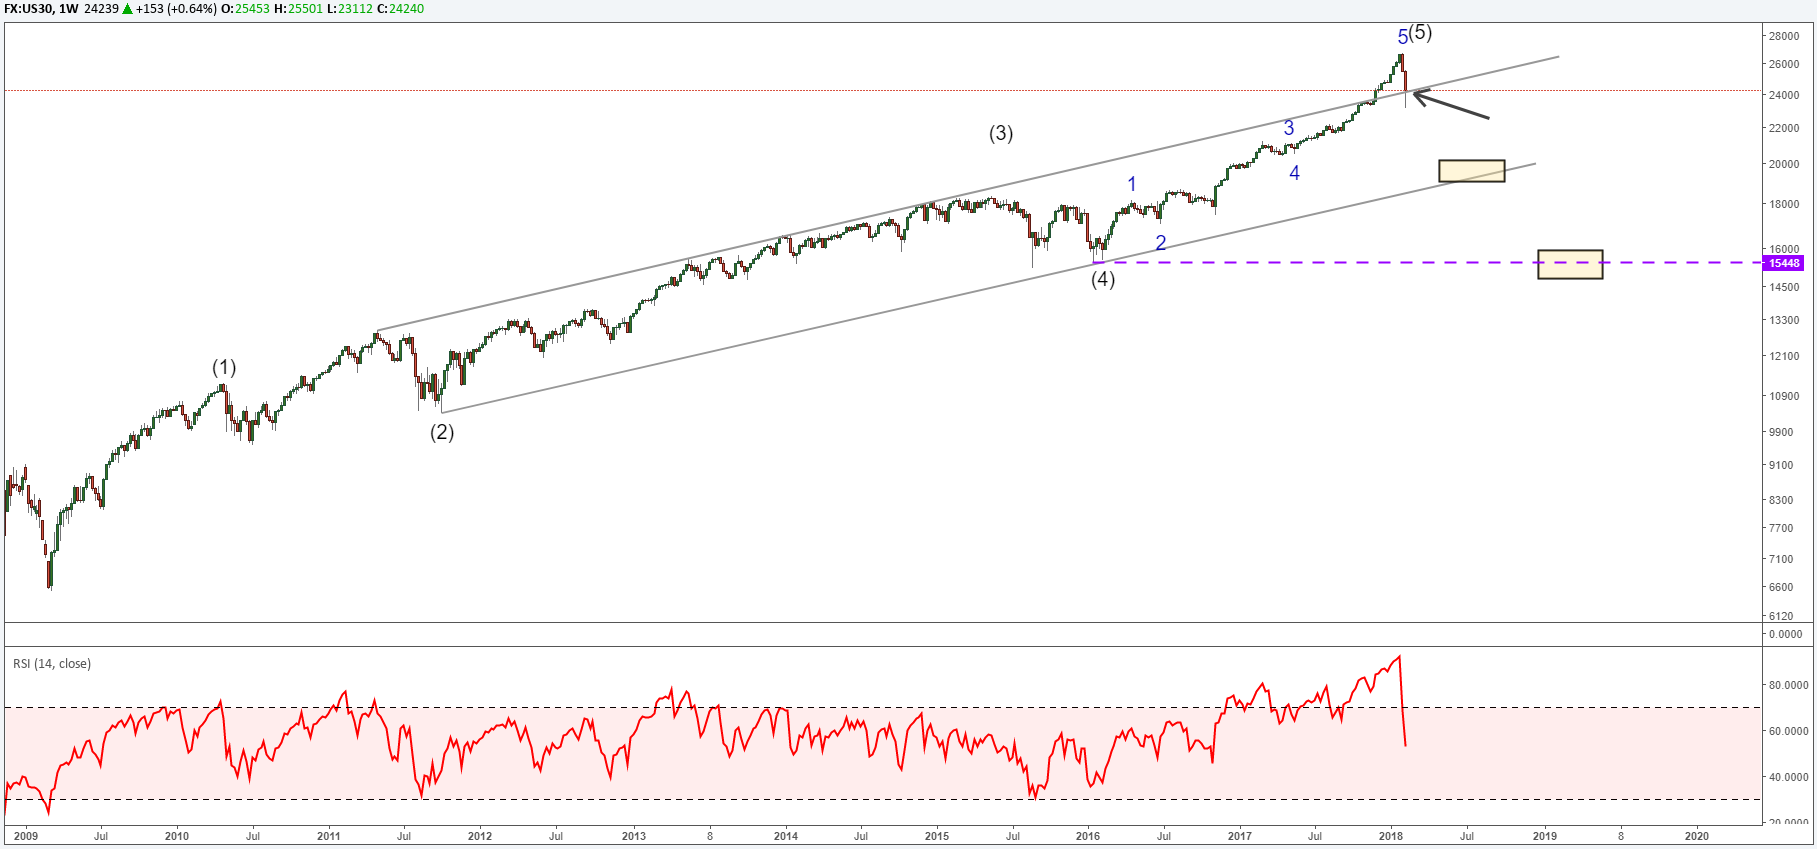
Dow Jones Industrial Average Sticks on Top of Elliott Wave Channel
Many times Elliott Wave impulses form a price channel by connecting the extremes of waves 2 and 4 and projecting it over wave 3. Dow Jones Industrial Average has rallied past the upper channel line in a blow off top. Returning inside the Elliott Wave channel can be a signal that the rally is over. Dow Jones Industrial Average is hovering near the channel line so continued weakness in the market may confirm the top is in.If DJIA is successful in returning inside the Elliott Wave channel, then the next level of support enters the picture near the lower channel boundary near 20,000. If this area fails to contain DJIA, then the next level of support is near the fourth wave extreme at 15,500.
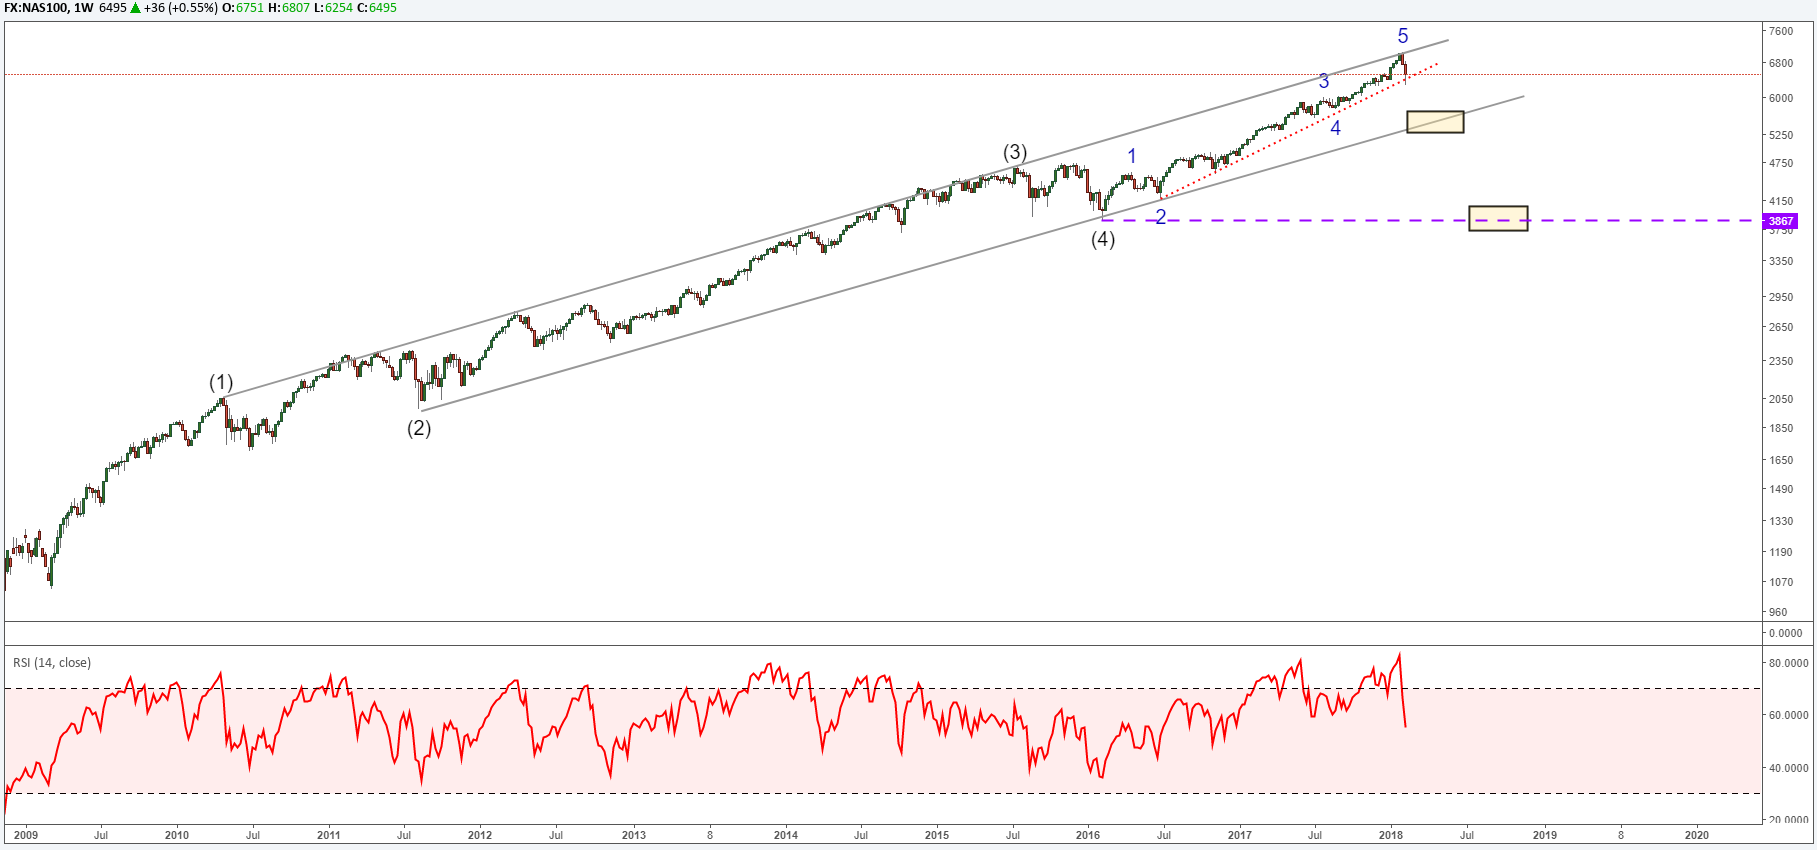
Nasdaq Reverses at Elliott Wave Channel High and Targets 5300
As discussed above, the Elliott Wave channel can offer target zones within an impulse wave. Nasdaq has rallied since 2009 in a five-wave impulse reaching the upper channel line. There is a small internal support trend line Nasdaq is trying to pierce. If it is successful, then continued weakness is anticipated to lower channel support near 5300.
If Nasdaq cannot find support at the lower channel line, then we will look for continued weakness to the fourth wave extreme near 3900.
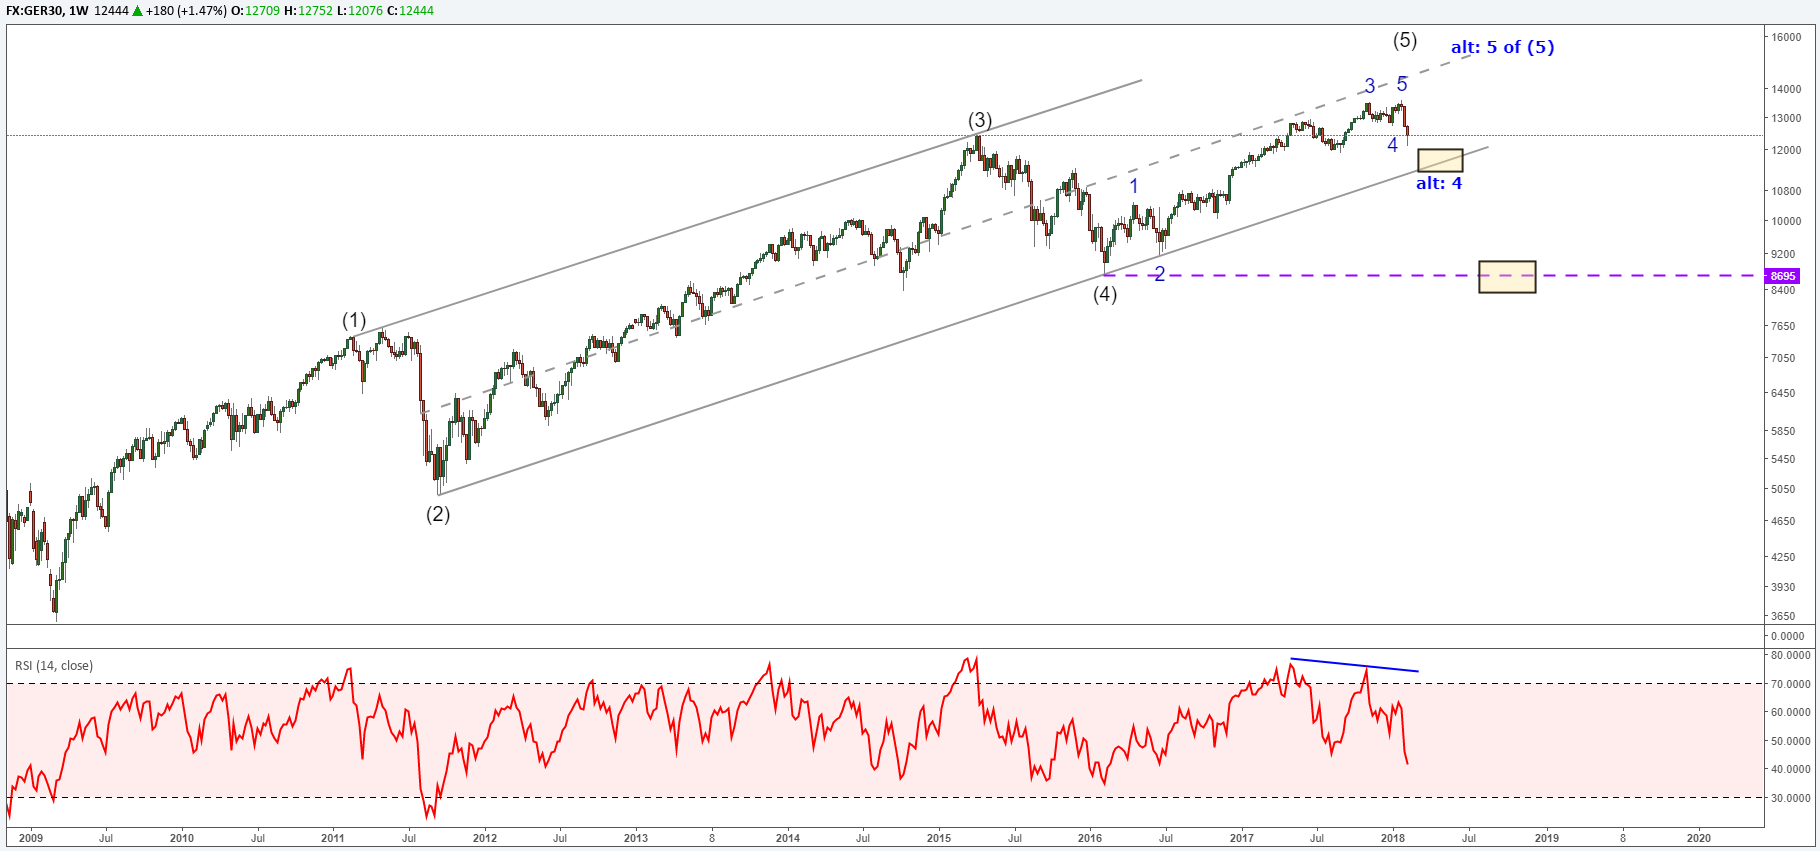
Dax 30 Cannot Reach Its Elliott Wave Channel Midline
Notice the difference in Dax 30 relative to Dow Jones Industrial Average or Nasdaq. Dax 30 could not rally to the grey dotted line that represents the midline of the Elliott Wave channel. This is indicative of a very weak market.The lower channel line may provide temporary support near 11,500. If Dax 30 is able to rally to new highs from this level, then we can count it simply as a wave 4 (the alternate shown on the chart). If Dax 30 breaks outside of the Elliott Wave channel below 11,500, then we will look at the fourth wave extreme near 8700 as the next level of support.
The bottom line for all three markets noted above is that absent an immediate print to new highs, this bearish sequence appears incomplete and trade make take place to lower levels in the coming weeks.
Elliott Wave FAQs
What is Elliott Wave Theory?Elliott Wave Theory is a trading study that identifies the highs and lows of price movements on charts via wave patterns. Traders often analyze the 5-wave impulse sequence and 3-wave corrective sequence to help them trade strategically. We cover these wave sequences in our beginners and advanced Elliott Wave trading guides.
I hear that many traders struggle with profitability, why?
Regardless of the style of analysis, many traders do lose money because they do not take the time to study the market and the effect of leverage. At DailyFX, we have studied millions of live trades and boiled our study down into a Traits of Successful Traders guide. You will find how leverage and human nature affects our trading so you can be better prepared for the next correction.
Elliott Wave Theory can be applied to a variety of highly liquid markets. FX is one of my favorite markets to apply the Elliott Wave principle. Learn more about trading FX with this guide specifically designed for you.
---Written by Jeremy Wagner, CEWA-M
Jeremy is a Certified Elliott Wave Analyst with a Master's designation. These articles are designed to illustrate Elliott Wave applied to the current market environment.
Communicate with Jeremy and have your shout below by posting in the comments area. Feel free to include your Elliott Wave count as well.
Discuss this market with Jeremy in Monday's US Opening Bell webinar.
Follow on twitter @JWagnerFXTrader .
Source link
Markets Talking Points:
- Crude oil will start the week with a traditional breakout tapping into more significant themes than just a technical groundswell
- EURUSD is a prime candidate of frustrating range, but any progress it finds will be a strong barometer on global fundamental issues
- As risk appetite seems to stretch its legs once again, focus on leverage calls attention to the explosion of government debt
See how retail traders are positioning in US Crude Oil, EURUSD, FX majors, indices, commodities and cryptocurrency on an intraday basis using theDailyFX speculative positioning data on the sentiment page.
There are a range of impressive charts shaping up across the financial system. The S&P 500 and Dow are continuing their climb back towards the record highs set in October. Gold has rallied despite the positive sentiment lean and firm Dollar. And I made my case recently for USDCHF as a large wedge that still has considerable room for the Dollar to rally should it find an unexpected charge. Yet, as impressive as these pictures are, they are not my top three charts to watch moving forward.
1 Crude Oil Sports a Head-and-Shoulders Break and Connect to Critical Themes
Perhaps one of the most technically-loaded charts among the markets I regularly keep track of comes from the benchmark US crude oil contract, WTI. It is difficult to miss the very large inverse head-and-shoulders pattern the commodity has carved out over the past few months. In such patterns, the lead in to the congestion is as important as the supposed reversal structure itself. Here, we have the incredible slide between October and December to reflect the wind up. Therefore, the break above the supposed 'neckline' that falls at the convergence of a multi-week trendline of highs and the 38.2% Fibonacci retracement of the aforementioned tumble is no small development. That said, there is a vast difference between a break and a trend. Follow through often requires more motivation than just a simple technical trigger, and therein rests the true success or failure of this move. It won't be headlines on production from OPEC or important non-OPEC members, nor US inventory updates that facilitate a trend of this scale. True risk appetite and the related conviction in global growth are the deep themes that would shrug off the restraints on this market.
Chart of US Oil (Daily)
2 EURUSD's Range Signals More than Just Frustration for Trend-Starved Traders
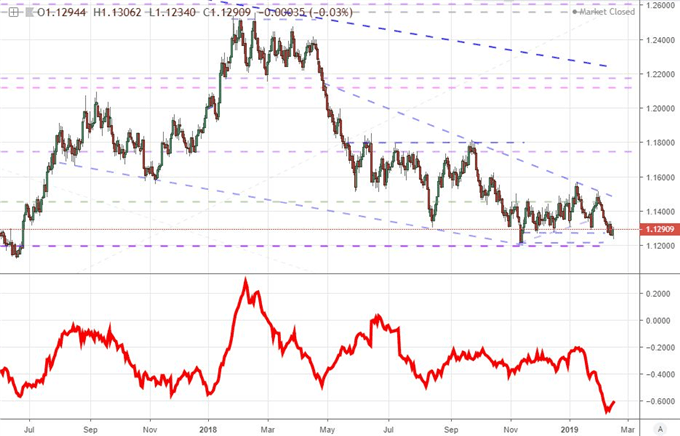
The second chart on my list is the EURUSD's progress. Here, there is a very different perspective than what we see in crude. Whereas the commodity is on the cusp of a significant technical transition, this benchmark pair is still comfortably within its range. In fact, the 20-day ATR (Average True Range) on this pair has dropped to its lowest level since the Summer of 2014 - a period that haunts FX traders for how extreme it was. This restriction to a 1.1550 to 1.1200 span belies the laundry list of critical fundamental themes that are all converging on the pair. Relative monetary policy and rate forecasts is critical and unresolved. Risk trends are a related concern which does not find an overt return and haven currency in the pairing - despite a clear yield differential. Growth considerations, political unbalance and the risk of aggressive trade policy adoption (a trade war could be provoked between the US and Eurozone should auto tariffs be pursued) are all critically important yet lost in the deluge. This mix is so remarkable, that when it does clear; it must be developing under remarkable circumstances. In other words, if you want to know what critical fundamental theme is prevailing for the broader financial system, keep tabs on EURUSD.
Chart of EURUSD and the 20-day ATR (Daily)
3 A Swell in US Federal Debt May Prove the Next 'Monetary Policy' or 'Trade War' Theme
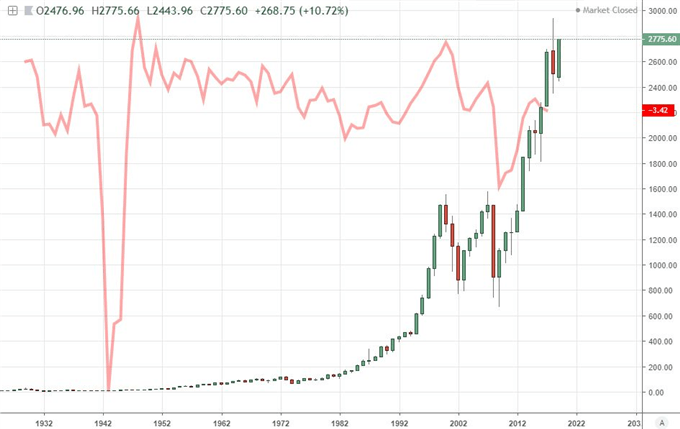
This is where I may lose people looking for a quick turn or charge in a specific asset, but this chart's importance is far more significant for the long-term. The US is facing an unprecedented $22 trillion debt and a deficit that is expected to charge to levels that should make us more conscious of budgets. The US is projected to run a 4.6% deficit-to-GDP ratio this year - the highest in a non-recession year on record. This spending meant to amplify growth, but it has thus far done little to boost the restricted pace of a US economy that is conforming to wavering experienced across the globe. The real issue comes should capital markets start to implode and/or the economy stalls in spite of the government's support. Then what capacity is there to fight a serious problem? The same risk exists with the state of global monetary policy. There is great capacity for this otherwise 'boring' issue to fuel an unrelenting crisis. It could become as ubiquitous a fundamental talking point among investors as trade wars, monetary policy and financial leverage have been at different times over the past two decades.
Chart of the S&P 500 and US Federal Deficit as Ratio of GDP in Red (Annually)
Source link
Long USDCAD – 1.3190
IG Client Sentiment Datashows how retail investors are positioned in a range of currencies and asset markets.
Traders may be interested in two of our trading guides – Traits of Successful Traders and Top Trading Lessons – while technical analysts are likely to be interested in our latest Elliott Wave Guide.
What is your view on USDCAD – bullish or bearish?? You can let us know via the form at the end of this piece or you can contact the author at nicholas.cawley@ig.comor via Twitter @nickcawley1.
Source link
Stop Loss – 1.3100
Target 1 (50%) – 1.3330
Target 2 (50%) – 1.3390
USDCAD Oversold and Looking for a Short-Term Bounce
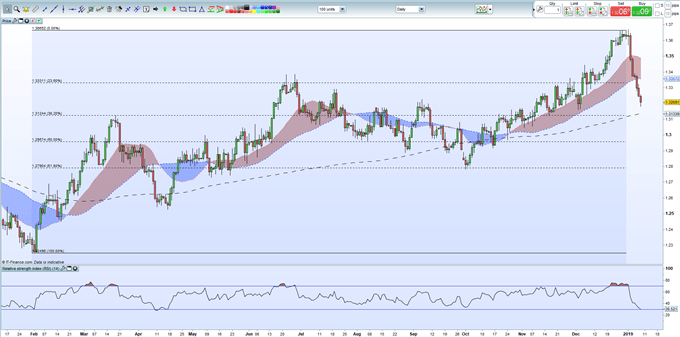
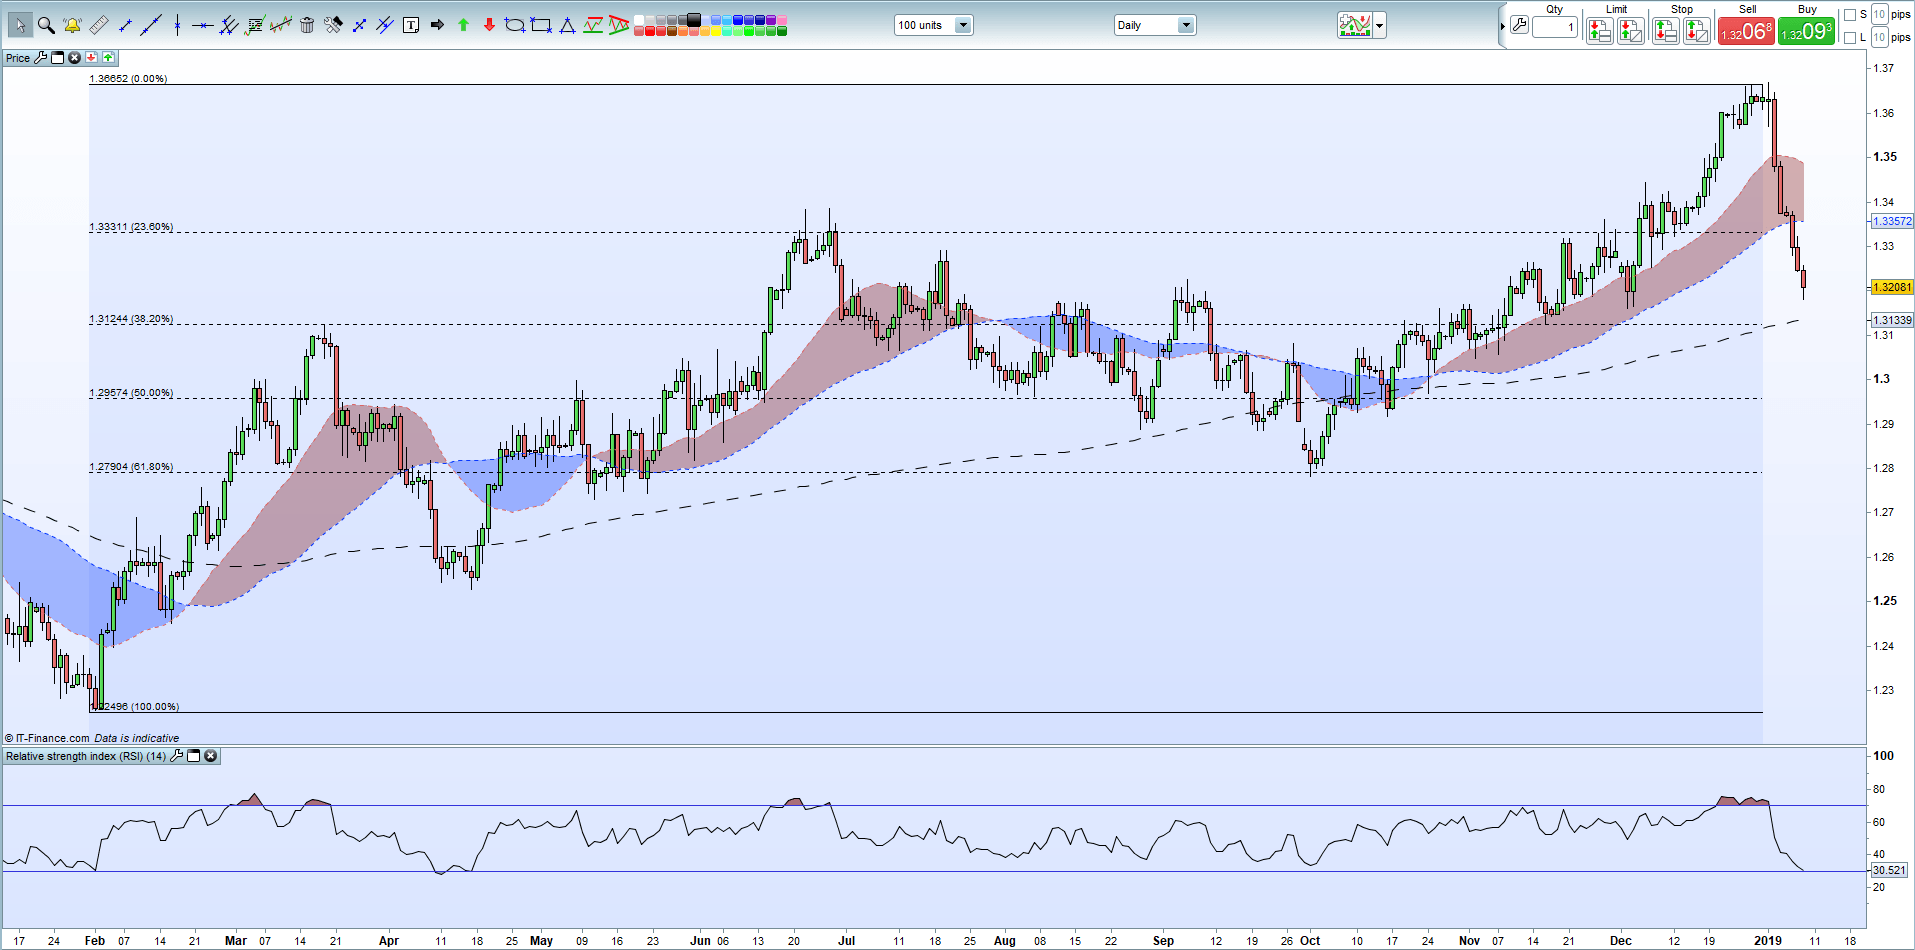
We look to go long USDCAD for a quick trade with a time frame of one day to one week. The near five point drop this year has sent the pair into oversold territory -the RSI indicator at the bottom of the chart - and heading towards the 200-day moving average (1.3135) for the first time since late-October 2018. Just below here, 38.2% Fibonacci retracement at 1.3124 adds further support.
To the upside, the 23.6% Fibonacci retracement at 1.3330 is our first target (50%) before the bottom of the 20- and 50-day cloud at 1.3360 (50%).
From a fundamental stance, the Canadian dollar is reaping the benefit of expected monetary tightening in 2019, although the market is only pricing in around 11bps of rate hikes this year – roughly 50% chance of a 25bp hike – while over in the US rate a 25bp rate hike is expected but not until mid-year, or when/if data allows.
A high risk trade which should be approached as such – i.e.. small size and a tight, guaranteed stop.
USDCAD Daily Price Chart (January 2018 – January 9, 2018)
IG Client Sentiment Datashows how retail investors are positioned in a range of currencies and asset markets.
Traders may be interested in two of our trading guides – Traits of Successful Traders and Top Trading Lessons – while technical analysts are likely to be interested in our latest Elliott Wave Guide.
What is your view on USDCAD – bullish or bearish?? You can let us know via the form at the end of this piece or you can contact the author at nicholas.cawley@ig.comor via Twitter @nickcawley1.
EURUSD Price, Analysis and Chart:
- Euro-Zone growth will likely remain weak.
- EURUSD technical set-up remains flat-to-negative.
EURUSD Bounce Fueled by US Dollar Slippage
After touching a low just above 1.1255 on Tuesday, the lowest level since mid-November, EURUSD has rallied back to around 1.1320, making a third higher high in a row. The pair are currently being moved around by the US dollar, although EU and German data on Thursday will likely take over the wheel and steer the pair going into the end of the week.
German q/q GDP is released early Thursday morning and is expected to show growth of a miserly 0.1% in Q4, although some in the market are speculating that the reading may be flat for the quarter. German Q3 GDP rocked the market at -0.2% and 2019 German growth is now expected to be just 1%, down from expectations around 1.7% late last year. A slowing global economy, ongoing gloom in the auto industry and fears that a hard Brexit will impact German exporters hard have all added to the slowdown and will likely remain so over the coming months.
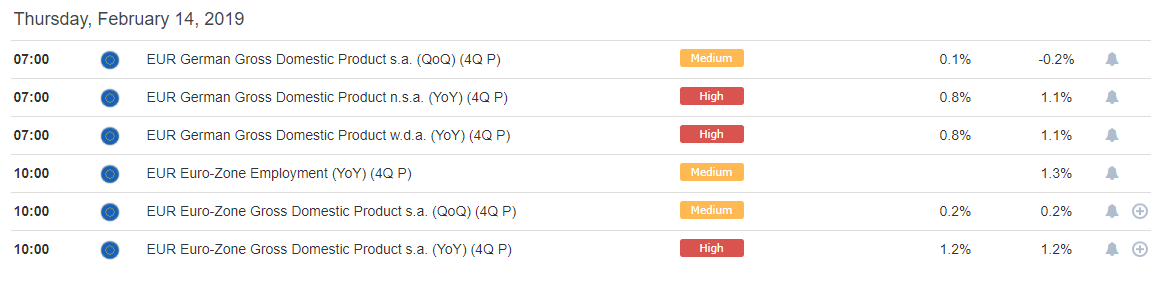
DailyFX Calendar
IG Client Sentiment data currently shows retail are 70.4% net-long EURUSD, a bearish contrarian indicator. However, the combination of current sentiment and recent changes gives us a mixed EURUSD trading bias.
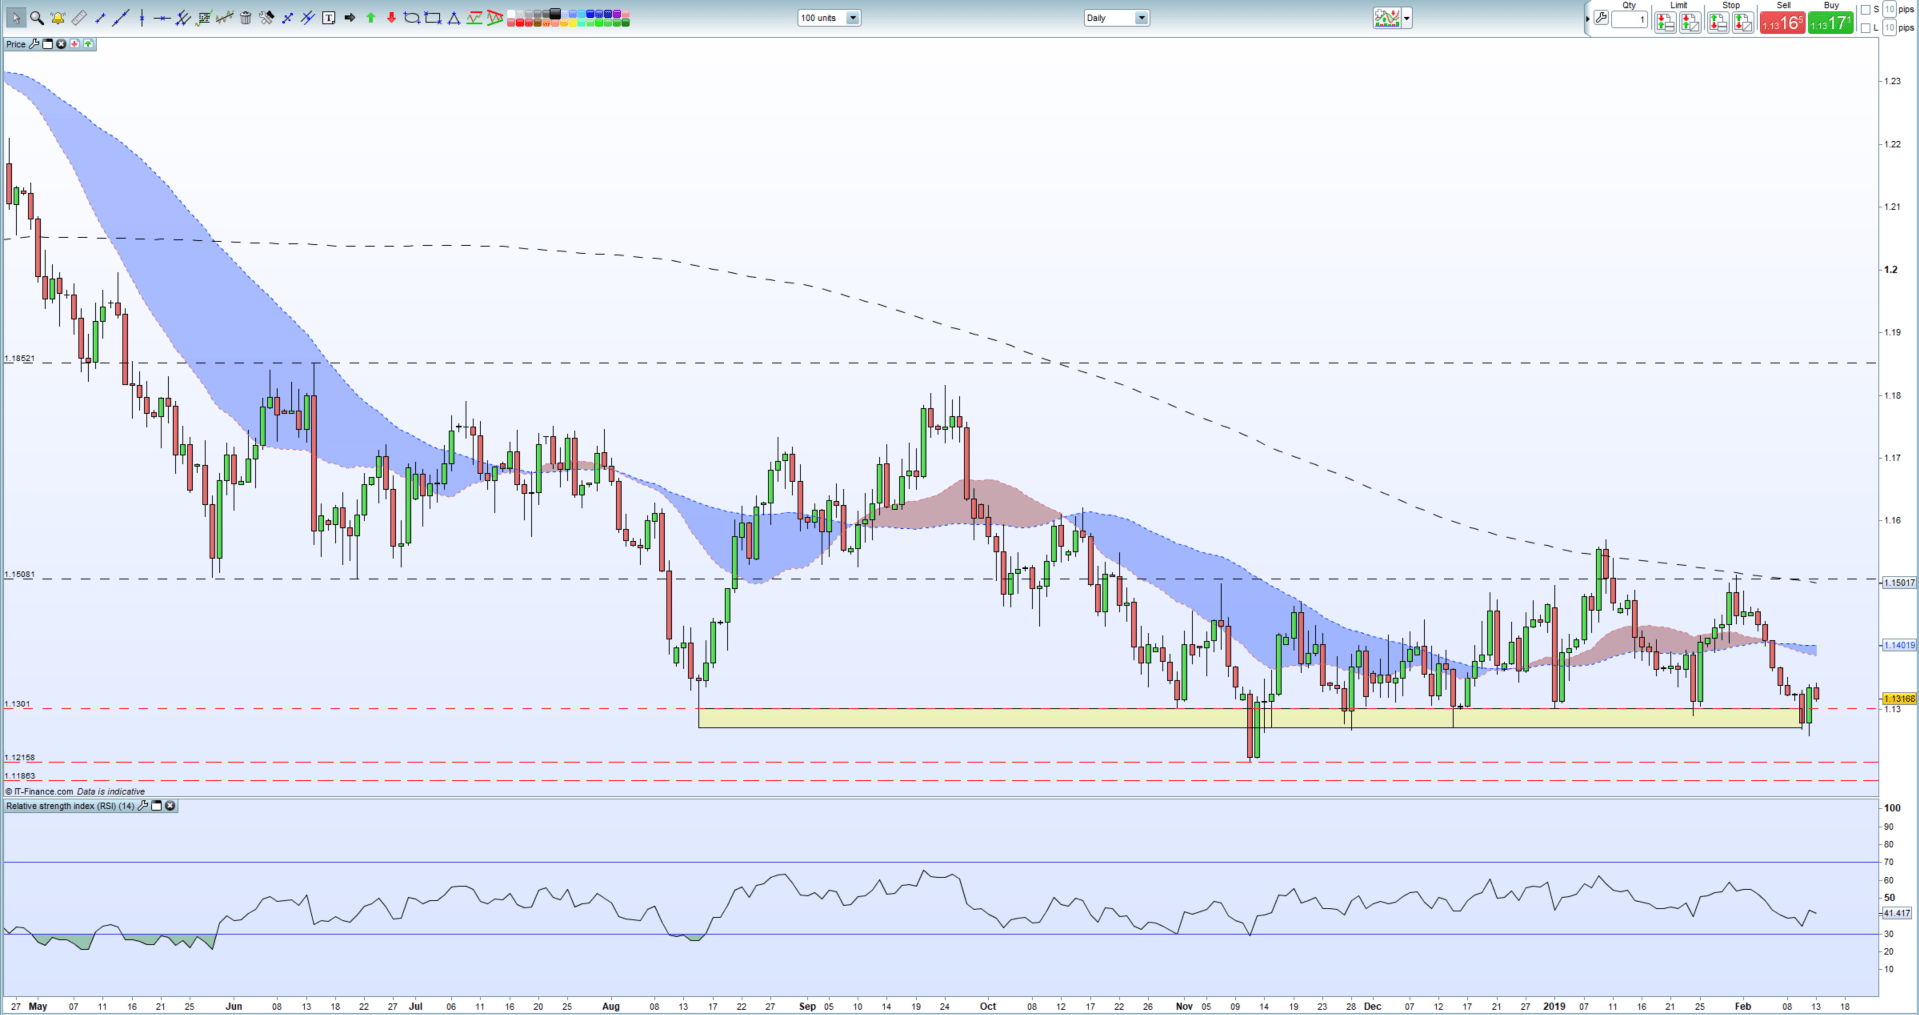
EURUSD remains negative overall, trading well below all three moving averages and just above the 1.1300 area that seems to currently be stemming further losses. If we break and close below 1.1215, a level last seen in June 2017, further losses are likely. Option expires at 1.1350/5 and 1.1375 may also cap upside movement in the short-term. One caveat – the 1.1300 barrier continues to produce reversals with talk that central banks are active around this level. However, a resurgent US dollar and weak data on Thursday may test these buyers resolve and finally see the single currency break lower.
Foundations of Technical Analysis: A Step-by-Step Trade Walk-Through. EURUSD Daily Price Chart (May 2018 – February 13, 2019)
Traders may be interested in two of our trading guides – Traits of Successful Traders and Top Trading Lessons – while technical analysts are likely to be interested in our latest Elliott Wave Guide.
What is your view on EURUSD – bullish or bearish?? You can let us know via the form at the end of this piece or you can contact the author at nicholas.cawley@ig.comor via Twitter @nickcawley1.

Chart Prepared by Jamie Saettele, CMT
DailyFX Trading Guides and Forecasts
Real Time Positioning
-"I'm positive on crude as long as the trendline holds. Now that's a hold! Lows from January and February stretch from 50.69 to 51.25. The upper end of this range looks like the 'best' level for resistance (trendline intersection)." Crude is a few ticks from the upper end of the noted range. As such, respect potential for a pause in the move higher but the broader constructive outlook remains.
Source link
Weekly
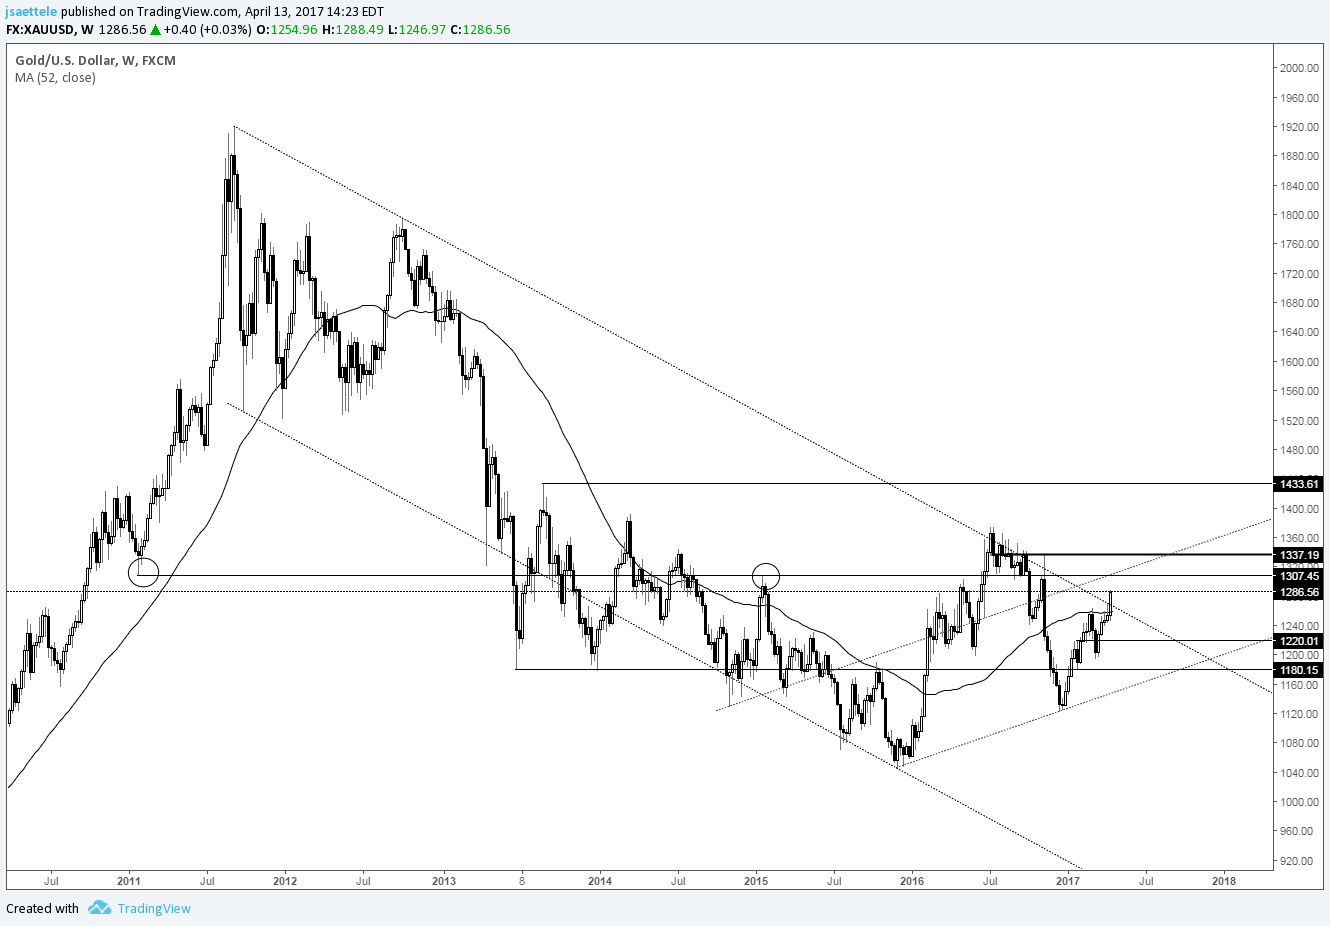
Chart Prepared by Jamie Saettele, CMT
DailyFX Trading Guides and Forecasts
Real Time Positioning
-Tomorrow's close for gold is important as a close above the 2011-2012 trendline would be the strongest indication yet of a major trend change. 1307 (big low in 2011 and high in December 2014) lines up as a level to pay attention to from a tactical standpoint.
Recent changes in sentiment warn that the current US 500 price trend may soon reverse lower despite the fact traders remain net-short.
Source link
Source link
The BIG Idea: When looking to the interest rate futures market, there is an expected cut by the Federal Reserve in the US reserve rate from June 2019-June 2020. When looking to the Federal Reserve's expectations (aka educated guesses), they are looking to two cuts, which would likely be firmed on a Trade War 'truce' between the US & China. Ironically, the US Dollar is falling because the Fed is concerned the environment is turning too sour to warrant further hikes. However, an improvement in data would reignite the Fed's outlook and firm up expectations for future Fed hikes that would likely strengthen the US Dollar.
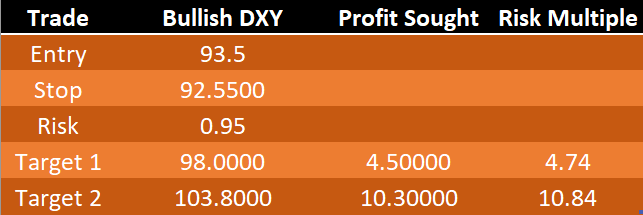
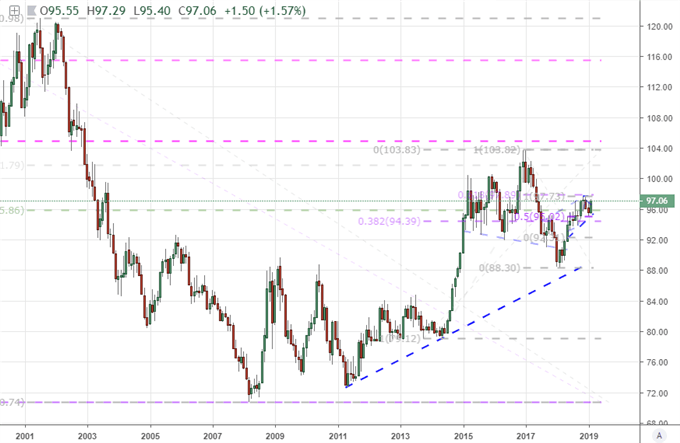
Point to Establish View: Initiation near 94-93 (H2 2018 support zone)
Spot: DXY @ 94.809
Objective 1: 98 (Fibonacci target,) > 1:1 Risk: Reward Ratio
Objective 2: 103.80 (2016 high)1:10.8 Risk: Reward Ratio
Objective 3: Hold with Trailing Stopon a close below 50-DMA or Ichimoku Cloud
Idea Invalidation Level: 92.55 (50% of 2018 range) 145-45 pip stop depending on entry
View Structure
The BIG Picture:
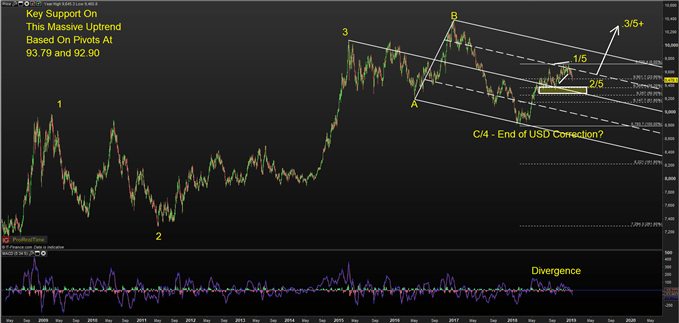
Chart Source: Pro Real Time with IG UK Price Feed. Created by Tyler Yell, CMT
The challenge with Elliott Wave is deciphering the correct corrective/ non-trending moves. These are seen as waves 2-4-B. These are important Because waves 1-3-5-A-C being the strongest and most aggressive moves in the direction of the trend.
Above, you'll notice that the expanded wave fourlabeled A-B-C from 2015-2018 is seen as preceding a potential wave five that could take the US Dollar to new post-2008 highs. The set-up for this trade anticipates that we're in corrective-wave 2 of wave five that could aggressively move higher if this move plays out as analyzed.
Lastly, the relationship between the corrective waves is very important. The 2009-2011 corrective wave 2 was 113 weeks or 2 years and two months. The 2015-2018 was near 1.382% (a Fibonacci relationship) the length of the 2009-2011 correction at 153 weeks.
Should we be embarking on the start of wave 3 of 5 in DXY, we could see a very strong rally that could have EUR/USD lower and USD/JPY much higher.
The big idea behind why the market would start to price in a strong US Dollar has mainly to do with the recent US Dollar weakness that began on December 14 on the market's belief that the Fed will pull way back their expected rate hikes in 2019, and may even cut to support the economy.
There is one problem with this view though. The Fed is still expecting to hike twice though Powell recently noted a needed 'patience' in understanding the data, and what it means for whether the economy can withstand more hikes.
I argue that a key factor or main reason why the economy has shifted to this view is likely transitory factors like the US-China Trade War, which if a 'truce' is obtained, could lead to the Fed reaffirming their two+ hike view in 2019.
Ironically, the weakening backdrop that has encouraged the Fed to push back their rate hike bets has aligned with an incredible bounce of the SPX500. Since the close December 24, the SPX500 has jumped 11.6%, and more could be on the way on further US Dollar weakness. The SPX500 strength can be labelled under FOMO, but the environment that it is built upon seems shakier than ever as a weaker US Dollar would likely only result from a backdrop that leads to materially weaker revenue outlooks for constituents of the index.
Put simply, I would argue that the end of the world is overstated, and when positive developments return and the Fed pricing returns to rate normalization (i.e., hikes) that the US Dollar will resume the rally it began in February.
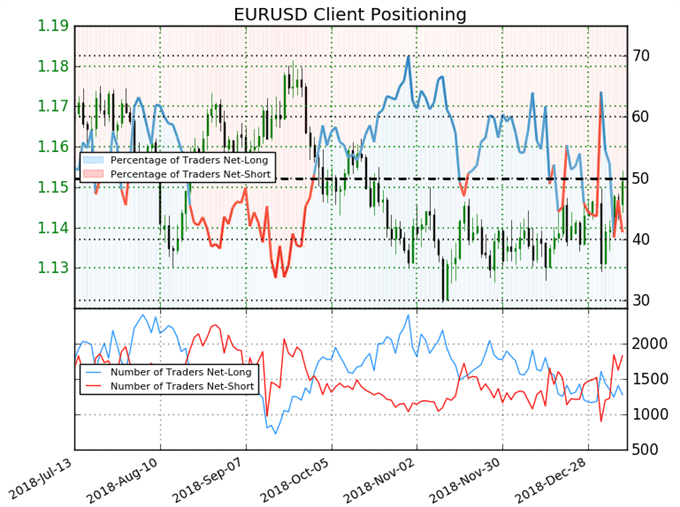
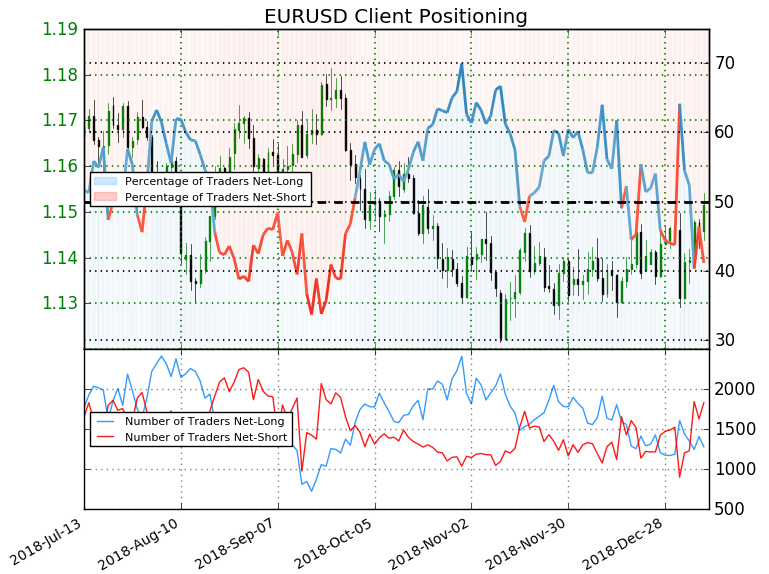
Source: IG Client Sentiment
For EURUSD,IG Client Sentiment retail trader data shows 41.1% of traders are net-long with the ratio of traders short to long at 1.43 to 1. Please note, EUR/USD is utilized as it makes up 56.8% of the DXY, and the sentiment picture can provide deep insight to the outlook of DXY.
We typically take a contrarian view to crowd sentiment, and the fact traders are net-short suggests EURUSD prices may continue to rise. Traders are further net-short than yesterday and last week, and the combination of current sentiment and recent changes gives us a stronger EURUSD-bullish contrarian trading bias(emphasis mine.)
The reason I share this with you is that it seems to indicate that Dollar weakness could continue in the near-term. You'll notice the long entry order is below current market on the Dollar Index so IGCS appears to be showing that we could see the entry order triggered with a relatively tight stop loss relative to the expected profit targets.
DailyFX offers a surplus of helpful trading tools, indicators, and resources to help traders. For those looking for trading ideas, our IG Client Sentiment shows the positioning of retail traders with actual live trades and positions.
Our trading guides bring our DailyFX Quarterly Forecasts and our Top Trading Opportunities, and our real-time news feedhas intra-day interactions from the DailyFX team. And if you're looking for real-time analysis, our DailyFX Webinars offer numerous sessions each week in which you can see how and why we're looking at what we watch.
If you're looking for educational information, our New to FX guide is there to help new(er) traders while our Traits of Successful Traders research is built to help sharpen the skill set by focusing on risk and trade management.
---Written by Tyler Yell, CMT
Tyler Yell is a Chartered Market Technician. Tyler provides Technical analysis that is powered by fundamental factors on key markets as well as trading educational resources. Read more of Tyler's Technical reports via his bio page.
Communicate with Tyler and have your shout below by posting in the comments area. Feel free to include your market views as well.
Talk markets on twitter @ForexYell
Point to Establish View: Initiation near 94-93 (H2 2018 support zone)
Spot: DXY @ 94.809
Objective 1: 98 (Fibonacci target,) > 1:1 Risk: Reward Ratio
Objective 2: 103.80 (2016 high)1:10.8 Risk: Reward Ratio
Objective 3: Hold with Trailing Stopon a close below 50-DMA or Ichimoku Cloud
Idea Invalidation Level: 92.55 (50% of 2018 range) 145-45 pip stop depending on entry
View Structure
The BIG Picture:
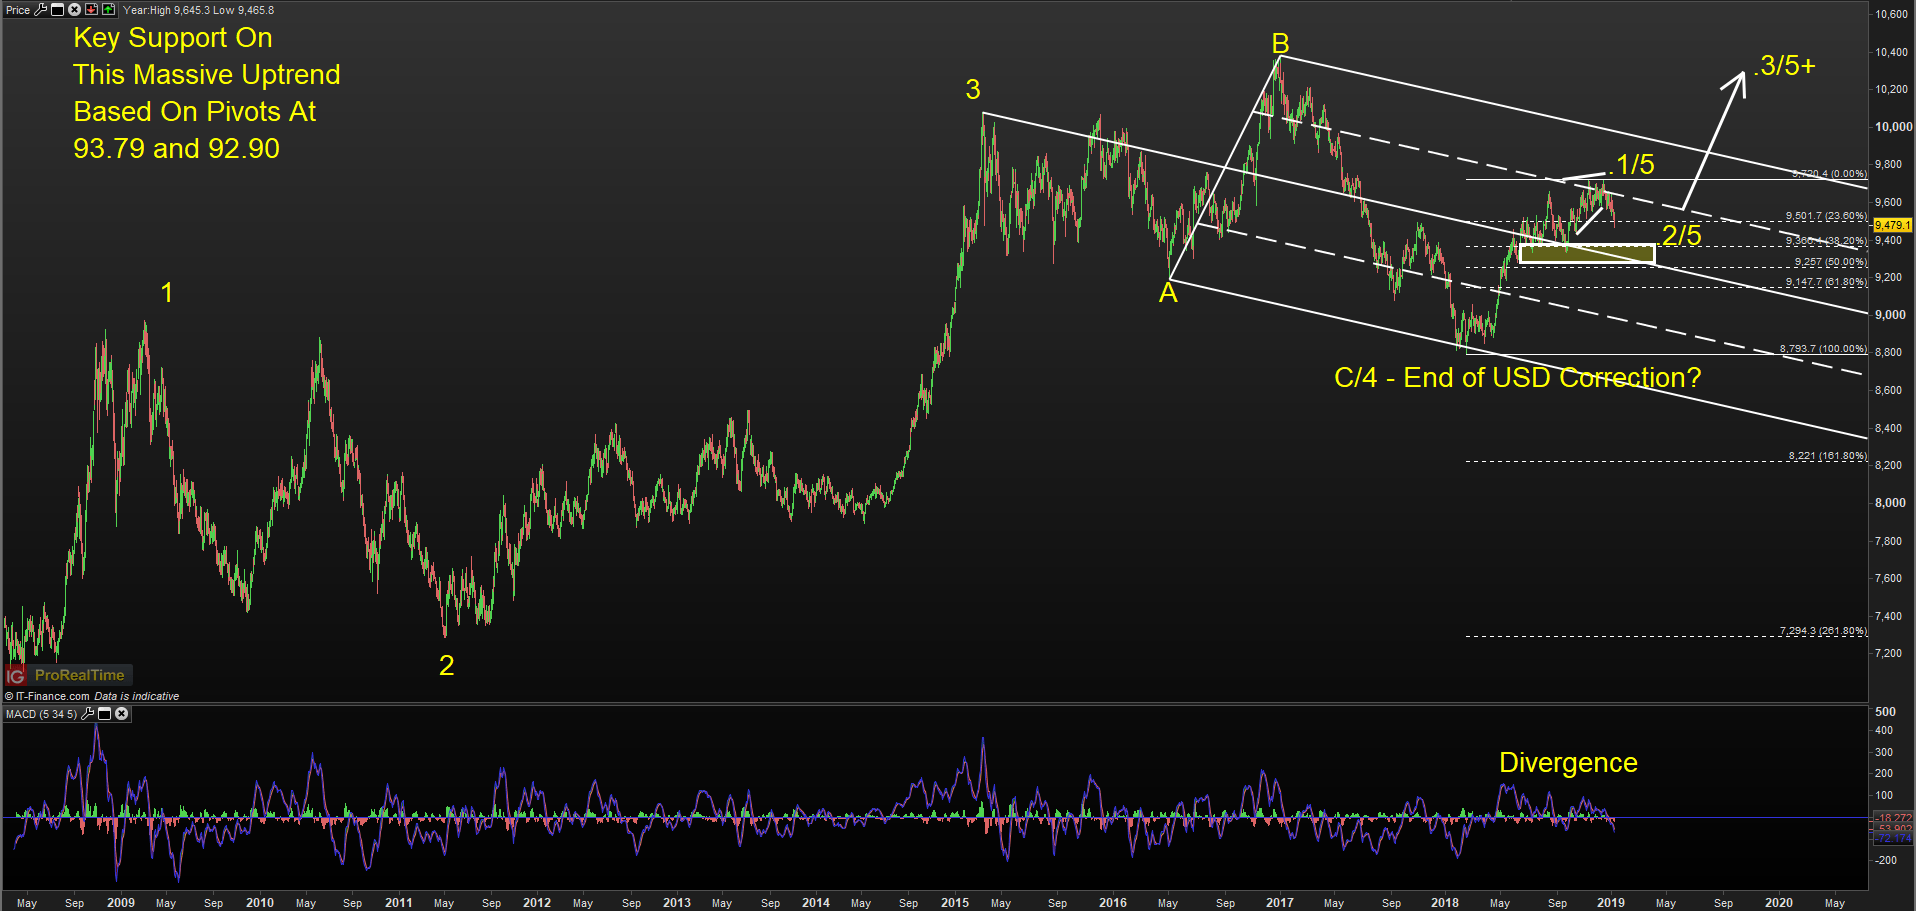
Chart Source: Pro Real Time with IG UK Price Feed. Created by Tyler Yell, CMT
Technical Reasoning Behind the Trade
The labels on the DXY chart above align with Elliott Wave analysis. The purpose of Elliott Wave is to put current market moves in a context that can help you create probability weighted outcomes that can help traders anticipate opportunities and manage risk for when the outlook changes.The challenge with Elliott Wave is deciphering the correct corrective/ non-trending moves. These are seen as waves 2-4-B. These are important Because waves 1-3-5-A-C being the strongest and most aggressive moves in the direction of the trend.
Above, you'll notice that the expanded wave fourlabeled A-B-C from 2015-2018 is seen as preceding a potential wave five that could take the US Dollar to new post-2008 highs. The set-up for this trade anticipates that we're in corrective-wave 2 of wave five that could aggressively move higher if this move plays out as analyzed.
Lastly, the relationship between the corrective waves is very important. The 2009-2011 corrective wave 2 was 113 weeks or 2 years and two months. The 2015-2018 was near 1.382% (a Fibonacci relationship) the length of the 2009-2011 correction at 153 weeks.
Should we be embarking on the start of wave 3 of 5 in DXY, we could see a very strong rally that could have EUR/USD lower and USD/JPY much higher.
Fundamental Justification For Bullish DXY View
The technical justification can be summarized as saying, I think we're about to embark on the strongest part of wave 5, which began in February 2018. The fundamental justification can be summarized as believing that the market swung too aggressively in pricing out FOMC hikes and into FOMC cuts, and normalization of this extreme view may lead to USD strength.The big idea behind why the market would start to price in a strong US Dollar has mainly to do with the recent US Dollar weakness that began on December 14 on the market's belief that the Fed will pull way back their expected rate hikes in 2019, and may even cut to support the economy.
There is one problem with this view though. The Fed is still expecting to hike twice though Powell recently noted a needed 'patience' in understanding the data, and what it means for whether the economy can withstand more hikes.
I argue that a key factor or main reason why the economy has shifted to this view is likely transitory factors like the US-China Trade War, which if a 'truce' is obtained, could lead to the Fed reaffirming their two+ hike view in 2019.
Ironically, the weakening backdrop that has encouraged the Fed to push back their rate hike bets has aligned with an incredible bounce of the SPX500. Since the close December 24, the SPX500 has jumped 11.6%, and more could be on the way on further US Dollar weakness. The SPX500 strength can be labelled under FOMO, but the environment that it is built upon seems shakier than ever as a weaker US Dollar would likely only result from a backdrop that leads to materially weaker revenue outlooks for constituents of the index.
Put simply, I would argue that the end of the world is overstated, and when positive developments return and the Fed pricing returns to rate normalization (i.e., hikes) that the US Dollar will resume the rally it began in February.
What is IG Client Sentiment Saying?
Source: IG Client Sentiment
For EURUSD,IG Client Sentiment retail trader data shows 41.1% of traders are net-long with the ratio of traders short to long at 1.43 to 1. Please note, EUR/USD is utilized as it makes up 56.8% of the DXY, and the sentiment picture can provide deep insight to the outlook of DXY.
We typically take a contrarian view to crowd sentiment, and the fact traders are net-short suggests EURUSD prices may continue to rise. Traders are further net-short than yesterday and last week, and the combination of current sentiment and recent changes gives us a stronger EURUSD-bullish contrarian trading bias(emphasis mine.)
The reason I share this with you is that it seems to indicate that Dollar weakness could continue in the near-term. You'll notice the long entry order is below current market on the Dollar Index so IGCS appears to be showing that we could see the entry order triggered with a relatively tight stop loss relative to the expected profit targets.
FOREX TRADING RESOURCES TO SUPPORT YOUR STRATEGY
We hope you enjoy DailyFX's new podcast: Trading Global Markets DecodedDailyFX offers a surplus of helpful trading tools, indicators, and resources to help traders. For those looking for trading ideas, our IG Client Sentiment shows the positioning of retail traders with actual live trades and positions.
Our trading guides bring our DailyFX Quarterly Forecasts and our Top Trading Opportunities, and our real-time news feedhas intra-day interactions from the DailyFX team. And if you're looking for real-time analysis, our DailyFX Webinars offer numerous sessions each week in which you can see how and why we're looking at what we watch.
If you're looking for educational information, our New to FX guide is there to help new(er) traders while our Traits of Successful Traders research is built to help sharpen the skill set by focusing on risk and trade management.
---Written by Tyler Yell, CMT
Tyler Yell is a Chartered Market Technician. Tyler provides Technical analysis that is powered by fundamental factors on key markets as well as trading educational resources. Read more of Tyler's Technical reports via his bio page.
Communicate with Tyler and have your shout below by posting in the comments area. Feel free to include your market views as well.
Talk markets on twitter @ForexYell
Source link
GBP price, news and analysis:
- The headline measure of UK inflation fell to 1.8% year/year in January, down from 2.1% in December and below analysts' consensus forecast of 2.0%.
- However, GBP was underpinned by private comments Tuesday from the UK's chief Brexit negotiator implying that Members of the UK Parliament would have to choose between a reworked Brexit deal or a potentially significant delay.
- That suggests the chances of a no-deal Brexit are receding: a positive for the Pound as the March 29 deadline approaches.
UK inflation eases in January
UK inflation fell to 1.8% year/year in January, down from 2.1% in December, below analysts' consensus forecast of 2.0% and under the Bank of England's 2.0% target. Core inflation was unchanged at 1.9%, as predicted.The latest 1.8% figure is the lowest for two years and the Office for National Statistics attributed the drop to cheaper gas, electricity and petrol prices, partly offset by cheaper ferry tickets and air fares.
In theory, the data make a tightening of UK monetary policy less likely, are therefore negative for the Pound and back up comments Tuesday by Bank of England Governor Mark Carney, who said provided economic expansion continues a modest tightening of monetary policy over time will likely be sufficient to achieve the central bank's inflation target.
Nonetheless, the principal driver of GBP remains Brexit and the Pound fell only marginally Wednesday as concerns eased that the UK will leave the EU on March 29 without a deal.
GBPUSD Price Chart, Daily Timeframe (September 21, 2018 – February 13, 2019)
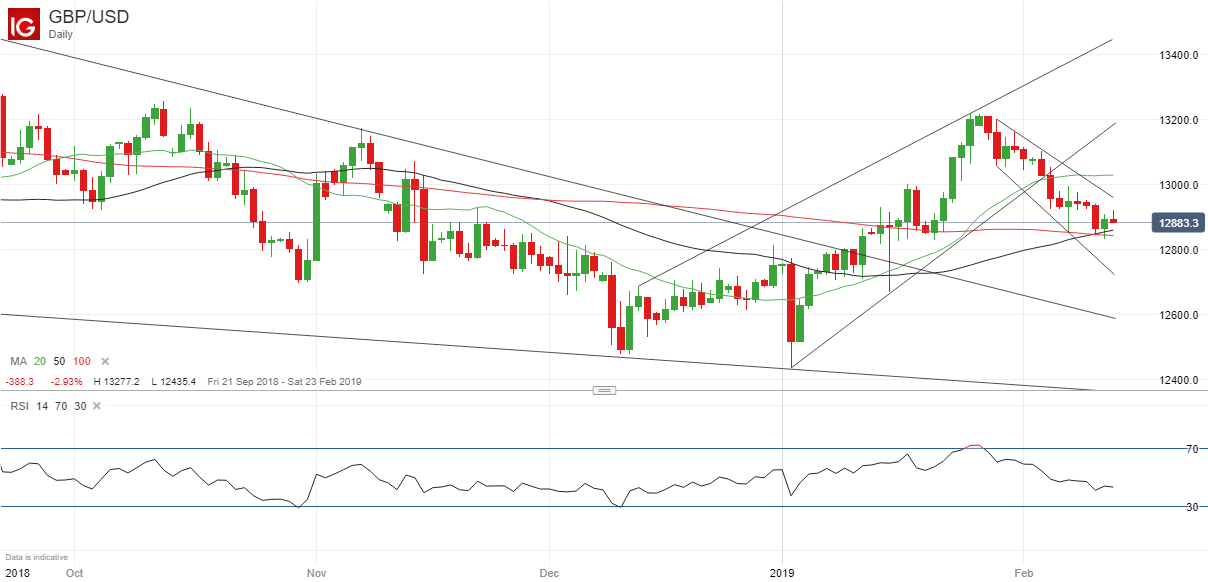
Chart by IG (You can click on it for a larger image)
Robbins says May's deal or long delay
Sterling's better tone Tuesday was due principally to a private comment by Olly Robbins, the UK's chief Brexit negotiator, who was reported to have said that the British Parliament will face a choice between UK Prime Minister Theresa May's Brexit deal or a long extension of the March 29 deadline.Robbins was reportedly overheard by an ITV correspondent at a hotel bar in Brussels saying lawmakers would have to choose whether to accept a reworked Brexit deal or a potentially significant delay. "Got to make them believe that the week beginning end of March... Extension is possible but if they don't vote for the deal then the extension is a long one,"the broadcaster quoted Robbins as saying.
Brexit Secretary Steve Barclay said later that he did not want to comment on conversations heard second hand in a noisy bar but the government's position was that the UKwould leave the EU on March 29 but wanted to do so with a deal.
Taken together, the comments seem to imply that a no-deal Brexit is no longer an option – a helpful development for the Pound – but nonetheless one that still cannot be ruled out entirely.
More to read:
Brexit Effect on Pound and UK Stocks: Impact of Deal or No DealBrexit and the Pound: Why EU Might Spurn a Last-Minute Deal With the UK
Resources to help you trade the forex markets:
Whether you are a new or an experienced trader, at DailyFX we have many resources to help you:--- Written by Martin Essex, Analyst and Editor
Feel free to contact me via the comments section below, via email at martin.essex@ig.com or on Twitter @MartinSEssex
Source link
EUR/USD Elliott Wave Analysis Talking Points:
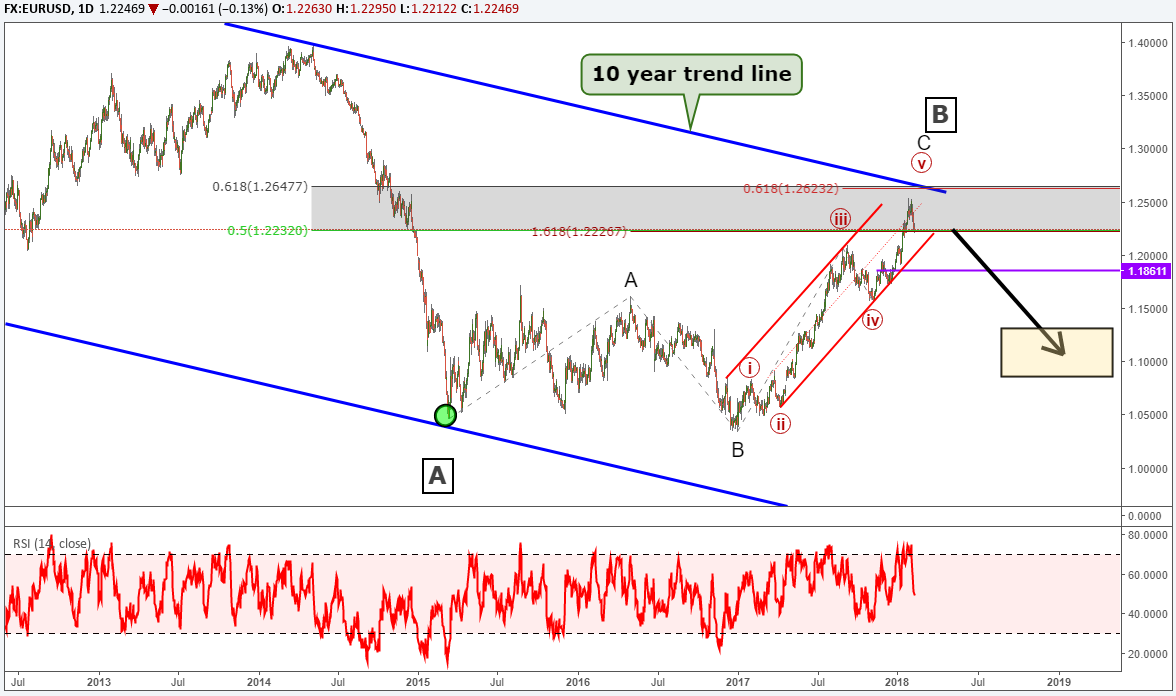
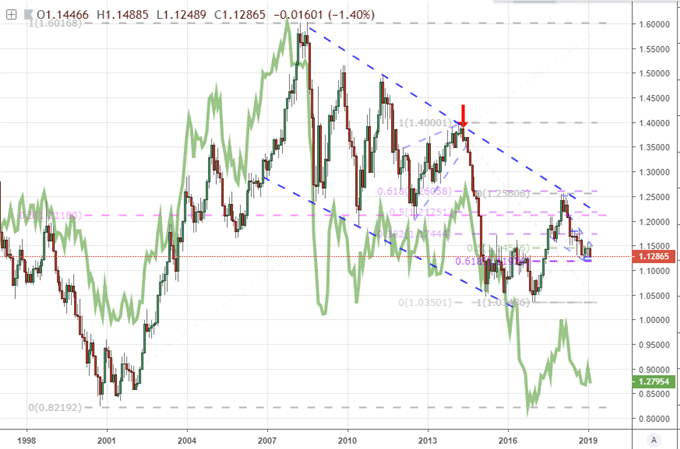
- EURUSD is very close to completing a three year Elliott Wave expanded flat pattern
- The final wave is taking shape with some targets near the 10 year trend at 1.26
- A bearish reversal has an initial target of 1.15 with a secondary zone 1.09-1.12
Elliott Wave Flat Pattern Began in 2015
EUR/USD has been correcting sideways since March of 2015 as an A-B-C wave. This three-wave move is shaped as an expanded flat pattern.According to the Elliott Wave principle, the 'C' wave of the flat would need to carve in five waves and it is the terminal wave of the larger pattern. We can see from the chart below that the pattern is nearly complete as the fifth and final wave is advanced in length.
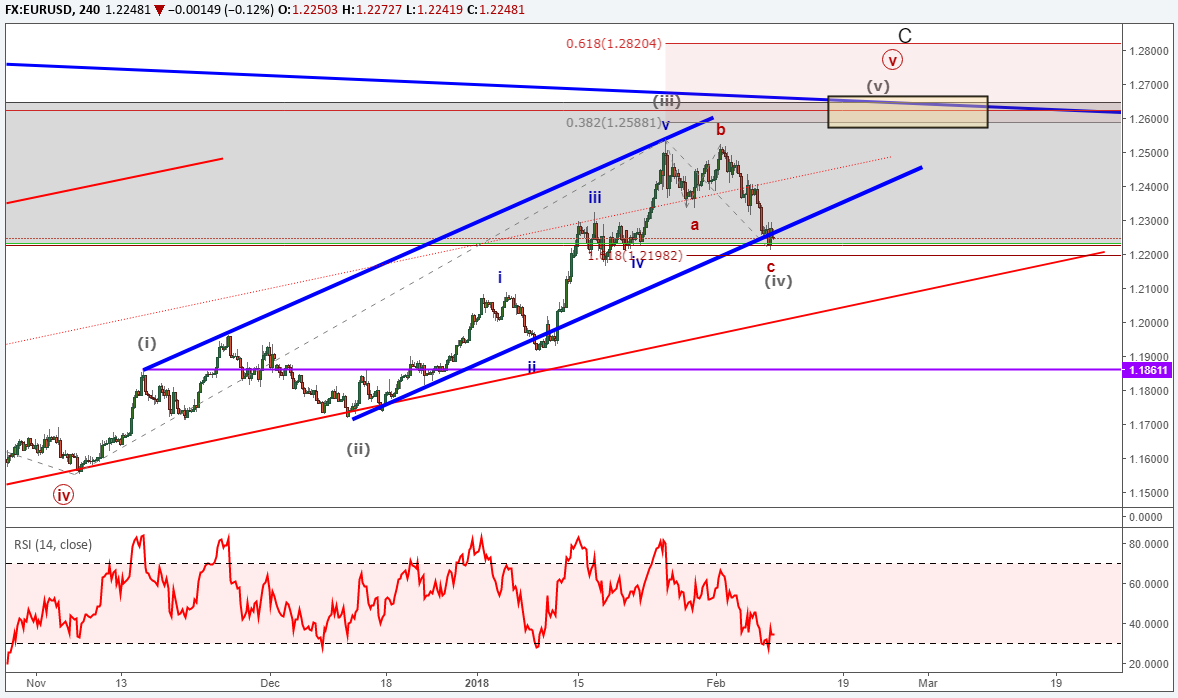
Elliott Wave Theory 5th Wave of a 5th Wave underfoot
One benefit of reading the charts using Elliott Wave Theory is that we can determine the maturity of the trend based on how many waves have formed. As mentioned above, we appear advanced within the fifth and final wave of 'C'. As we inspect the fifth wave that began in November, we can count four waves complete or nearly so (grey waves on the chart). As a result, the fifth wave of a fifth wave represents an aging trend that is ripe for reversal. For those keeping score at home, EURUSD is in wave (v) of ((v)) of C. Each of those three wave are ending waves.
Elliott Wave Forecasted Reversal Zone
According to the Elliott Wave principle, there are guidelines for estimating the distance of fifth waves and multiple wave relationships appear near 1.26. We believe EUR/USD may rise to finish the three-year expanded flat pattern and reverse near 1.26. If EUR/USD overshoots 1.26, that is ok, because the wave relationships are guidelines to help anchor you on the maturity of the current trend.Within an impulse wave, there are wave relationships we can use to estimate the length of the fifth wave. Many times, the fifth wave is .382 or .618 times the length of waves 1 through 3. Essentially, the fourth wave divides the whole impulse wave with the golden ratio.
- Grey wave (v) is .382 times waves (i) through (iii) at 1.2588.
- Red circle wave 'v' is .618 times waves 'I' through 'iii' at 1.2623
- The 10 year resistance trend line for EUR/USD crosses near 1.2620
- The fibonacci 61.8% retracement of the 2014 sell off is at 1.2648
As you can see, several wave relationships appear in a tight price zone near 1.26. As a result, if EUR/USD does extend towards these levels, we believe it is higher probability of a bearish trend reversal than a bullish breakout.
What is the EURUSD Trading Opportunity?
Though EURUSD may advance to 1.26, we are nearing the exit ramp on the freeway. The better opportunities are when we have more reward relative to the risk. Though smaller trades can be considered to the bullish side, the better risk to reward ratios are if EURUSD is successful in reaching the 1.26 zone. At 1.26, good risk to reward ratios are available for short positions strategically placed. We will discuss those strategies (like breakouts) in future writings. Our Traits of Successful Traders research unpacks the importance of risk to reward ratios and how our mind handles winning and losing trades.If EURUSD does turn lower, our initial target is 1.15 that contains the previous fourth wave low. Secondary targets arrive near 1.09-1.12.
Elliott Wave Theory FAQs
"The Elliott Wave principle seems subjective!"Well, I would disagree, as the EWP rules are not broken. The challenge is most likely the result of forecasting error. Even I make forecasting mistakes and it happens to everyone as we are assessing a live market environment. One key for budding Elliott Wave technicians is to learn the main patterns, and then minimize those errors by following the larger trend. We discuss this and other expert tips in our beginners and advanced trading guides.
How will I know if EUR/USD has topped using Elliott Wave?
There are certain Elliott Wave patterns that indicate a new trend in the opposite direction is forming. First, I look for a five-wave motive wave to carve to the downside. Secondly, we look for a three wave partial retracement higher. This 5-3 pattern is an early warning indication the near term trend has reversed from up to down. We have a one-hour webinar recording on "How to Start Your Elliott Wave Analysis".
New to trading FX? This guide is just for you.
---Written by Jeremy Wagner, CEWA-M
Jeremy Wagner is a Certified Elliott Wave Analyst with a Master's designation. Jeremy provides Elliott Wave analysis on key markets as well as Elliott Wave educational resources. Read more of Jeremy's Elliott Wave reports via his bio page.
Communicate with Jeremy and have your shout below by posting in the comments area. Feel free to include your Elliott Wave count as well.
Follow on twitter @JWagnerFXTrader .
Join Jeremy's distribution list.
Source link
USDCHF Talking Points:
- My medium-term bias for the Dollar is bearish with issues such as slowing growth, a tempered Fed and trade war blowback coalescing
- There are certainly scenarios in which the Greenback could recharge its rally such as full-tilt risk aversion or Brexit fallout
- Having an 'alternative view' analysis and trade option in hand - for this or any market/theme - is good practice and preparation
See how retail traders are positioning in USDCHF, EURUSD, GBPUSD and other major currency pairs along with indices, commodities and cryptocurrency on an intraday basis using theDailyFX speculative positioning data on the sentiment page.
My Leading Expectation for the Dollar
It is important to establish a sense of conviction in a market, but also to realize that there are frequent phases that see all assets and regions abstain from bullish or bearish momentum as speculators search for a clear thread. With that said, I have a general, medium-term bearish bias for the US Dollar. 'Medium-term' from my perspective is a view ranging from one to six months into the future. Where does this perspective come from, particularly considering it contradicts the prevailing momentum over the past 9 months? Despite the drift for the benchmark currency, the motivations for bulls over the past few years have notably deflated while new, questionable contributions are starting to draw greater scrutiny over the question of 'winners' and 'losers' to the policy being pursued. As risk trends ebb, we have drawn greater attention to the Dollar's young role as a carry currency. That is both a detriment as a carry unwind can hurt the preemptive chase for yield at the same time that rate forecasts themselves slide. Growth forecasts have similarly come under pressure in the US - as they have globally. Yet, coupled with the pursuit of policy that looks to earn greater domestic expansion at the expense of trade, the concerns of blowback from aggressive policies are starting to gain traction. Beyond these more immediate issues, the tectonic shifts in the Greenback's reserve currency status and its traditional valuation limits via debt analysis pose a deep risk that are only starting to creep into mainstream conversation.
Chart of DXY Dollar Index (Monthly)
The Value of Alternative Views and the Problem with Most Dollar-Based Majors
Having a prevailing view is evaluating probabilities - and, in the long-run, success in investing translates directly into our ability to pursue reliable outcomes. However, surprises are inevitable as the markets are sometimes dictated by change that defies reasonable expectations. We can face this inevitability in one of two ways. We could make it part of our trade management to recognize when conditions have changed in our analysis or active trade, cut and move on to the next scenario that fits our given criteria. Alternatively, we could proactively consider what a productive alternative scenario outcome (one in which generates significant market movement rather than stagnation) and establish possible setups that could take advantage of the market's development. With that objective in mind, what Dollar pairs are strong candidates for a further bullish run? As we have seen from the likes of EURUSD and GBPUSD, there is natural appeal for the Greenback via its position as a principal alternative to top liquidity currencies. Yet, how productive of a role will that prove for a sustained trend? Such a motivation requires an extreme backdrop which can invite numerous, unexpected complications. Furthermore, when we look to the big-picture technical standings of the majors, there are few instances where there is plenty of historical range for which the currency can run from a long-discounted position. EURUSD closing on 1.1200 would only reasonably open up to 1.0500 as a multi-decade low. GBPUSD is even more restricted as 1.1900 is a three-decade low. The commodity pairings (AUDUSD, NZDUSD, USDCAD) have seen their high-yield components collapse while USDJPY is a confusion on a key fundamental theme: risk trends.
Chart of EURUSD and GBPUSD in Green (Monthly)
A Long 'Pros' List for USDCHF Than Most Others
In a list of poor candidates, the USDCHF is perhaps one of the most appealing of the Dollar-based majors when we are contemplating USD-bullish scenarios. On the fundamental side, there is some safe haven conflict between the two currencies, but that is far less complicated than say USDJPY. Carry has played little role in this particular pair owing to the extreme (arguably desperate) monetary policy of the Swiss National Bank. The systemic questions of reserve status are going to be serious questions for both push-come-to-shove, and simple growth forecasts find both under pressure (the US for its own issues and the Swiss for their connection to mainland Europe). On the technical side, there is a long-term discount still priced into USDCHF. This is in part a product of the Franc, but it also has a strategic connection to the Euro's influence. Taking a look at a weekly chart, there is the potential for significant resistance clearance in the 1.0100 to 1.0300 area. Should the long-term wedge top fall, there is plenty of open air for follow through dating back to previous decades. We consider the best candidate for the alternative to my prevailing Dollar outlook in today's Quick Take video.
Chart of USDCHF (Monthly)
Source link
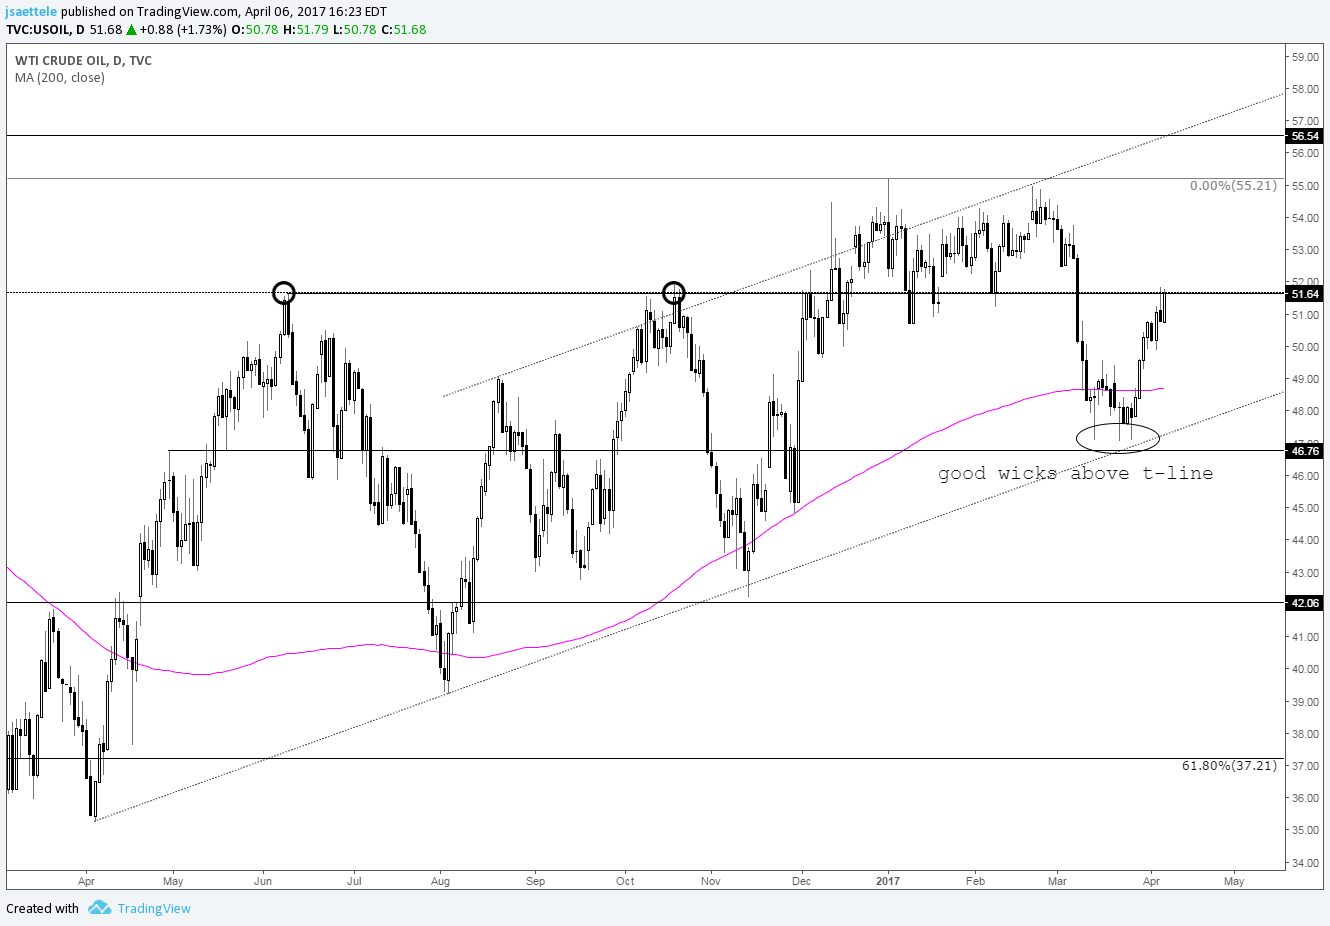
Chart Prepared by Jamie Saettele, CMT
DailyFX Trading Guides and Forecasts
Real Time Positioning
-"I'm positive on crude as long as the trendline holds. Now that's a hold! Lows from January and February stretch from 50.69 to 51.25. The upper end of this range looks like the 'best' level for resistance (trendline intersection)." Crude is above the top of the noted range and trading at the highs from June and October 2016. As such, respect potential for a pause in the move higher but the broader constructive outlook remains.
Source link
Weekly
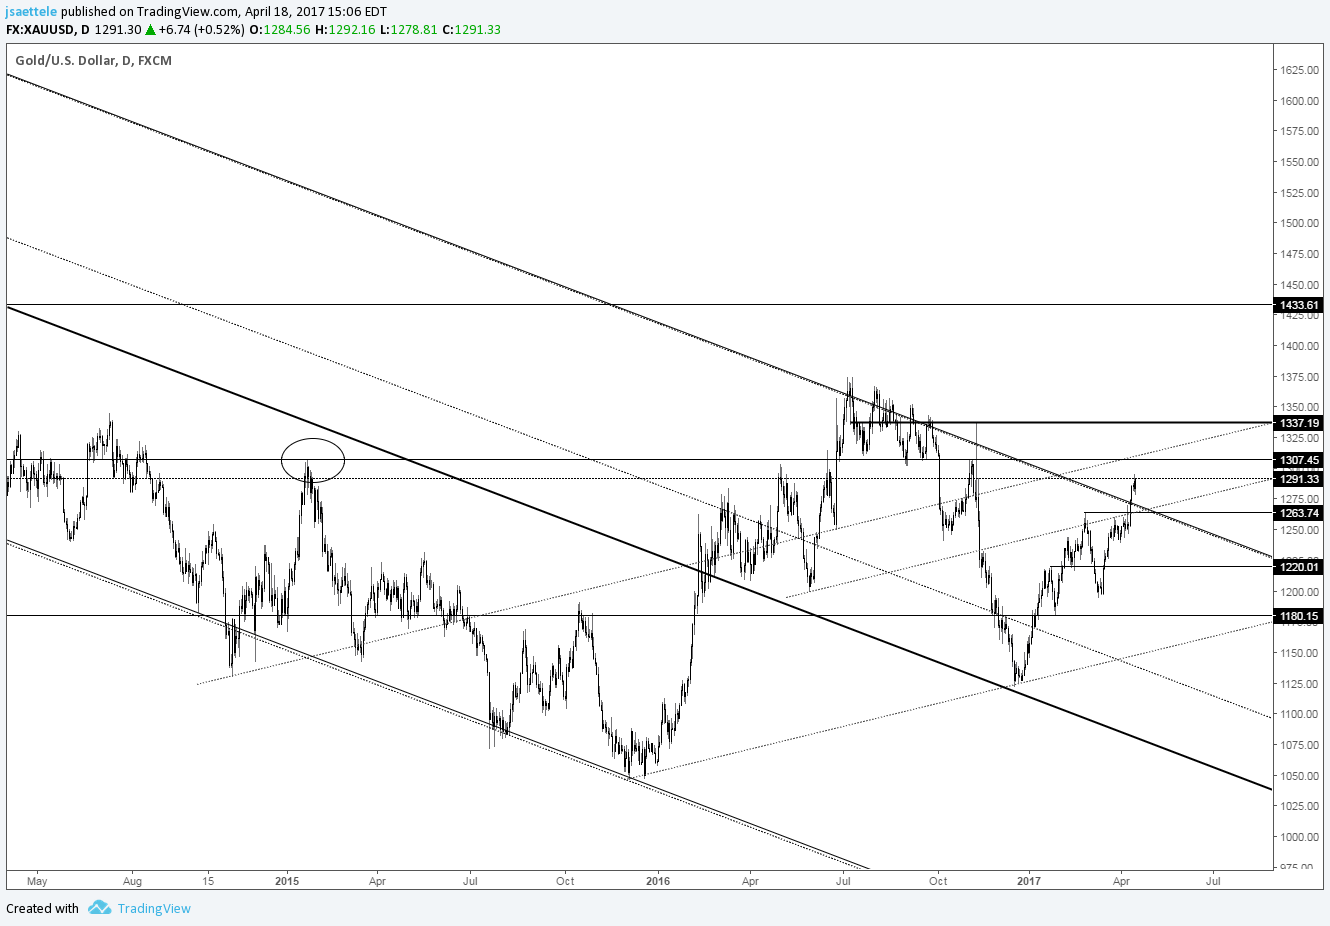
Chart Prepared by Jamie Saettele, CMT
DailyFX Trading Guides and Forecasts
Real Time Positioning
-I noted last update that "the weekly close for gold is important as a close above the 2011-2012 trendline would be the strongest indication yet of a major trend change. 1307 (big low in 2011 and high in December 2014) lines up as a level to pay attention to from a tactical standpoint." The 2011-2012 trendline has been broken. For more on gold, check out this video.
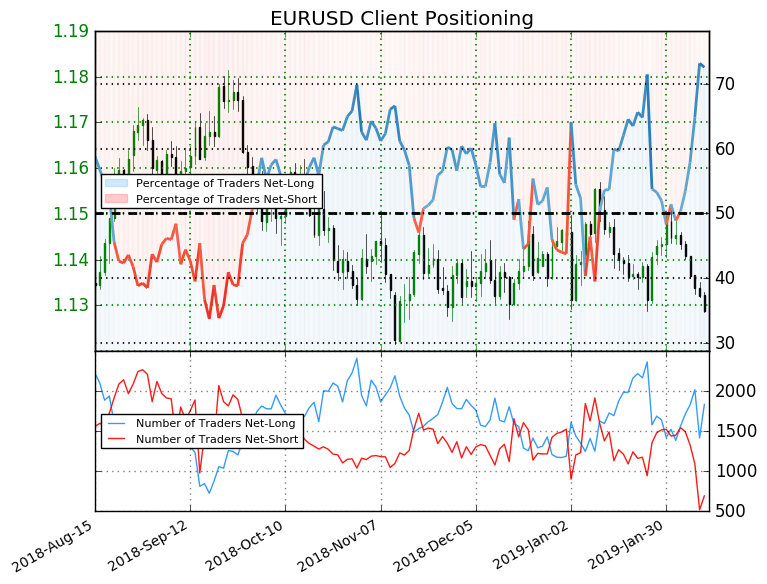
72.6% OF TRADERS ARE NET-LONG
EURUSD: Retail trader data shows 72.6% of traders are net-long with the ratio of traders long to short at 2.65 to 1. The number of traders net-long is 13.9% lower than yesterday and 17.1% higher from last week, while the number of traders net-short is 32.8% lower than yesterday and 56.4% lower from last week.For more in-depth analysis, check out the Q1 2019 Forecast for the Euro
EURUSD SENTIMENT SUGGESTS BEARISH TRADING BIAS
We typically take a contrarian view to crowd sentiment, and the fact traders are net-long suggests EURUSD prices may continue to fall. Traders are further net-long than yesterday and last week, and the combination of current sentiment and recent changes gives us a stronger EURUSD-bearish contrarian trading bias.Having trouble developing your strategy? Here's the #1 mistake that traders make.
--- Written by Nancy Pakbaz, CFA, DailyFX Research
Follow Nancy on Twitter @NancyPakbazFX
Source link
The BIG Idea: When looking to the interest rate futures market, there is an expected cut by the Federal Reserve in the US reserve rate from June 2019-June 2020. When looking to the Federal Reserve's expectations (aka educated guesses), they are looking to two cuts, which would likely be firmed on a Trade War 'truce' between the US & China. Ironically, the US Dollar is falling because the Fed is concerned the environment is turning too sour to warrant further hikes. However, an improvement in data would reignite the Fed's outlook and firm up expectations for future Fed hikes that would likely strengthen the US Dollar.
Point to Establish View: Initiation near 94-93 (H2 2018 support zone)
Spot: DXY @ 94.809
Objective 1: 98 (Fibonacci target,) > 1:1 Risk: Reward Ratio
Objective 2: 103.80 (2016 high)1:10.8 Risk: Reward Ratio
Objective 3: Hold with Trailing Stopon a close below 50-DMA or Ichimoku Cloud
Idea Invalidation Level: 92.55 (50% of 2018 range) 145-45 pip stop depending on entry
View Structure
The BIG Picture:
Chart Source: Pro Real Time with IG UK Price Feed. Created by Tyler Yell, CMT
The challenge with Elliott Wave is deciphering the correct corrective/ non-trending moves. These are seen as waves 2-4-B. These are important Because waves 1-3-5-A-C being the strongest and most aggressive moves in the direction of the trend.
Above, you'll notice that the expanded wave fourlabeled A-B-C from 2015-2018 is seen as preceding a potential wave five that could take the US Dollar to new post-2008 highs. The set-up for this trade anticipates that we're in corrective-wave 2 of wave five that could aggressively move higher if this move plays out as analyzed.
Lastly, the relationship between the corrective waves is very important. The 2009-2011 corrective wave 2 was 113 weeks or 2 years and two months. The 2015-2018 was near 1.382% (a Fibonacci relationship) the length of the 2009-2011 correction at 153 weeks.
Should we be embarking on the start of wave 3 of 5 in DXY, we could see a very strong rally that could have EUR/USD lower and USD/JPY much higher.
The big idea behind why the market would start to price in a strong US Dollar has mainly to do with the recent US Dollar weakness that began on December 14 on the market's belief that the Fed will pull way back their expected rate hikes in 2019, and may even cut to support the economy.
There is one problem with this view though. The Fed is still expecting to hike twice though Powell recently noted a needed 'patience' in understanding the data, and what it means for whether the economy can withstand more hikes.
I argue that a key factor or main reason why the economy has shifted to this view is likely transitory factors like the US-China Trade War, which if a 'truce' is obtained, could lead to the Fed reaffirming their two+ hike view in 2019.
Ironically, the weakening backdrop that has encouraged the Fed to push back their rate hike bets has aligned with an incredible bounce of the SPX500. Since the close December 24, the SPX500 has jumped 11.6%, and more could be on the way on further US Dollar weakness. The SPX500 strength can be labelled under FOMO, but the environment that it is built upon seems shakier than ever as a weaker US Dollar would likely only result from a backdrop that leads to materially weaker revenue outlooks for constituents of the index.
Put simply, I would argue that the end of the world is overstated, and when positive developments return and the Fed pricing returns to rate normalization (i.e., hikes) that the US Dollar will resume the rally it began in February.
Source: IG Client Sentiment
For EURUSD,IG Client Sentiment retail trader data shows 41.1% of traders are net-long with the ratio of traders short to long at 1.43 to 1. Please note, EUR/USD is utilized as it makes up 56.8% of the DXY, and the sentiment picture can provide deep insight to the outlook of DXY.
We typically take a contrarian view to crowd sentiment, and the fact traders are net-short suggests EURUSD prices may continue to rise. Traders are further net-short than yesterday and last week, and the combination of current sentiment and recent changes gives us a stronger EURUSD-bullish contrarian trading bias(emphasis mine.)
The reason I share this with you is that it seems to indicate that Dollar weakness could continue in the near-term. You'll notice the long entry order is below current market on the Dollar Index so IGCS appears to be showing that we could see the entry order triggered with a relatively tight stop loss relative to the expected profit targets.
DailyFX offers a surplus of helpful trading tools, indicators, and resources to help traders. For those looking for trading ideas, our IG Client Sentiment shows the positioning of retail traders with actual live trades and positions.
Our trading guides bring our DailyFX Quarterly Forecasts and our Top Trading Opportunities, and our real-time news feedhas intra-day interactions from the DailyFX team. And if you're looking for real-time analysis, our DailyFX Webinars offer numerous sessions each week in which you can see how and why we're looking at what we watch.
If you're looking for educational information, our New to FX guide is there to help new(er) traders while our Traits of Successful Traders research is built to help sharpen the skill set by focusing on risk and trade management.
---Written by Tyler Yell, CMT
Tyler Yell is a Chartered Market Technician. Tyler provides Technical analysis that is powered by fundamental factors on key markets as well as trading educational resources. Read more of Tyler's Technical reports via his bio page.
Communicate with Tyler and have your shout below by posting in the comments area. Feel free to include your market views as well.
Talk markets on twitter @ForexYell
Point to Establish View: Initiation near 94-93 (H2 2018 support zone)
Spot: DXY @ 94.809
Objective 1: 98 (Fibonacci target,) > 1:1 Risk: Reward Ratio
Objective 2: 103.80 (2016 high)1:10.8 Risk: Reward Ratio
Objective 3: Hold with Trailing Stopon a close below 50-DMA or Ichimoku Cloud
Idea Invalidation Level: 92.55 (50% of 2018 range) 145-45 pip stop depending on entry
View Structure
The BIG Picture:
Chart Source: Pro Real Time with IG UK Price Feed. Created by Tyler Yell, CMT
Technical Reasoning Behind the Trade
The labels on the DXY chart above align with Elliott Wave analysis. The purpose of Elliott Wave is to put current market moves in a context that can help you create probability weighted outcomes that can help traders anticipate opportunities and manage risk for when the outlook changes.The challenge with Elliott Wave is deciphering the correct corrective/ non-trending moves. These are seen as waves 2-4-B. These are important Because waves 1-3-5-A-C being the strongest and most aggressive moves in the direction of the trend.
Above, you'll notice that the expanded wave fourlabeled A-B-C from 2015-2018 is seen as preceding a potential wave five that could take the US Dollar to new post-2008 highs. The set-up for this trade anticipates that we're in corrective-wave 2 of wave five that could aggressively move higher if this move plays out as analyzed.
Lastly, the relationship between the corrective waves is very important. The 2009-2011 corrective wave 2 was 113 weeks or 2 years and two months. The 2015-2018 was near 1.382% (a Fibonacci relationship) the length of the 2009-2011 correction at 153 weeks.
Should we be embarking on the start of wave 3 of 5 in DXY, we could see a very strong rally that could have EUR/USD lower and USD/JPY much higher.
Fundamental Justification For Bullish DXY View
The technical justification can be summarized as saying, I think we're about to embark on the strongest part of wave 5, which began in February 2018. The fundamental justification can be summarized as believing that the market swung too aggressively in pricing out FOMC hikes and into FOMC cuts, and normalization of this extreme view may lead to USD strength.The big idea behind why the market would start to price in a strong US Dollar has mainly to do with the recent US Dollar weakness that began on December 14 on the market's belief that the Fed will pull way back their expected rate hikes in 2019, and may even cut to support the economy.
There is one problem with this view though. The Fed is still expecting to hike twice though Powell recently noted a needed 'patience' in understanding the data, and what it means for whether the economy can withstand more hikes.
I argue that a key factor or main reason why the economy has shifted to this view is likely transitory factors like the US-China Trade War, which if a 'truce' is obtained, could lead to the Fed reaffirming their two+ hike view in 2019.
Ironically, the weakening backdrop that has encouraged the Fed to push back their rate hike bets has aligned with an incredible bounce of the SPX500. Since the close December 24, the SPX500 has jumped 11.6%, and more could be on the way on further US Dollar weakness. The SPX500 strength can be labelled under FOMO, but the environment that it is built upon seems shakier than ever as a weaker US Dollar would likely only result from a backdrop that leads to materially weaker revenue outlooks for constituents of the index.
Put simply, I would argue that the end of the world is overstated, and when positive developments return and the Fed pricing returns to rate normalization (i.e., hikes) that the US Dollar will resume the rally it began in February.
What is IG Client Sentiment Saying?
Source: IG Client Sentiment
For EURUSD,IG Client Sentiment retail trader data shows 41.1% of traders are net-long with the ratio of traders short to long at 1.43 to 1. Please note, EUR/USD is utilized as it makes up 56.8% of the DXY, and the sentiment picture can provide deep insight to the outlook of DXY.
We typically take a contrarian view to crowd sentiment, and the fact traders are net-short suggests EURUSD prices may continue to rise. Traders are further net-short than yesterday and last week, and the combination of current sentiment and recent changes gives us a stronger EURUSD-bullish contrarian trading bias(emphasis mine.)
The reason I share this with you is that it seems to indicate that Dollar weakness could continue in the near-term. You'll notice the long entry order is below current market on the Dollar Index so IGCS appears to be showing that we could see the entry order triggered with a relatively tight stop loss relative to the expected profit targets.
FOREX TRADING RESOURCES TO SUPPORT YOUR STRATEGY
We hope you enjoy DailyFX's new podcast: Trading Global Markets DecodedDailyFX offers a surplus of helpful trading tools, indicators, and resources to help traders. For those looking for trading ideas, our IG Client Sentiment shows the positioning of retail traders with actual live trades and positions.
Our trading guides bring our DailyFX Quarterly Forecasts and our Top Trading Opportunities, and our real-time news feedhas intra-day interactions from the DailyFX team. And if you're looking for real-time analysis, our DailyFX Webinars offer numerous sessions each week in which you can see how and why we're looking at what we watch.
If you're looking for educational information, our New to FX guide is there to help new(er) traders while our Traits of Successful Traders research is built to help sharpen the skill set by focusing on risk and trade management.
---Written by Tyler Yell, CMT
Tyler Yell is a Chartered Market Technician. Tyler provides Technical analysis that is powered by fundamental factors on key markets as well as trading educational resources. Read more of Tyler's Technical reports via his bio page.
Communicate with Tyler and have your shout below by posting in the comments area. Feel free to include your market views as well.
Talk markets on twitter @ForexYell
Source link
Oil Price Analysis and News
- Improved Risk Sentiment Provides Support
- Brent Crude Technical Analysis
Improved Risk Sentiment Provides Support
While yesterday's jawboning from OPEC continues to keep the oil complex bid. The improvement in the global risk tone has also provided a lift for Brent crude futures. Overnight, government shutdown fears had abated slightly after reports suggested that President Trump may reluctantly accept the bi-partisan agreement thus avoiding another government shutdown. On the Trade front, sentiment has picked up following news that President Xi were to meet with the Trump administration later this week, while President Trump has also hinted that the US could extend the March 1st deadline, provided that an agreement could be reached in the near-term, consequently reducing investor angst that trade tensions will escalate.
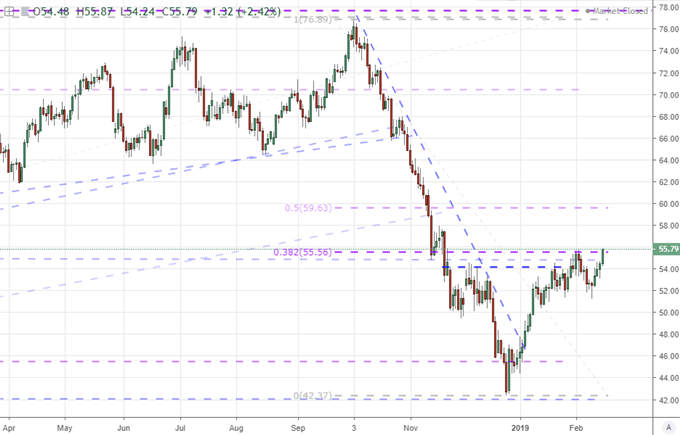
Brent Crude Technical Analysis
Brent crude futures continue to track higher with bulls eying a break above the 2019 peak ($63.63/bbl). A closing break above could see Brent make a test of the $64 handle in the near-term. As reminder, yesterday's API crude inventory data showed a surprise drawdown of 998kbbls, as such, confirmation by today's DoE data with a larger drawdown could see Brent at $64.
BRENT CRUDE PRICE CHART: Daily Time Frame (Oct 2018 – Feb 2019)

Oil Impact on FX
Net Oil Importers: These countries tend to be worse off when the price of oil rises. This includes, KRW, ZAR, INR, TRY, EUR, CNY, IDR, JPY
Net Oil Exporters: These counties tend to benefit when the price of oil rises. This includes RUB, CAD, MXN, NOK.
Recommended Reading
What Traders Need to Know When Trading the Oil MarketImportant Difference Between WTI and Brent
--- Written by Justin McQueen, Market Analyst
To contact Justin, email him at Justin.mcqueen@ig.com
Follow Justin on Twitter @JMcQueenFX
Source link
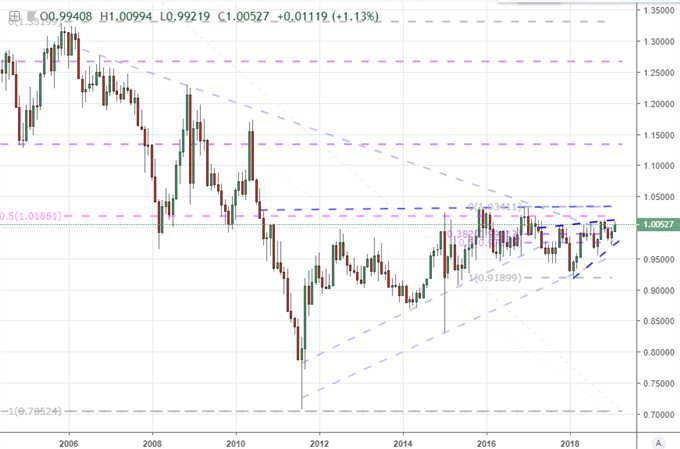
The Elliott Wave pattern for USDJPY favors a complex wave that began in December 2016 and is nearing completion. We are observing a channel line near 105 and the 78.6% Fibonacci retracement near 103 as potential reversal points.
Elliott Wave Forecast USDJPY
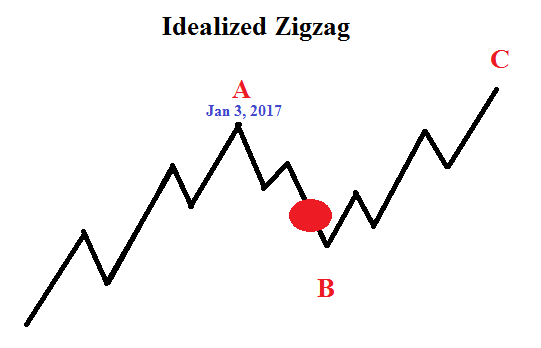
Now that USDJPY has broken to new lows, what is next? The higher probability Elliott Wave pattern we are following is that USD/JPY is in a complex 'B' wave that likely holds above 103. Therefore, the majority of the trend may be behind us and the next higher probability trade may be to wait for a bottoming process to take place.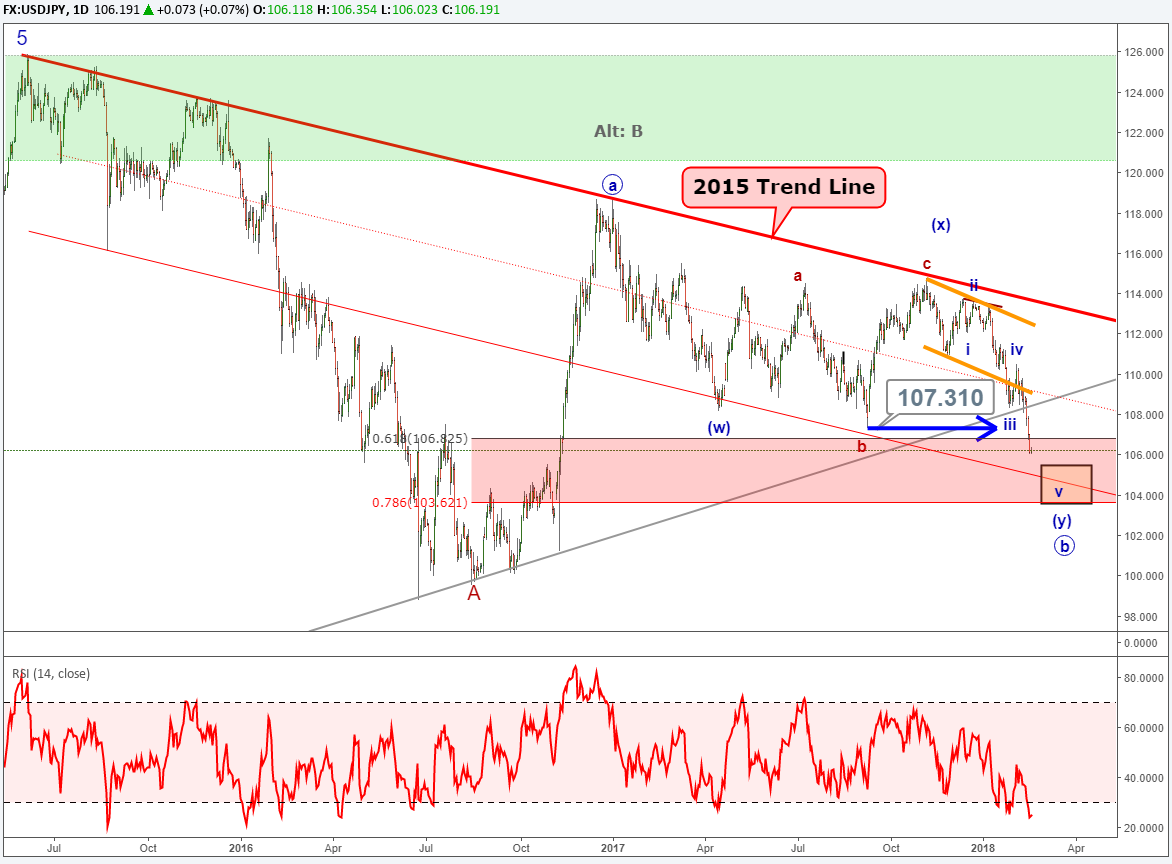
It appears the complex 'b' wave is the middle wave of a bullish zigzag. If this is the case, a bullish 'c' wave may begin above 103 to retest the December 2016 high near 118.
Alternate Elliott Wave Count Suggests a Test of 100
We are monitoring other alternative counts as well. Though we believe it is lower probability, we are prepared to consider the December 2016 high as a larger degree 'B' wave (grey label on the chart above). We believe this is lower probability because it implies a motive 'C' wave to new lows below 100.The challenge with this alternative count is that motive waves need to unfold as diagonals or impulse waves. The move since December 2016 does not structurally fit into either in clean fashion. Therefore, we do not think it is higher probability, but if a correction sustains itself below 103, we will reconsider this alternate count.
USD/JPY Sentiment is Bearish for Prices
IG Client Sentiment shows the number of traders have been shifting net long over the past couple of weeks. This bearish signal implies additional losses in the near term. This sentiment picture lines up with the Elliott Wave forecast above. View how live traders are positioned with our IG client sentiment tool.As a result, we consider this downward correction in USDJPY to be temporary and leading to a bullish wave beginning from above 103.
Elliott Wave Theory FAQs
What is Elliott Wave Theory?Elliott Wave Theory was developed by Ralph Nelson Elliott back in the 1930's. It is a study of wave cycles and patterns. Five waves define the direction of the trend and three waves define a corrective move. Review our beginners and advanced Elliott Wave guides to learn more about the terms, rules, and common patterns of Elliott Wave principle.
After reviewing the guides, be sure to follow future Elliott Wave articles to see Elliott Wave Theory in action.
Can a newer trader learn and understand Elliott Wave Theory?
Just like learning to ride a bicycle, we all started as beginners at one time or another. I would first suggest familiarizing yourself with FX terminology and how to read a currency quote, and then read the Traits of Successful traders to understand the habits of successful traders. Therefore, regardless of the analytical method, you have a foundation for trading to build a strategy.
---Written by Jeremy Wagner, CEWA-M
Jeremy Wagner is a Certified Elliott Wave Analyst with a Master's designation. These articles are designed to illustrate Elliott Wave applied to the current market environment. See Jeremy's bio page for recent Elliott Wave articles.
Communicate with Jeremy and have your shout below by posting in the comments area. Feel free to include your Elliott Wave count as well.
Discuss this market with Jeremy in Monday's US Opening Bell webinar.
Follow on twitter @JWagnerFXTrader .
Join Jeremy's distribution list.
Source link
- The January FOMC minutes should detail a lively discussion that ultimately produced a significant shift in policy at the last rate decision, including the end of gradual rate hikes.
- Inflation data from Japan may show some stabilization in price pressures now that oil prices have stabilized in recent weeks.
Join me on Mondays at 7:30 EST/12:30 GMT for the FX Week Ahead webinar, where we discuss top event risk over the coming days and strategies for trading FX markets around the events listed below.
02/19 Tuesday | 10:00 GMT | EUR Eurozone & German ZEW Surveys (FEB)
Typically, neither the Eurozone nor German ZEW Surveys much interest in any given month. However, over the past two releases, the Euro has moved in excess of +/-0.2% around the release, suggesting that attention has indeed returned to the 'high' ranked events. Certainly, provided the context of a deteriorating economic backdrop for the Eurozone, traders are proving more interested in proximal trackers of growth in order to try and ply additional insight into the European Central Bank's next policy move. As it were, with gauges of economic data momentum continuing to sink, it's likely that the February ZEW surveys reveal more disappointing news about the state of play in the Eurozone.Pairs to Watch: EUR/GBP, EUR/JPY, EUR/USD
02/20 Wednesday | 19:00 GMT | USD January FOMC Meeting Minutes
The January FOMC meeting produced a new Summary of Economic Projections that hinted at a more dovish rate hike path than previously anticipated, but the most important aspect of the meeting was Fed Chair Jerome Powell's press conference. Evidently, armed with the backing of the FOMC, the Fed Chair said that they would cease the gradual path of rate hikes and hold a "patient stance" on future moves. So, the few clues that we have should indicate a lively meeting, and therefore, a set of minutes that will contain more market-moving information than usual.Pairs to Watch: DXY Index, EUR/USD, USD/JPY, Gold
02/21 Thursday | 00:30 GMT | AUD Employment Change & Unemployment Rate (JAN)
The Australian jobs market has improved in recent months, with jobs growth coming in above expectations in both November and December 2018. The six-month average of jobs growth improved from +15.1K in July 2018 to +22.9K by the end of the year. During this timeframe, the unemployment rate dropped from 5.3% to 5.0%. For the upcoming report, the Australian economy is projected to have added +15K jobs while the unemployment rate is due on hold at 5.0%. Following commentary by Reserve Bank of Australia Governor Philip Lowe, the jobs data may run counter to the dovish undertones painted by the central bank head. With global equity markets firming up, a strong January Australian employment report could help revitalize the Aussie after its sharp drop on February 6.Pairs to Watch: AUD/NZD, AUD/JPY, AUD/USD
02/21 Thursday | 13:30 GMT | USD Durable Goods Orders (DEC P)
Durable Goods Orders are an important barometer for US consumption, which constitutes roughly 70% of GDP. Normally, consumers hold off on buying durable goods during poor economy conditions; thus, improved orders suggest confidence among American consumers with respect to their future financial security. For the upcoming report, it's important to recall that the data was delayed due to the US government shutdown. The preliminary January print is expected to show a gain of 1.7% over the prior month after the 0.7% increase in November. The data may help stabilizeUS growth expectations for Q1'19, which have dropped sharply over the past week (per the Atlanta Fed GDPNow forecast) to +1.5% annualized.Pairs to Watch: DXY Index, EUR/USD, USD/JPY, Gold
02/21 Thursday | 23:30 GMT | JPY National Consumer Price Index (JAN)
Amid the rebound in energy prices in recent weeks, Japanese inflation expectations have arrested their decline and so too have official forecasts for the forthcoming January Japanese National CPI report. In recent years, Japan has imported more than 90% of its energy needs from abroad, so stabilization in energy markets can have a profound impact on topline inflation. The headline reading is due in at +0.2% in January, down from +0.3% (y/y), while the core reading – ex-fresh food – is due in at +0.8% from +0.7% (y/y). The core-core reading – ex-fresh food & energy – is due in at +0.4% from +0.3%(y/y). Still, traders shouldn't draw any long-term implications from the data as the Bank of Japan isn't going to be changing policy any time soon.Pairs to Watch: AUD/JPY, EUR/JPY, USD/JPY
Read more: US Dollar Edges Higher, Gold Bounces at Support as US-China Trade Talks End
FX TRADING RESOURCES
Whether you are a new or experienced trader, DailyFX has multiple resources available to help you: an indicator for monitoring trader sentiment; quarterly trading forecasts; analytical and educational webinars held daily; trading guides to help you improve trading performance, and even one for those who are new to FX trading.--- Written by Christopher Vecchio, CFA, Senior Currency Strategist
To contact Christopher, email him at cvecchio@dailyfx.com
Follow him in the DailyFX Real Time News feed and Twitter at @CVecchioFX
Source link
Stock Market Talking Points:
- Minimal changes in index tracking funds could show indecision, or interest elsewhere
- The T-bill tracking ETF BIL has recorded consecutive outflows for over three weeks
- See Q1'19 forecasts for the Dow, Dollar, Bitcoin and more with the DailyFX Trading Guides.
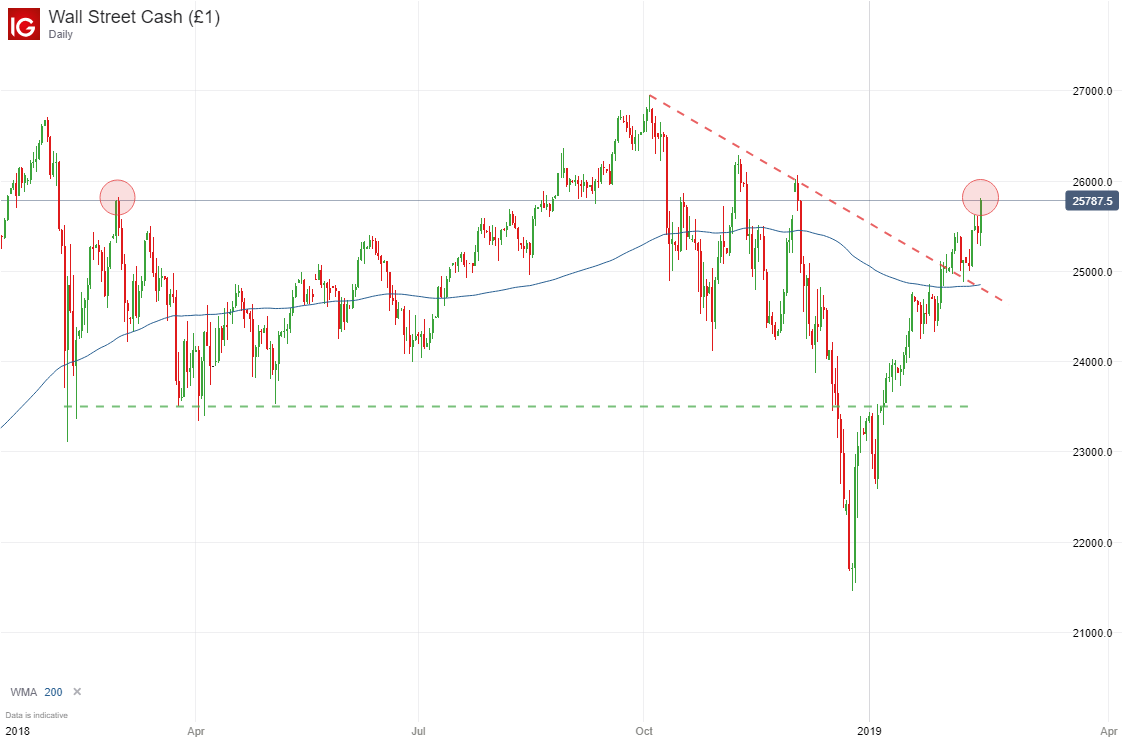
Dow Jones Drives Higher in February
The Dow Jones has continued its journey higher in February after a stellar January. As of Friday, the Industrial Average closed around 25,880 following optimism on the trade war talks between the United States and China. Technically speaking, the index rests near swing highs registered in early 2018 and mid-October. Sustained optimism next week could see the Dow clear the level, thus opening up higher price targets. With that in mind, exchange traded fund flows reveal mild inflows amidst such a sustained rally.Dow Jones Price Chart: Daily Time-frame (January 2018 to February 2019) (Chart 1)
Learn key tips and strategies to day trade the Dow Jones
February Sees Muted Fund Flows
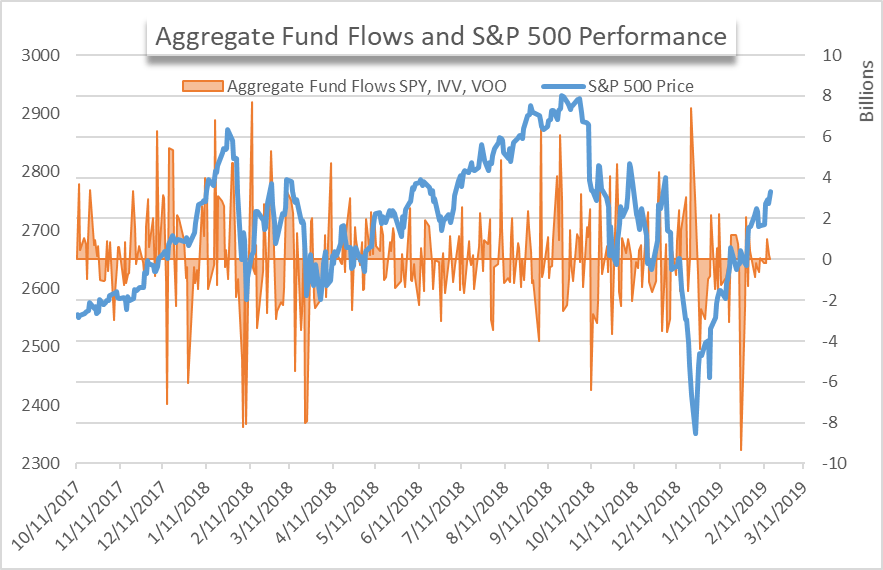
After the last week of January delivered a record intraday outflow for the funds included in this series, February has failed to offer any flows as surprising. However, that is not to say there have been no noteworthy developments at all. Thus far the month of February has seen a net outflow of a meager $740 million, considerably lower than the single outflow highlighted two weeks ago. While the aggregate fund flows have been muted with no discernible trend, the same cannot be said for other areas in the ETF space, namely short-term fixed income.
Aggregate Fund Flows for Broad Market ETFs versus S&P 500 Performance (Chart 2)
Short-Term Fixed Income Finds Few Buyers
The BIL ETF, a fund that seeks to match the performance of 1-3-month US T-bills, is one such fund that has etched out a trend. Since January 28th, the fund has not registered a single day of net inflows. While the market capitalization of the fund is exponentially smaller than the aggregate fund flows above, such a trend is likely indicative of the larger picture outside the fund.BIL ETF Fund Flows (Chart 3)
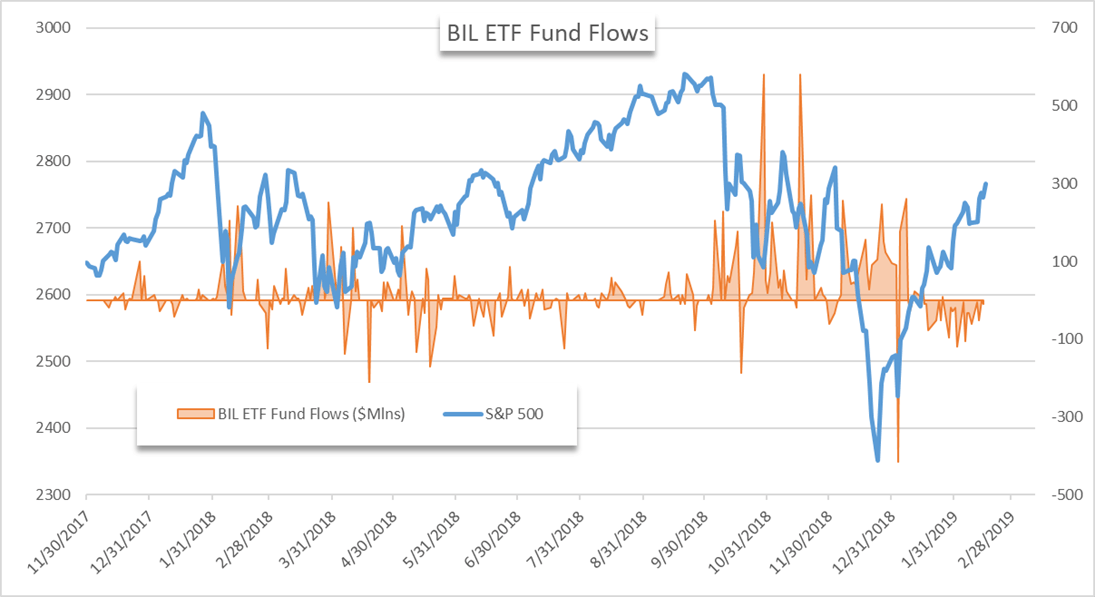
In total, $577 million has left the coffers of BIL since the last net inflow on January 28th. With a market capitalization of roughly $8 billion, the outflows are equal to about 7% of total assets under management for the fund. Further, the outflows juxtapose the robust inflows witnessed during the equity rout in December. The same symptoms of a risk-on attitude can be viewed in high yield corporate debt.
High Yield Corporate Debt is Back on the Menu
The HYG ETF, a fund that tracks the performance of high yield fixed income, has seen a resurgence in demand in conjunction with the stock market rebound in January.HYG ETF Fund Flows (Chart 4)
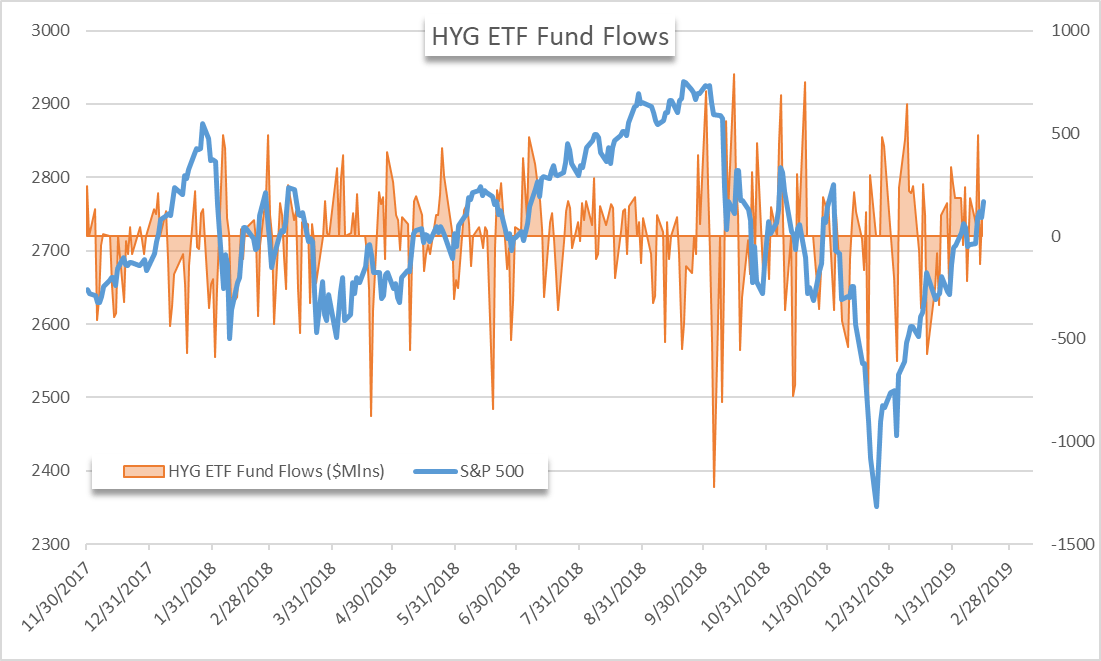
Since the advent of February, HYG has registered $1.05 billion in new capital. Although the fund has seen net inflows for some time the overall pace of buying has slowed, barring one exception on February 12th. The same can be seen in the selling of BIL. With muted and effectively deadlocked fund flows in the broad-market tracking funds, it seems investor sentiment is at a junction. So, what does this mean for the Dow?
The Dow
Just as investor conviction in the highlighted funds seemed to be waning, key fundamental risks for the Dow have been reduced. Thursday saw the aversion of another partial government shutdown as politicians on both sides of the aisle agreed to a funding bill that was later signed by President Trump.
Check out A Brief History of Trade Wars for a crash-course on the background of previous economic conflicts.
Similarly, the President heralded significant headway in the ongoing trade negotiations between China and the United States that took place this week in Beijing. While the talks fell short of a concrete agreement, the overall market sentiment regarding the matter was firmly bullish heading into the long weekend. With two major fundamental uncertainties removed, or at least reduced, the building blocks for a continuation of the recent rally may have already been laid.
--Written by Peter Hanks, Junior Analyst for DailyFX.com
Contact and follow Peter on Twitter @PeterHanksFX
DailyFX forecasts on a variety of currencies such as the US Dollar or the Euro are available from the DailyFX Trading Guides page. If you're looking to improve your trading approach, check out Traits of Successful Traders. And if you're looking for an introductory primer to the Forex market, check out our New to FX Guide.
Source link
Daily
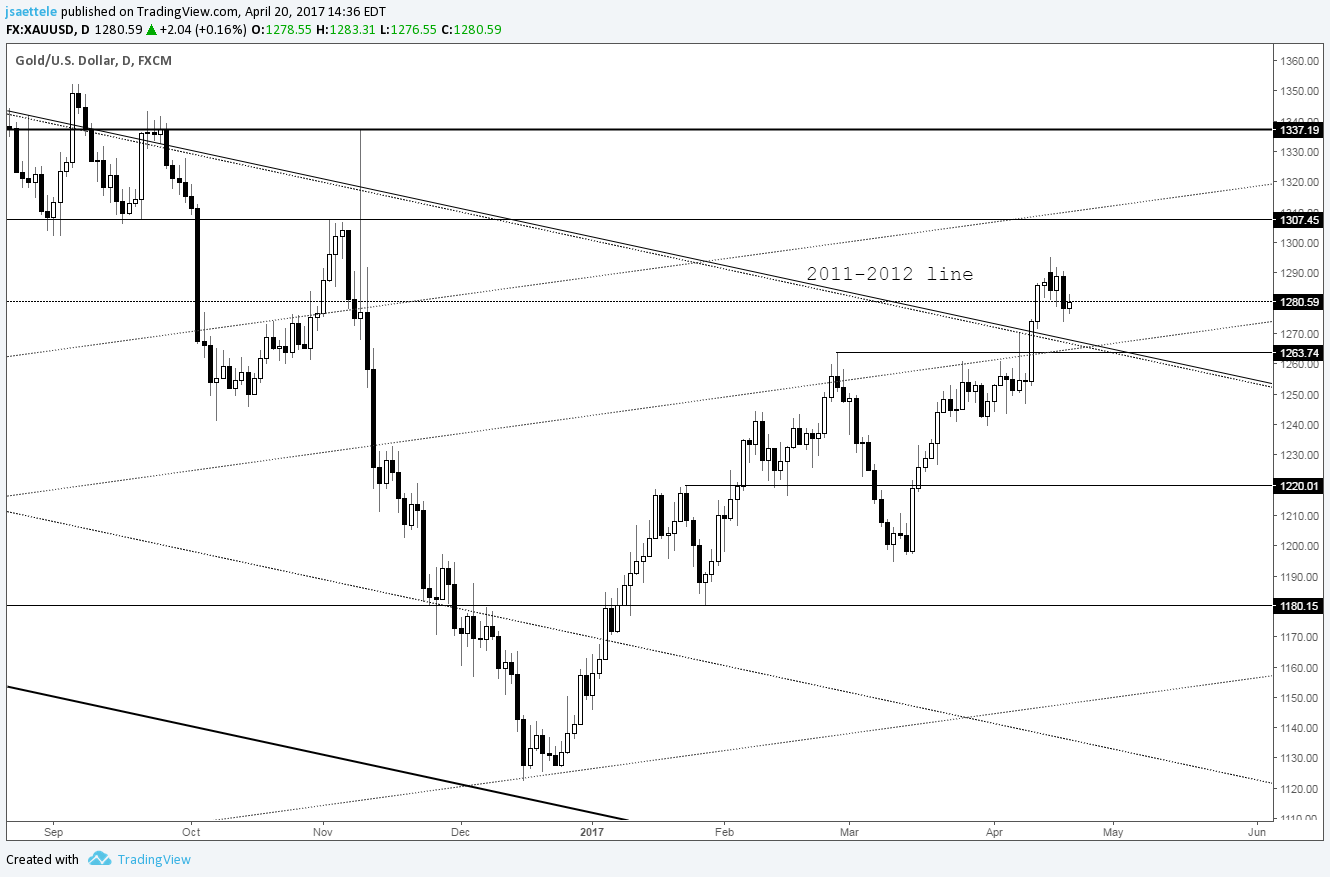
Chart Prepared by Jamie Saettele, CMT
DailyFX Trading Guides and Forecasts
Real Time Positioning
-The weekly close for gold is important as a close above the 2011-2012 trendline would be the strongest indication yet of a major trend change. 1307 (big low in 2011 and high in December 2014) and 1264 line up as levels to pay attention to from a tactical standpoint.