

Gold Talking Points
Gold quickly approaches the 2019-high ($1326) as fresh data prints coming out of the U.S. economy dampen bets for a Federal Reserve rate-hike, and the Federal Open Market Committee (FOMC) Minutes may continue to shake up the near-term outlook for bullion as a bull-flag formation appears to be panning out.
Fundamental Forecast for Gold: Bullish
Gold breaks out of a narrow range as the 1.2% drop in U.S. Retail Sales along with the unexpected contraction in Industrial Production curbs the FOMC's scope to implement higher interest rates, and it seems as though the central bank will continue to change its tune over the coming months amid the weakening outlook for growth and inflation.

After accounting for the dismal data prints, the Atlanta Fed's 'GDPNow model estimate for real GDP growth (seasonally adjusted annual rate) in the fourth quarter of 2018 is 1.5 percent on February 14, down from 2.7 percent on February 6,' and signs of a more meaningful slowdown may continue to drag on interest-rate expectations as a growing number of Fed officials endorse a wait-and-see approach for monetary policy.
At the same time, the Fed appears to be on track to taper the $50B/month in quantitative tightening (QT) as Governor Lael Brainard indicates that the 'balance-sheet normalization process probably should come to an end later this year,' and it seems as though there's a growing consensus at the central bank to conclude the normalization cycle ahead of schedule amid the 'cross-currents' surrounding the economic outlook.
Looking for a technical perspective on Gold? Check out the Weekly Gold Technical Forecast.
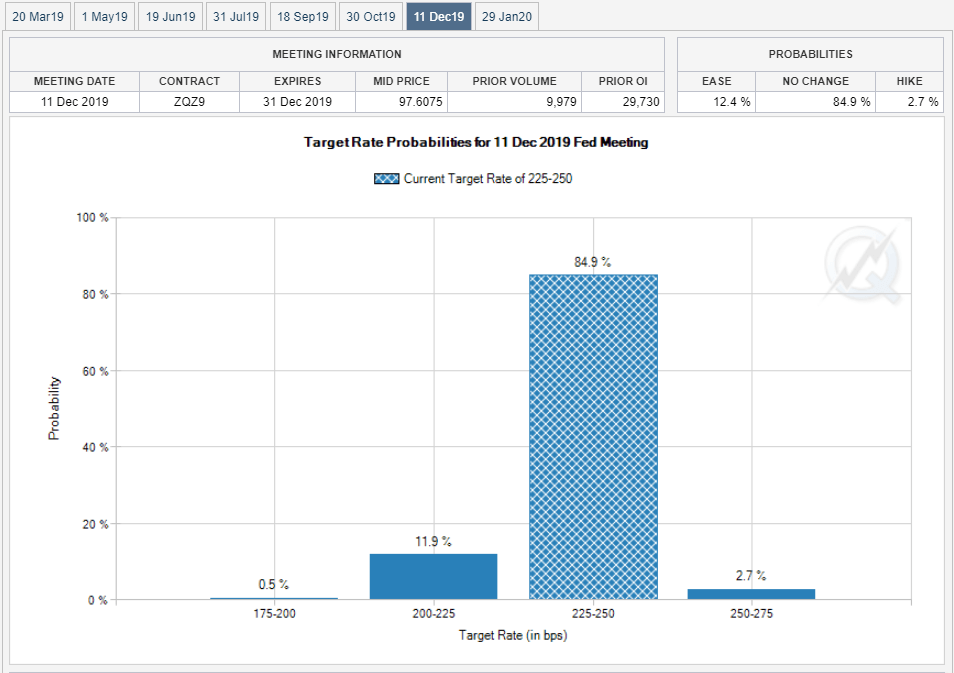
In turn, market participants may pay increased attention to the FOMC Minutes amid the material change in central bank rhetoric, and a further shift in the forward-guidance may heighten the appeal of gold especially as Fed Fund Futures shows the central bank on hold throughout 2019. With that said, gold may continue to exhibit a bullish behavior over the coming days, with the topside targets on the radar as the price and the Relative Strength Index (RSI)continue to track the upward trends from late-2018.Sign up and join DailyFX Currency Analyst David Song LIVE for an opportunity to discuss potential trade setups.
Gold Daily Chart
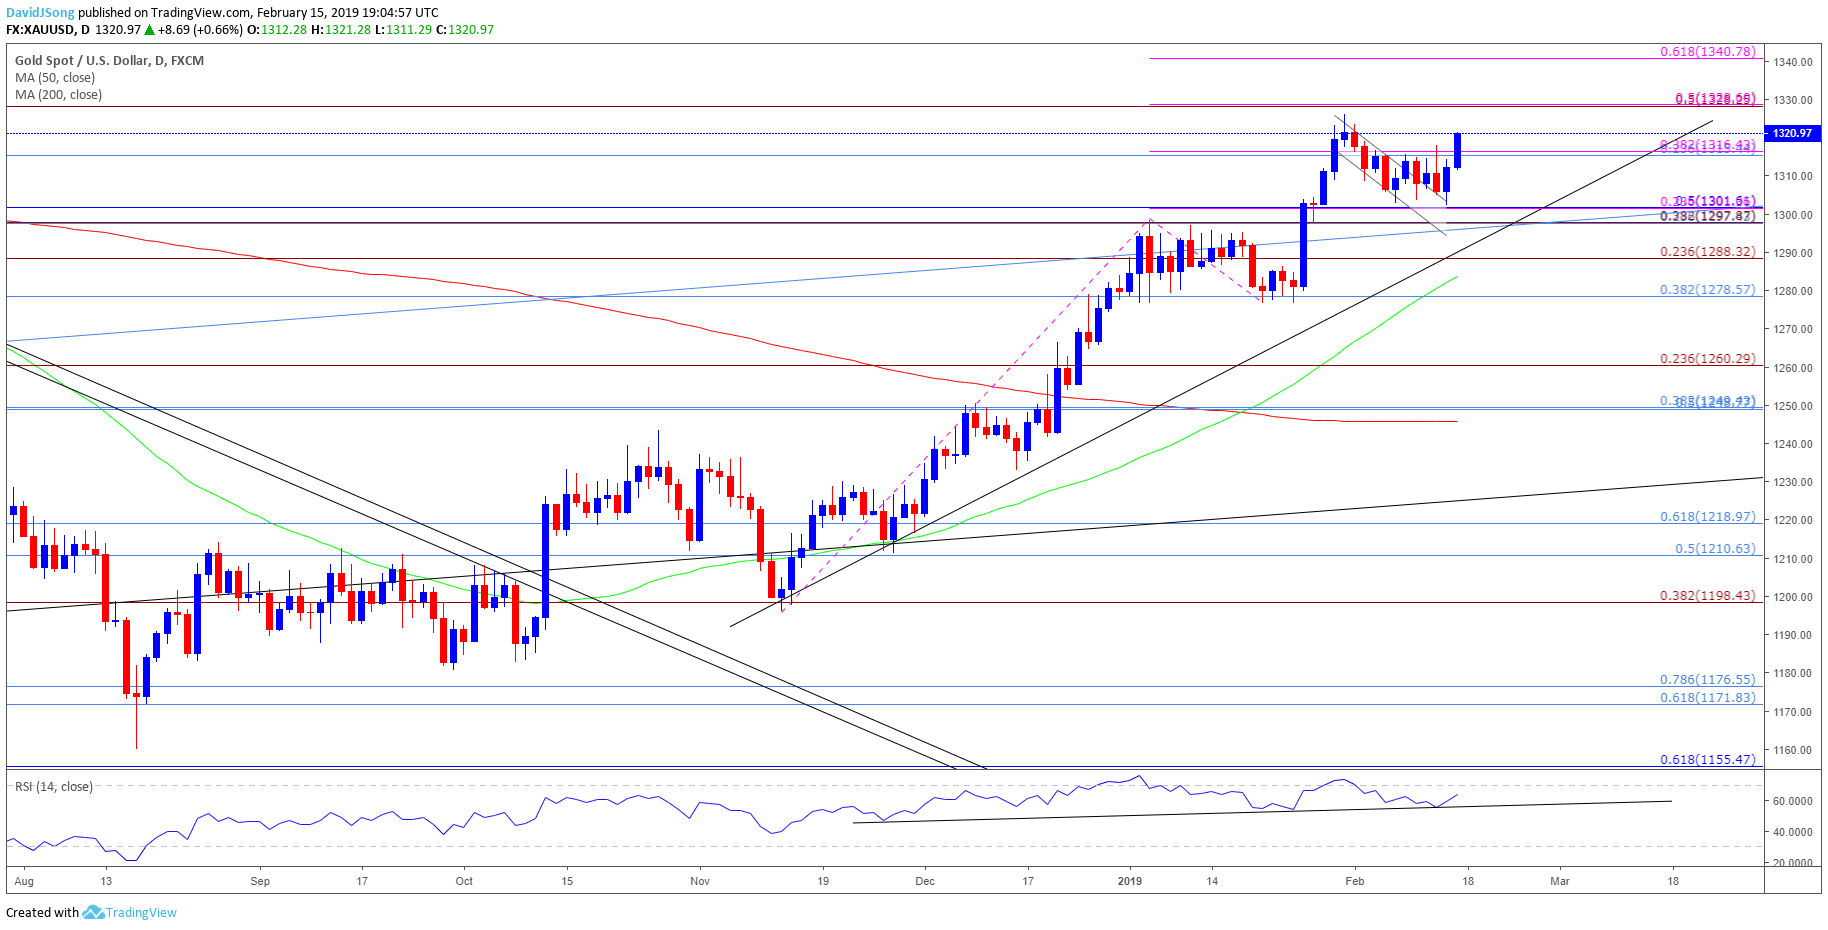
Gold appears to be on its way to test the 2019-high ($1326) as the former-resistance zone around $1298 (23.6% retracement) to $1302 (50% retracement) offers support, with the RSI highlighting a similar dynamic as it responds to trendline support. In turn, the $1328 (50% expansion) hurdle is back on the radar, with a break/close above the stated region opening up the $1340 (61.8% expansion) area.
Additional Trading Resources
Are you looking to improve your trading approach? Review the 'Traits of a Successful Trader' series on how to effectively use leverage along with other best practices that any trader can follow.
Want to know what other markets the DailyFX team is watching? Download and review the Top Trading Opportunities for 2019.
--- Written by David Song, Currency Analyst
Follow me on Twitter at @DavidJSong.
Other Weekly Fundamental Forecast:
Source link
Gold Technical Forecast: Neutral
- Gold prices made attempt to breach immediate resistance towards the end of last week
- XAU/USD fell short of resuming dominant uptrend, reinforcing 1323.60 as resistance
- Watch for fading upside momentum, may place gains at risk. Support at 1302.97 eyed
Find out what the #1 mistake that traders make is and how you can fix it!
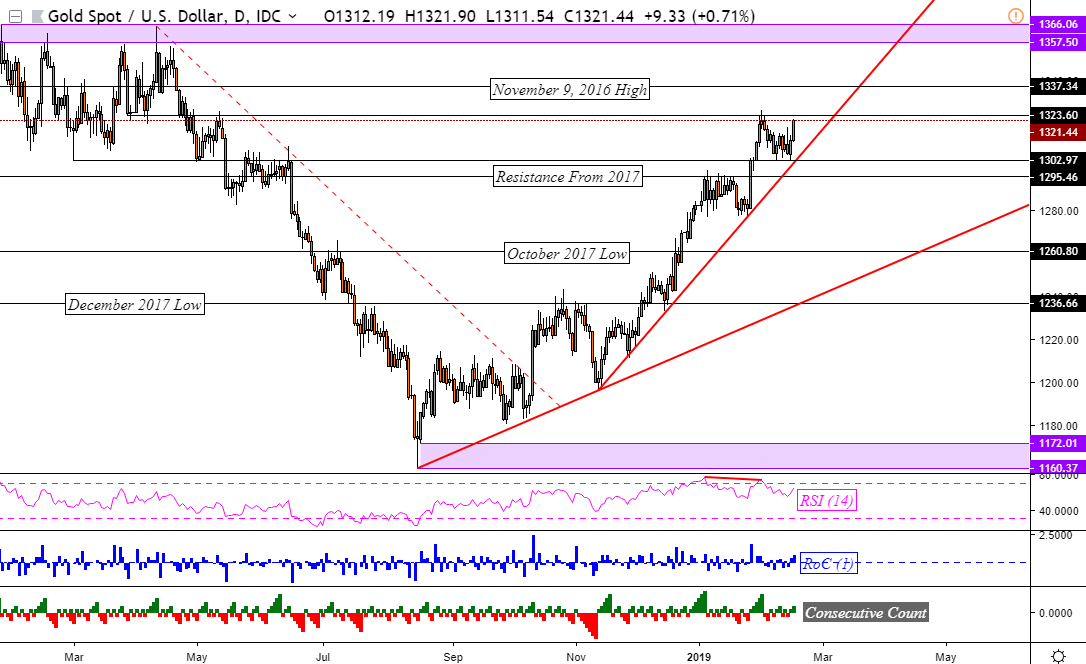
Aside from a small push higher towards the end of this past week, gold prices remained in congestion mode after topping around 1323.60. Gold's pause under this area occurred with fading upside momentum via negative RSI divergence. The rising trend line from November 2018 held alongside support at 1302.97 (the March 1, 2018 low). Prices were unable to breach 1323.60, further reinforcing it as immediate resistance.
Keep a close eye on RSI next week as XAU/USD may attempt another push above resistance. Fading upside momentum may remerge, undermining progress higher that the anti-fiat commodity may make. A push in that direction exposes the November 9, 2016 high at 1337.34. Ascending through it then exposes a range of resistance between 1357 – 1366.
Meanwhile, near-term support remains the rising support line from November. A descent through it exposes 1295.46 which is former resistance from 2017. Should this area be cleared, the next area of support may halt gold's descent around 1260.80 which is the October 2017 low.Taking all of this into consideration, the gold weekly technical outlook appears to be neutral.
Looking for a fundamental perspective on Gold? Check out the Weekly Gold Fundamental Forecast. Gold Daily Chart
Charts created in TradingView
FX Trading Resources
--- Written by Daniel Dubrovsky, Junior Currency Analyst for DailyFX.comTo contact Daniel, use the comments section below or @ddubrovskyFX on Twitter
Other Weekly Technical Forecast:
Australian Dollar Forecast – AUD/USD Eyes Resistance, AUD/NZD Resumes Fall, GBP/AUD May BounceOil Forecast – The 2019 Crude Bull Market Has Arrived
British Pound Forecast – GBPUSD & EURGBP
US Dollar Forecast – Dollar Within Reach of Two-Year High but Reversal Pressure High
Source link
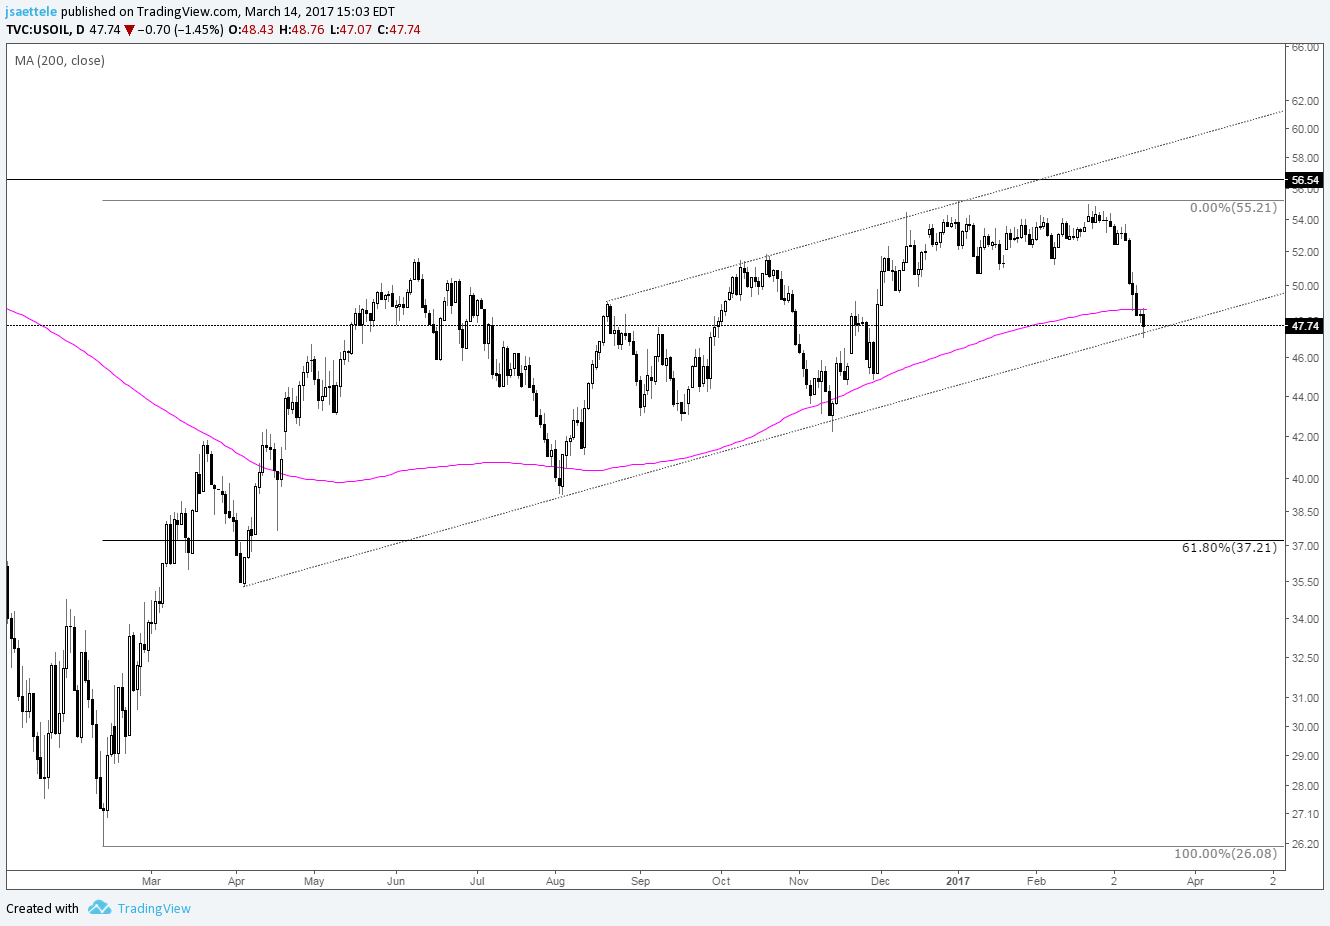
Chart Prepared by Jamie Saettele, CMT
DailyFX Trading Guides and Forecasts
-The last update remarked that "crude is crashing. The 200 day average is right here but the trendline is just above 47. If that doesn't hold, then 37 (61.8% of rally from February 2016 and August 2015 low) is probably in the cards." Low thus far is 47.07 so if crude isn't going to spill then it needs to turn up now. A close back above the 200 day average would be a positive sign (a la what happened in August and November).
Source link
Dollar Talking Points:
- The DXY Dollar Index gained modestly this past week, slowing the fastest climb since Oct's peak
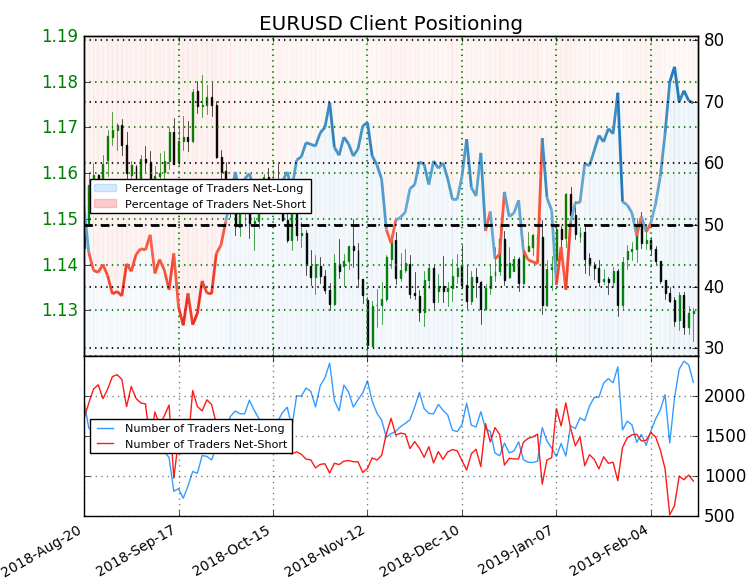
- Retail traders are heavily net long EURUSD – a short Dollar position
- See the 1Q 2019 fundamental and technical forecast for the Dollar updated on our trading guides page
Technical Forecast for US Dollar: Bearish
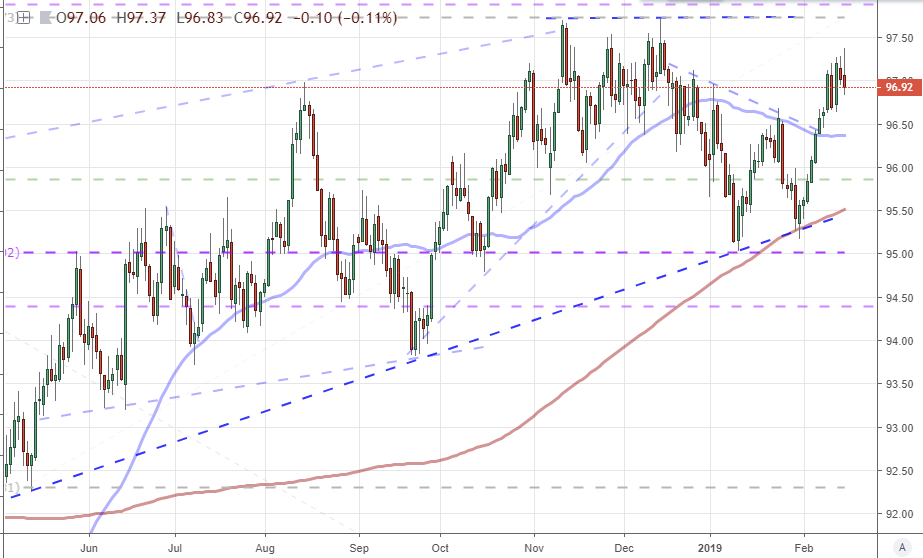
The Dollar eked out moderate gains through the past week if you used the DXY Dollar Index as your benchmark. That puts much of the responsibility behind this lift on the EURUSD which is the heaviest weighting in the index. Elsewhere, noteworthy – but still restrained – gains were made for the Dollar through GBPUSD and USDJPY. These account for the three most liquid majors in the Forex market accounting alone for more than half of all currency-to-currency transactions around the world. Naturally, their influence would readily offset the Greenback's losses against the likes of the Australian, New Zealand and Canadian Dollars. All told, however, the Dollar did not materially alter its bearings through the past week. It still falls comfortably within the rising trend channel stretching back over the past nine months. A bullish breakout will still require a move back to 97.75 (we end the week just below 97) and a true shift into a bear trend would come on a break of the same pattern's floor and the 200-day moving average around 95.50. Anything in between those bounds could qualify as a path-of-least-resistance range swing.
Chart of DXY Dollar Index with 50-Day and 200-Day Moving Average (Daily)
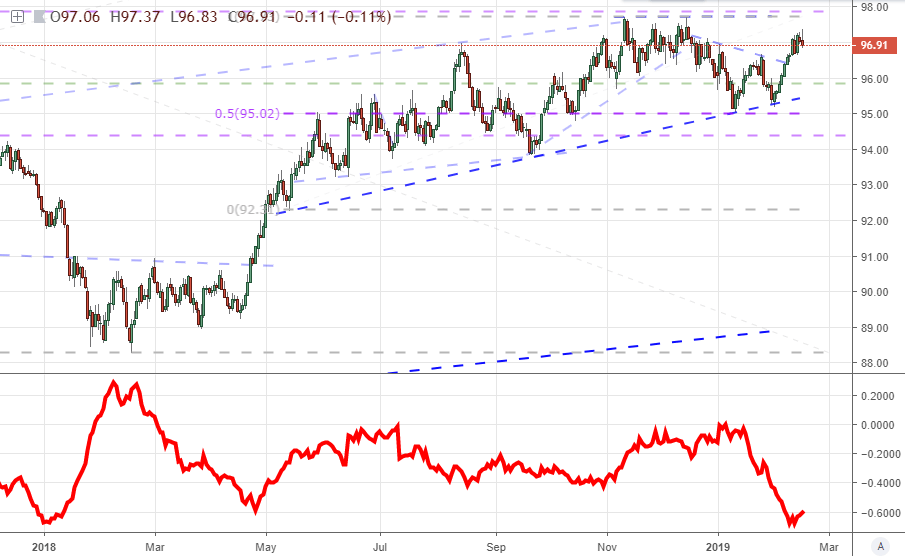
Adding perspective to the default range setting we registered in the past week's price action and the technical restrictions of the past months, the remarkable drop in priced-based activity has dropped to extreme levels. The 20-day (equivalent of one trading month) Average True Range, or ATR, for the DXY continues to hover around levels comparable to the 2017/2018 holiday season – and before that, there is no comparison until we stretch back to summer of 2014. While restricted volatility is to be expected given the range conditions we have experienced, this reading is extreme. And, extreme readings rarely last. Either market conditions are universally going to cool to levels commensurate with the complacency experienced in previous years of unchecked speculative reach, or the Dollar is going to see a charge in the near future. While breakouts are more likely to occur when activity levels are picking up, such an outcome is not a foregone conclusion.
Looking for a fundamental perspective on USD? Check out the Weekly USD Fundamental Forecast.
Chart of DXY Dollar Index with 20-Day Average True Range (Daily)
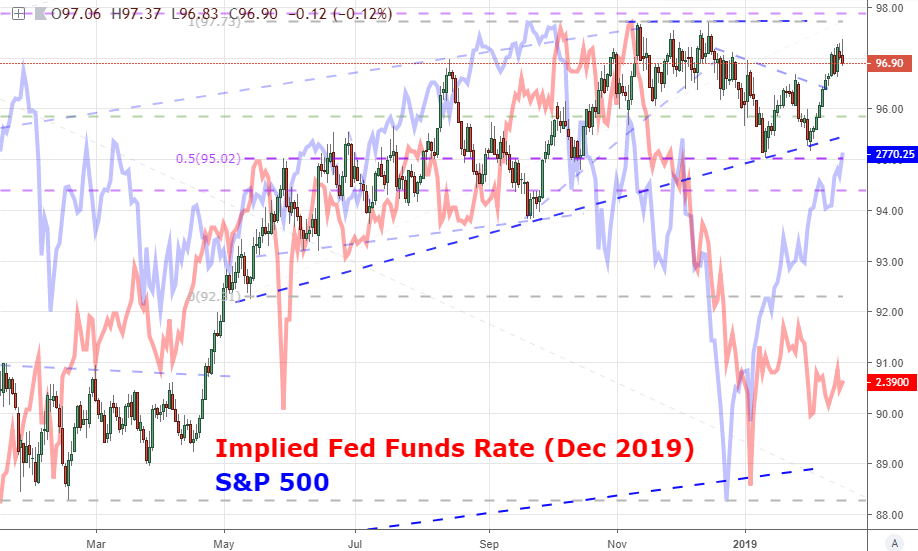
If we are looking for the motivations that could reasonably leverage volatility and sustain it – whether to the ends of a critical breakout/down or simply violent range swings – the movement will likely start with more critical fundamental themes. Keeping tabs on these motivations doesn't require a deep understanding of the economic calendar and abstract themes that are struggling for conviction (though if you want to learn how to trade news, you can read our guide on it). There are two general correlations that I am watching closely for guidance on the Dollar. In some ways, they are related. The implied yield forecast for Fed Funds futures is a measure of the outlook for 'income' return for the currency and thereby its appeal as a carry currency. Therefore, when risk appetite rises – as we would register from the S&P 500 as a reasonable baseline – the Dollar's appeal would be magnified. That said, as interest rate expectations struggle, the S&P 500's rally will have less pull for the Dollar. Yet, if equities were to drop, the disconnect would do little to dampen the negative impact on the currency itself. That puts greater fundamental influence – and volatility – behind bearish perspective.
Looking for a Fundemental perspective on the US Dollar? Check out the Weekly USD Fundemental Forecast. Chart DXY Dollar Index Overlaid with Fed Funds Implied Rate and S&P 500 (Daily)
One alternative, big-picture fundamental driver that could cater to the Dollar's further gains in a scalable way is the sustained broad decline in major USD counterparts. Should the Euro, Pound and Yen extend exceptional losses, the markets will generally move towards deeper liquidity. In that scenario, there is only one major counterpart that would fulfill the market's needs: the Dollar. What motivates a universal loss in currencies, which can be hidden in relative exchange rates? A dovish turn in global monetary policy, a ballooning debt/deficit amongst global leaders, even speculative leverage itself. If you want to keep tabs on this influence, there is a good barometer in the value of gold. The metal has proven itself a preferred alternative-to-traditional-fiat in previous years and cycles, and that role has not changed. Gold is usually priced in Dollars which can offer some skew, but the equally-weighted pricing of the commodity in Dollar, Euro, Pound and Yen below doesn't alter its course much.
Chart of Equally-Weighted Gold Index and 50-Day Moving Average (Daily)

As for the look at positioning behind the Dollar, there is a conflict between the short-term and medium-term intentions – not unsurprising given the months of channel we have carved out. From the futures-based COT report from the CFTC, the (still by four weeks) delayed reading has shown the heavy net long interest built up through 2018 is finally starting to deflate. That said, the shorter-term picture from retail FX positioning via IG clients shows a strong net long EURUSD (short Dollar) view that suits the range established just over the past few months. When range conditions prevail, the speculative view from the retail crowd tends to be more timely while a shift to genuine break and trend is where the slower-to-align futures positioning is often more aligned.
Chart of Net Speculative Positioning in Dollar Futures Positions from CFTC Report (Weekly)
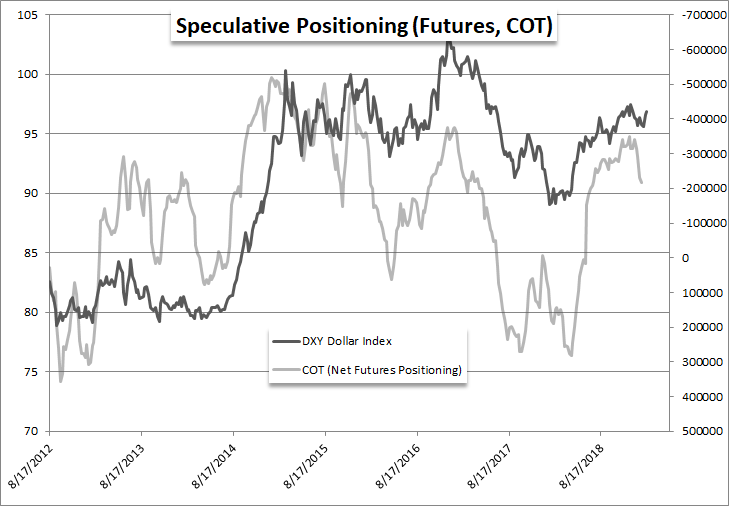
Chart of Retail Trader Positioning from IG Clients (Daily)
Other Weekly Technical Forecasts :
Australian Dollar Forecast – AUD/USD Eyes Resistance, AUD/NZD Resumes Fall, GBP/AUD May BounceOil Forecast – The 2019 Crude Bull Market Has Arrived
British Pound Forecast – GBPUSD & EURGBP
US DOLLARFUNDAMENTAL FORECAST: NEUTRAL
- US Dollar unable to hold up after touching six-week high
- Fundamental driver inconsistency leaves outlook clouded
- Risk trend conviction needed, January FOMC minutes due
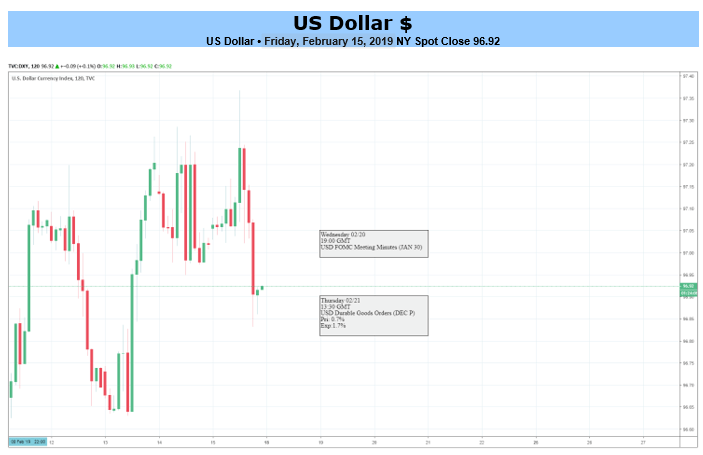
The US Dollar attempted to extend higher last week, touching a six-week high against an average of its major currency counterparts. The move would not prove lasting however, with prices erasing gains to finish Friday's session in essentially the same place as Monday's trade began.
Seesawing performance seems to reflect fundamental cross-currents competing for influence over the Greenback. It can find an appeal in a superior yield profile in risk-on trade or leverage its unrivaled liquidity to attract haven demand when the pendulum swings to a risk-off setting.
Sentiment trends need to remain at least somewhat consistent for either dynamic to build discernible traction. When that is not the case – and last week was a case in point for inconsistency – a clear-cut narrative with follow-on potential is difficult to divine.
The domestic front is unlikely to offer clarity in the week ahead. Minutes from January's FOMC meeting amount to the only bit of top-tier event risk, and they seem unlikely to offer much beyond the "wait-and-see" narrative that Fed officials have presented in a steady stream of recent commentary.
That means a decisive break is likely to need commitment from risk appetite. With mixed reviews of progress in US-China trade talks and reinforcement of global slowdown fears in recent data flow, the path of least resistance probably leans in favor of de-risking. If it can be sustained, USD might find fuel for gains.
Looking for a technical perspective on USD? Check out the Weekly USD Technical Forecast.--- Written by Ilya Spivak, Sr. Currency Strategist for DailyFX.com
US DOLLAR TRADING RESOURCES
OTHER FUNDAMENTAL FORECASTS:
Australian Dollar Forecast –May Head Lower If RBA Jawboning Starts AnewBritish Pound Forecast – Sterling Struggles as the Brexit Clock Ticks
Gold Forecast – Gold Bull-Flag Formation Continues to Unfold Ahead of FOMC Minutes
Source link
No longer interested email from Forex News 24?. Please click here to unsubscribe