Forex analysis review |
- Analysis of Gold for March 14, 2019
- March 14, 2019: EUR/USD Intraday technical levels and trade recommendations.
- EUR/USD analysis for March 14, 2019
- March 14, 2019: GBP/USD demonstrating hesitation around weekly high at 1.3250.
- Technical analysis of USD/CHF for March 14, 2019
- Technical analysis of EUR/USD for March 14, 2019
- Analysis of the divergence of EUR / USD for March 14. Euro currency showing stable growth
- Analysis of the divergence of GBP / USD for March 14. Strong growth of the pound was interrupted by two divergences at once
- Simplified Wave Analysis. Overview of Silver for the week of March 14
- Simplified Wave Analysis. Overview of GBP / JPY for the week of March 14
- Simplified Wave Analysis. Overview of AUD / USD for the week of March 14
- Wave analysis of GBP/USD for March 14
- Dollar predictably rebounded but sterling seems to have finished its big rally
- GBP / USD: British racing continues, the Brexit saga does not end
- EUR/USD wave analysis for March 14. Correctional rollback within wave b?
- Trading recommendations for the currency pair GBPUSD - placement of trading orders (March 14)
- Brexit: Show Must Go On
- Burning Forecast 03/14//2019
- Indicator analysis. Daily review for March 14, 2019 for the pair GBP / USD
- GBP/USD: plan for the European session on March 14. The British Parliament voted against a Brexit without a deal
- EUR/USD: plan for the European session on March 14. Demand for the euro slowed down significantly in the area of resistance
- Technical analysis for EUR/USD for March 14, 2019
- Indicator analysis. Daily review for March 14, 2019 for the pair EUR / USD
- Technical analysis for Gold for March 14, 2019
- Bitcoin Elliott Wave analysis for 14/03/2019
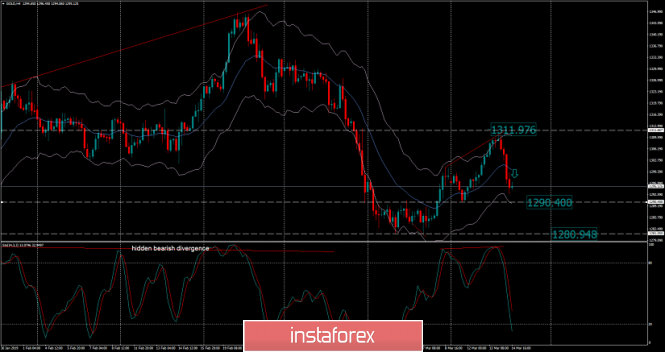
| Analysis of Gold for March 14, 2019 Posted: 14 Mar 2019 09:06 AM PDT Gold has been trading downwards. After the price reached our first target at $1.311.00, sellers came into the market and the momentum changed from bullish to bearish.
Resistance at the price of $1.311.00 held successfully, which caused to sellers to start selling. We found that bearish divergence on the the Stochastic oscillator H4 time – frame, which is another sign of the weakness. Resistance level is seen at the price of $1.311.00 and support levels at $1.290.00 and $1.280.95. Trading recommendation: We closed our long position yesterday on Gold at $1.311.00 with a decent profit. Now, we are neutral to bearish but we are awaiting potential bearish flag on the H1 time – frame, to establish sell positions. The material has been provided by InstaForex Company - www.instaforex.com |
| March 14, 2019: EUR/USD Intraday technical levels and trade recommendations. Posted: 14 Mar 2019 08:58 AM PDT
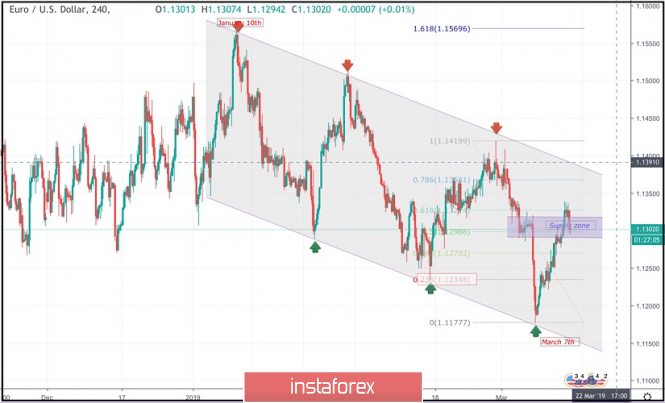
On January 10th, the market initiated the depicted bearish channel around 1.1570. The bearish channel's upper limit managed to push price towards 1.1290 then 1.1235 before the EUR/USD pair could come again to meet the channel's upper limit around 1.1420. Bullish fixation above 1.1430 was needed to enhance further bullish movement towards 1.1520. However, the market has been demonstrated obvious bearish rejection around 1.1430 That's why, the recent bearish movement was demonstrated towards 1.1175 (channel's lower limit) where significant bullish recovery was demonstrated on March 7th. Bullish persistence above 1.1270 (Fibonacci 38.2%) enhanced further bullish advancement towards 1.1290-1.1315 (the depicted supply zone) where bearish rejection was anticipated. However, negative fundamental data from US could push the EUR/USD pair for a temporary bullish breakout above 1.1315 before evident bearish rejection was demonstrated around 1.1335 earlier Today. This brought the EURUSD Pair again towards 1.1300 within the depicted supply zone. Bearish breakout below the price level of 1.1270 (38.2% Fibonacci) will probably liberate a quick bearish retraction towards 1.1160 again where the lower limit of the movement channel shall be tested again. On the other hand, another bullish breakout above 1.1330 will probably enhance further bullish movement towards 1.1370 and 1.1390. Trade recommendations : Risky traders should wait for a bearish H4. candlestick closure below 1.1275 as a valid SELL signal. T/P levels to be located around 1.1234 and 1.1177. SL to be located above 1.1350 The material has been provided by InstaForex Company - www.instaforex.com |
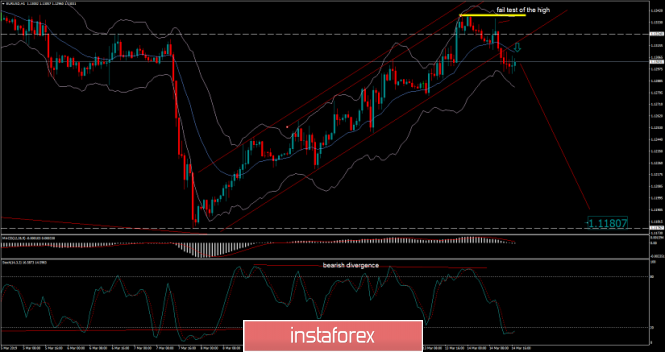
| EUR/USD analysis for March 14, 2019 Posted: 14 Mar 2019 08:35 AM PDT EUR/USD has been trading lower. The price tested the level of 1.1294.
After few days of the upward movement on the EUR/USD pair, buyers became overbought and the sellers started with the distribution process. According to the H4 time – frame, we found a breakout of the 4-day upward channel, which is a sign that there is potential for the downside movement. We also found a failed test of the high at the price of 1.1338, which is a sign of weakness. The Keltner channel turned bearish, which is another indication of the changing in trend behavior from bullish to bearish. Support levels are seen at 1.1277, 1.1248 and at 1.1180. Trading recommendation: We are bearish on EUR from 1.1300 and with main target at 1.1180. Protective stop is placed at 1.1345. The material has been provided by InstaForex Company - www.instaforex.com |
| March 14, 2019: GBP/USD demonstrating hesitation around weekly high at 1.3250. Posted: 14 Mar 2019 06:29 AM PDT
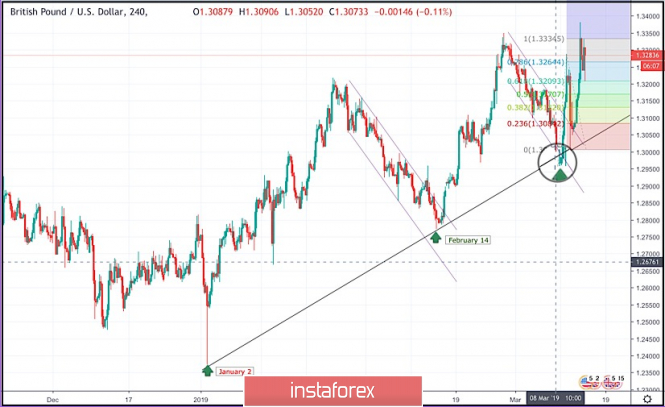
On January 2, the market initiated the depicted uptrend line around 1.2380. This uptrend line managed to push the price towards 1.3200 before the GBP/USD pair came to meet the uptrend again around 1.2775 on February 14. Another bullish wave had been demonstrated towards 1.3350 before the current bearish pullback occured towards the uptrend again. A weekly gap pushed the pair slightly below the trend line (almost reaching 1.2960). However, significant bullish recovery was demonstrated on Monday, having rendered the mentioned bearish gap as a false bearish breakout. Moreover, a short-term bearish channel was broken to the upside following the mentioned bullish recovery on Monday rendering the current outlook for the pair as bullish. As expected, bullish persistence above 1.3060 allowed the GBPUSD pair to pursue the bullish momentum towards 1.3130 then 1.3200. For the current bullish outlook to remain valid, bullish persistence above 1.3200 ( 61.8% Fibonacci expansion level ) is mandatory. Otherwise, the current bullish scenario would be invalidated. Moreover, bullish persistence above 1.3265 (78.6% Fibonacci expansion level) and 1.3333 ( 100% Fibonacci expansion level) is needed to pursue towards next bullish target around 1.3530 ( 161% Fibonacci expansion level). On the other hand , bearish breakout below 1.3170 (50% Fibonacci Exp. level) invalidates this bullish setup rendering the short term outlook bearish towards 1.3070-1.3050 where the depicted uptrend line comes to meet the GBPUSD pair. The material has been provided by InstaForex Company - www.instaforex.com |
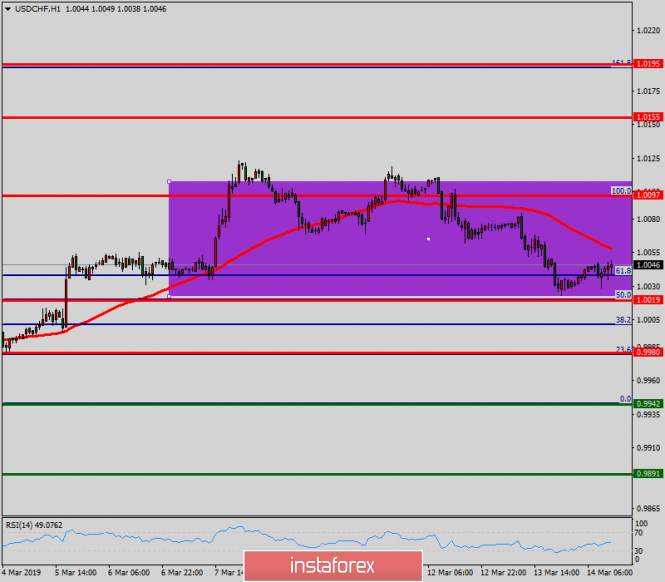
| Technical analysis of USD/CHF for March 14, 2019 Posted: 14 Mar 2019 04:43 AM PDT |
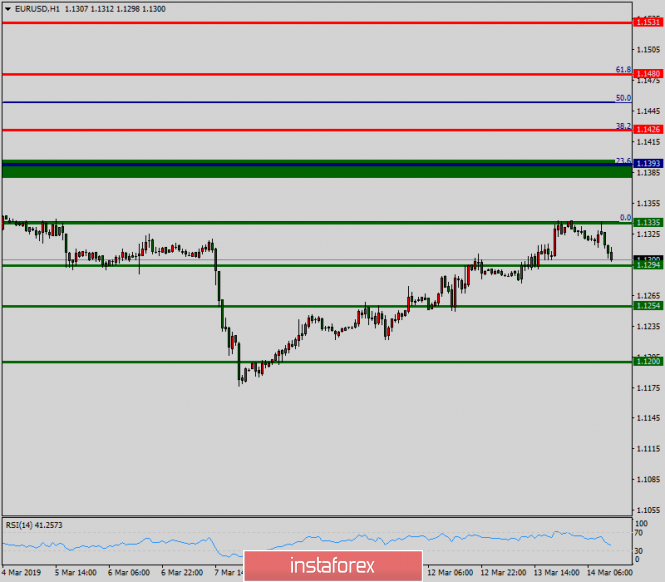
| Technical analysis of EUR/USD for March 14, 2019 Posted: 14 Mar 2019 04:39 AM PDT The EUR/USD pair below around the weekly pivot point (1.1393). It continued to move downwards from the level of 1.1393 to the bottom around 1.1335. Today, the first resistance level is seen at 1.1393 followed by 1.1426, while daily support 1 is seen at 1.1335. Furthermore, the moving average (100) starts signaling a downward trend; therefore, the market is indicating a bearish opportunity below 1.1393. So it will be good to sell at 1.1393 with the first target of 1.1335. It will also call for a downtrend in order to continue towards 1.1294. The strong daily support is seen at the 1.1254 level. According to the previous events, we expect the EUR/USD pair to trade between 1.1393 and 1.1254 in coming hours. The price area of 1.1393 remains a significant resistance zone. Thus, the trend is still bearish as long as the level of 1.1393 is not broken. On the contrary, in case a reversal takes place and the EUR/USD pair breaks through the resistance level of 1.1393, then a stop loss should be placed at 1.1453. The material has been provided by InstaForex Company - www.instaforex.com |
| Analysis of the divergence of EUR / USD for March 14. Euro currency showing stable growth Posted: 14 Mar 2019 03:53 AM PDT 4h The EUR / USD pair on the 4-hour chart completed closing above the correction level of 76.4% - 1.1299. The bearish divergence is canceled, and the growth process can be continued on March 14 in the direction of the correctional level of 61.8% - 1.1351. Rebounding the pair's quotes from the Fibo level of 61.8% will allow traders to expect a reversal in favor of the American currency and a slight drop in the direction of the correction level of 76.4%. Closing the pair below 76.4% will similarly work in favor of the US dollar and the beginning of the fall. The Fibo grid was built on extremes from November 12, 2018, and January 10, 2019. Daily On the 24-hour chart, the pair reversed in favor of the European currency and closed above the correction level of 127.2% - 1.1285. As a result, the growth process can be continued in the direction of the next Fibo level of 100.0% - 1.1553. The ripening divergences today are not observed in any indicator. Fixing quotations below the Fibo level of 127.2% can be interpreted as a reversal in favor of the US currency and expect a resumption of the fall in the direction of the correction level of 161.8% - 1.0941. The Fibo grid is built on extremums from November 7, 2017, and February 16, 2018. Recommendations to traders: Purchases of the EUR / USD pair can be made now with the goal of 1.1351, as the pair completed closing above the level of 1.1299, and a Stop Loss order under the correction level of 76.4%. Sales of the EUR / USD pair can be made with the target of 1.1216 if the pair closes below the level of 1.1299, and a Stop Loss order above the Fibo level of 76.4%. The material has been provided by InstaForex Company - www.instaforex.com |
| Posted: 14 Mar 2019 03:53 AM PDT 4h The pair GBP / USD on the 4-hour chart completed a return to the correctional level of 100.0% - 1.3300. A bearish divergence was formed in the CCI indicator, which allows traders to count on a turn in favor of the American dollar and a slight drop in the direction of the correction level of 76.4% - 1.3094, and also increases the rebound probability from the Fibo level 100.0% - 1.3300. Closing the pair above the peak of the divergence and the level of 100.0% will increase the likelihood of further growth of quotations in the direction of the next correction level of 127.2% - 1.3530. The Fibo grid is built on extremums from September 20, 2018, and January 3, 2019. 1h On the hourly chart, the pair completed growth to the correction level of 100.0% - 1.3349 on the new Fibo grid, bounce back and turn in favor of the American currency, falling and closing below the Fibo level of 76.4% - 1.3257. As a result, on March 14, the process of falling quotations can be continued in the direction of the correctional level of 61.8% - 1.3202. The bearish divergence of the MACD indicator increases the pair's chances of continuing the fall. Closing the rate of the pair above the Fibo level of 76.4% will work in favor of the British currency and the resumption of growth in the direction of the correction level of 100.0%. The Fibo grid is built on extremes from February 14, 2019, and February 27, 2019. Recommendations to traders: New purchases of the GBP / USD pair can be made with the target of 1.3349 and a Stop Loss order below the level of 76.4% if the pair closes above the level of 1.3357 (hourly chart). Sales of the GBP / USD pair can be carried out now with a target of 1.3202 and a Stop Loss order above the level of 76.4%, as the pair completed closing at 1.3357 (hourly chart). The material has been provided by InstaForex Company - www.instaforex.com |
| Simplified Wave Analysis. Overview of Silver for the week of March 14 Posted: 14 Mar 2019 03:52 AM PDT Large TF: In the main downward wave of the instrument since April of last year, the oncoming wave of correction has been developing. Wave analysis indicates the formation of the middle part (B). Small TF: The bearish wave of January 4th develops as a stretched plane. The wave has a complete structure. The ascending segment of March 7 has a high wave level and may become the first part of the reversal pattern. Forecast and recommendations: The downward trend of recent weeks may be replaced by the growth rate of the course in the current month. Potential turn down almost exhausted. Traders are advised to change the vector of trading operations and start tracking reversal signals to search for entry into "long" deals. Resistance zones: - 16.20 / 16.50 Support areas: - 14.80 / 14.50 Explanations for the figures: The simplified wave analysis uses waves consisting of 3 parts (A – B – C). On each of the considered scales of the graph, the last, incomplete wave is analyzed. Zones show calculated areas with the highest probability of reversal. The arrows indicate the wave marking by the method used by the author. The solid background shows the formed structure, the dotted - the expected movement. Note: The wave algorithm does not take into account the duration of tool movements over time. To conduct a trade transaction, you need confirmation signals from your trading systems! The material has been provided by InstaForex Company - www.instaforex.com |
| Simplified Wave Analysis. Overview of GBP / JPY for the week of March 14 Posted: 14 Mar 2019 03:52 AM PDT Large TF: By the totality of signs, the downward wave dominating all of last year ended, giving way to a new ascending phase in the weekly scale model. Small TF: The bullish wave of January 3 is developing in a pulse pattern. The first 2 parts are formed in its structure. The correction has the form of a hidden, irregularly shaped structure, which ended on March 11. Then the final part (C) began to form. Forecast and recommendations: Before further breakthrough, the probability of a short-term retracement is high. Given the general impulsive nature of the movement, a further decrease than the calculated zone is unlikely. It is recommended to pay attention to the pair buy signals. Resistance zones: - 149.40 / 149.90 Support areas: - 145.70 / 145.20 Explanations for the figures: The simplified wave analysis uses waves consisting of 3 parts (A – B – C). On each of the considered scales of the graph, the last, incomplete wave is analyzed. Zones show calculated areas with the highest probability of reversal. The arrows indicate the wave marking by the method used by the author. The solid background shows the formed structure, the dotted - the expected movement. Note: The wave algorithm does not take into account the duration of tool movements over time. To conduct a trade transaction, you need confirmation signals from your trading systems! The material has been provided by InstaForex Company - www.instaforex.com |
| Simplified Wave Analysis. Overview of AUD / USD for the week of March 14 Posted: 14 Mar 2019 03:52 AM PDT Large TF: For the past year, the price of the Australian major has moved down. Analysis of the trend wave shows that the price growth of recent months should take the place of correction in the structure. Small TF: The bullish wave started on January 3. The wave has a reversal potential. To date, it is nearing completion of the middle part of the structure (B). A preliminary zone of probable completion has been reached, but no change in heading signals has yet been formed. Forecast and recommendations: The period of flat lull may be replaced by the beginning of the price increase already in the coming week. Until the end of the month, a general uptrend is expected, which supporters of the "bullish" strategy can use. Before opening buy orders, you must wait for confirming signals from the market. Resistance zones: - 0.7340 / 0.7390 - 0.7180 / 0.7230 Support areas: - 0.7050 / 0.7000 Explanations for the figures: The simplified wave analysis uses waves consisting of 3 parts (A – B – C). On each of the considered scales of the graph, the last, incomplete wave is analyzed. Zones show calculated areas with the highest probability of reversal. The arrows indicate the wave marking by the method used by the author. The solid background shows the formed structure, the dotted - the expected movement. Note: The wave algorithm does not take into account the duration of tool movements over time. To conduct a trade transaction, you need confirmation signals from your trading systems! The material has been provided by InstaForex Company - www.instaforex.com |
| Wave analysis of GBP/USD for March 14 Posted: 14 Mar 2019 03:23 AM PDT Wave analysis: On March 13, the GBP/USD pair rose by 250 pips, which resulted from two UK parliament votes. First, the parliament did not approve the agreement reached by Theresa May with the European Union. Second, the tough Brexit scenario was also rejected. Such a market reaction can hardly be called logical, but most traders expected strong movements in the pair. The current wave count should be updated amid such movements. Today, another parliamentary vote will be held on postponing the exit from the EU, and thus, the pair might end up with strong movements in different directions. Based on the wave pattern, we can expect the pair to rise within wave c at Y. Upward targets: 1.3350 - 100.0% Fibonacci 1.3454 - 127.2% Fibonacci Downward targets: 1.2961 - 0.0% Fibonacci General conclusions and trading recommendations: The wave count has changed and now involves construction of an upward wave with targets located near the pivot points of 1.3350 and 1.3454, which corresponds to 100.0% and 127.2% Fibonacci levels. However, after today's vote in the British Parliament, the pair may show sharp movements, so the need to update the wave count can arise again. The material has been provided by InstaForex Company - www.instaforex.com |
| Dollar predictably rebounded but sterling seems to have finished its big rally Posted: 14 Mar 2019 03:20 AM PDT The dollar rebounded from a nine-day low as expected due to a sharp drop in the pound after rising against the background of a positive against Brexit. It sank when the pound jumped more than 2 percent after British lawmakers voted against withdrawing from the EU without a deal. However, later the "American" was able to compensate for the losses and even rose against the yen by 0.35 percent to 111.53 yen, after losing 0.2 percent a day before. On the contrary, the pound slightly rolled back after steep growth in the previous session. Currently, the market wants to know how the process of transferring the UK's exit date from the EU will go and get an idea of the exact date, while it is expected that the British legislators will vote today for the transfer of Brexit scheduled for March 29. The Australian dollar continued to give up its position and apparently not be able to find reliable support in the near future. The currency lost 0.35 percent, dropping to $ 0.7068, due to a sharp decline in domestic bond yields and the largely weak economic data of China, which is Australia's main trading partner. Industrial output growth in China fell to the slowest rate in 17 years in January-February, although investments in fixed assets and retail sales in the world's second-largest economy were stronger than expected. |
| GBP / USD: British racing continues, the Brexit saga does not end Posted: 14 Mar 2019 03:20 AM PDT On the eve of the deputies of the House of Commons, they voted against the UK withdrawal from the EU without an agreement. After the British parliamentarians virtually eliminated the "hard" version of Brexit, the pound sterling rate first jumped sharply against the dollar but then returned to its original positions. Apparently, market participants were inclined to expect such a decision by lawmakers and the pound became hostage to the "buy on rumor and sell on the facts" strategy and feeling the effect of profit taking. Now, the pound is again trying to strengthen against the dollar. Today, British lawmakers are to vote for the postponement of the date Brexit, scheduled for March 29. As for Prime Minister Theresa May, she still intends to fight for her version of the deal and next week there will probably be a third attempt to conduct it through the House of Commons. The head of government has already said that if the deal cannot be agreed by March 20 on the eve of the next EU summit), then it will be necessary to extend Article 50 of the Lisbon Treaty for a longer period. It is possible that Theresa May's warning about a long delay is a kind of tactical move aimed at convincing the Brexit supporters from the Conservative Party and their allies in the Democratic Unionist Party to support the deal before it is too late. "The clarity about what is actually happening around Brexit, was not much more than yesterday," said Westpac currency strategists. "The most likely scenarios are the passage of a deal promoted by Teresa May through parliament in the future or a new referendum. Which of these two scenarios is being implemented - it will become clear already this week, "experts told ABN Amro. Goldman Sachs experts believe that the extension of the Brexit deadline will be good news for the pound because it will create the conditions for maintaining close relations between the UK and the EU. "We expect a rally of pounds to 3-year highs if the Brexit postponement step opens the door to softer results, which include joining a customs union, membership in a single market or a repeated referendum, although there are still risks including a growing likelihood general election" they said. The material has been provided by InstaForex Company - www.instaforex.com |
| EUR/USD wave analysis for March 14. Correctional rollback within wave b? Posted: 14 Mar 2019 03:11 AM PDT
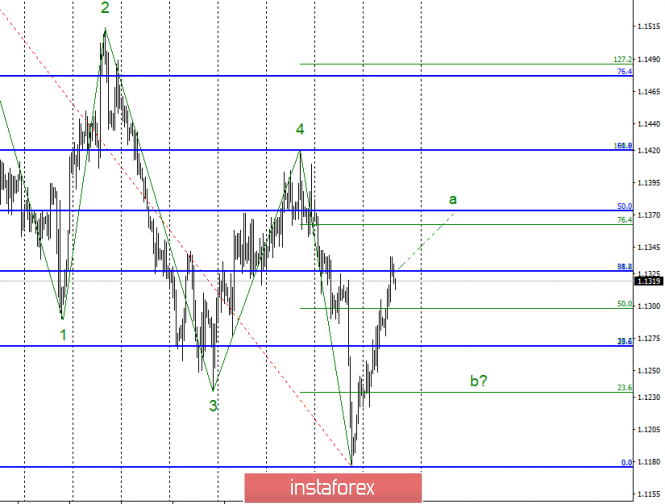
Wave counting analysis: On Wednesday, March 13, trading ended for EUR/USD with another 40 bp increase. Thus, the tool continues to build the estimated wave of a new uptrend. However, there was an unsuccessful attempt to break through the level of 38.2% in the older Fibonacci grid which suggests that the pair is ready for the quotes to depart from the maximums reached or to build a correctional wave b. At the same time, a breakthrough of the 1.1326 level of 1.1326 will indicate that the pair is ready to continue raising quotes. The news background for the pair remains neutral, as there is simply no news right now. Sell targets: 1.1269 - 38.2% Fibonacci (small grid) 1,1234 - 23.6% Fibonacci (small grid) Buy targets: 1.1326 - 61.8% Fibonacci 1.1362 - 76.4% Fibonacci General conclusions and trading recommendations: The pair presumably continues to build the first wave of the new trend segment. Now I recommend waiting for the breakout of the mark of 1.1326 and buying a pair with targets located near the mark of 1.1362. Also, I recommend to increase purchases near the minima of wave b, the probability of the start of construction of which is now also available. The material has been provided by InstaForex Company - www.instaforex.com |
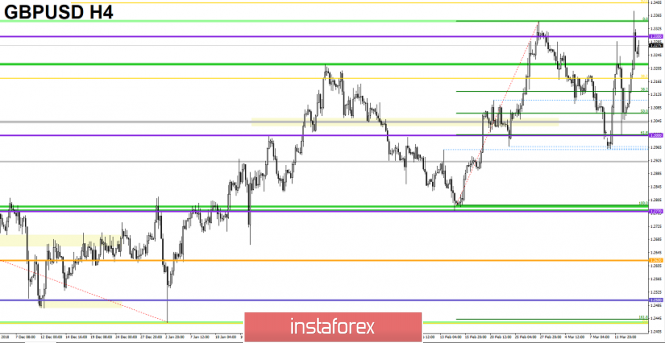
| Trading recommendations for the currency pair GBPUSD - placement of trading orders (March 14) Posted: 14 Mar 2019 02:04 AM PDT For the third day in a row, the currency pair Pound / Dollar pleases speculators with mega-volatility, having 318 points of progress yesterday! From the point of view of technical analysis, it is quite difficult to explain everything that is happening, the only thing that can be noticed is that the quote has an amplitude between two strong range levels of 1.3000 and 1.3300. Information background around the head, is now orderly placed. As expected, yesterday's vote in the British Parliament voted against the country's withdrawal from the EU without a deal with Brussels. This news is positively played on the English currency in the form of an upward rally. In turn, Theresa May partially lost control of the British Cabinet, as evidently shown by the voting results in the House of Commons for the country's withdrawal from the European Union without a deal.
Since the next vote in the UK parliament is expected, the "circus tent" will continue to please the speculators for today. Regarding the postponement of the country's withdrawal from the EU, the expected postponement is until June 30, whereas the initial date was March 29. This news, of course, will positively affect the English currency. Of course, in the event of a delay, there is an assumption that the last vote (March 13) and its subsequent impulse movement has taken into account the current vote (March 14). However, it is still not necessary to exclude increased volatility. Further development Analyzing the current trading chart, we see impulse candles, where the quotation for time has reached the value of 1.3379. After which, it is logical to roll back below the level of 1.3300. Probably, it is safe to assume a temporary wagging within the level of 1.3300, and then we look at the market reaction to the postponement. Traders still do not exclude that, the pound will still be able to stretch upward, as shown on the information background. But, after that, they will expect a bold correction.
Based on the available data, it is possible to decompose a number of variations, let's consider them: - Consider buy positions in the case of leveling and fixing higher than 1.3330, with a prospect of 1.3400. - Consider positions for sale tomorrow, well, or at least by the end of the day, when we will see how the quote behaves. Nobody excludes selling positions. They are even waiting. There remains a very strong overheating. Meanwhile, there is nothing good in Britain except that all the problems remained. Now, we have just speculative positions. Indicator Analysis Analyzing a different sector of timeframes (TF ), we see that in the short, intraday and medium term indicators are upturned due to impulse leaps. Weekly volatility / Measurement of volatility: Month; Quarter; Year Measurement of volatility reflects the average daily fluctuation, with the calculation for the Month / Quarter / Year. (March 14, was based on the time of publication of the article) The current time volatility is 85 points, which is not a low value for a given time segment. It is likely to assume that due to the hype on the information background, volatility will remain at a high level. Key levels Zones of resistance: 1.3300 **; 1.3440; 1.3580 *; 1.3700 Support areas: 1,3200 *; 1.3130 *; 1.3000 ** (1.3000 / 1.3050); 1.2920 *; 1.2770 (1.2720 / 1.2770) **; 1.2620; 1.2500 *; 1.2350 **. * Periodic level ** Range Level The material has been provided by InstaForex Company - www.instaforex.com |
| Posted: 14 Mar 2019 02:00 AM PDT In recent days, traders of the GBP/USD currency pair begins not with coffee in the morning but with an examination of the operational situation around Brexit. The situation is changing with kaleidoscopic speed, as well as the mood of the markets. Yesterday evening, the pair grew rapidly, climbing to the 34th figure and renewing the annual maximums but the pound lost ground already during the Asian session and loosened the bullish grip. To this morning, the situation has changed again and the Briton is recovering. Buyers again provoke strong volatility in response to rumors appearing yesterday. We are talking about an article in one of the most influential British newspapers. According to this publication, the postponement of Brexit will only increase the likelihood of Britain leaving the EU without a deal. The fact is that yesterday's vote only reflects the intentions of the parliament, but is not binding. Therefore, the "hard" Brexit is still possible, which is very likely. According to journalists, Brussels is very categorically disposed towards further relations with London with no negotiations and not ending. Moreover, according to the European newspapers report, the European Union is currently developing penalties for Britain as compensation for accepting a postponement of Brexit. Brussels can raise the cost of leaving the European Union to 39 billion pounds equivalent to 45 billion dollars for the very fact of the transfer of the "x-hour". Against the background of such prospects, yesterday there was information on the market that Theresa May is preparing a second, third in a row, vote for a draft deal with the EU. According to unofficial data, the prime minister holds closed meetings with the most influential conservatives, trying to convince them to vote for the agreement. The unexpected uncertainty put pressure on the pound, although this pressure was rather limited. At the end of the Asian session, the GBP/USD pair did not leave the frame of 32 figures, departing only from the price maximum of this year at1.3379. But in general, optimism quickly changed to alertness since the problem of negotiation deadlock, by and large, did not disappear anywhere. The results of yesterday's voting are also alarming where the numerical superiority of opponents of the "hard" Brexit over the supporters of the chaotic divorce from the European Union was minimal with a "gap" of only four votes. Although, according to some British political scientists, this fact should be considered from the point of view that the parliamentary decision was of a recommended nature. Therefore, such a large number of votes cast for the "hard" Brexit, testifies rather to the attitude of these deputies to the activities of Theresa May. If parliament really put an end to the dilemma of "with or without a deal", the picture of the vote would have been different, at least many experts are sure of it. Also, note one important nuance. The Cabinet of Ministers introduced to the vote a bill proposing to exclude the possibility of exit without a deal only on March 29. However, the deputies voted for the amendment, which prohibits the "hard" Brexit at all ever. The adopted rule does not have the force of direct action that is, hypothetically, the government can act in its own way but the reality of political relations in Britain such that the cabinet of ministers is unlikely to ignore the opinion of the parliamentary majority. In my opinion, the GBP/USD pair still has the potential for further growth which in both cases of postponement of Brexit and especially in the case of repeated voting for the rejected draft of the transaction. The initial reaction of the British currency in both cases will be positive, while the medium and long-term prospects of the pound depending on further actions of Brussels. It is worth recalling that, since the previous vote May was able to "win over" 40 conservatives to their side, who voted against the deal in January. Seventy-five (75) representatives of the Tories did not change their opinions and apparently, the British Prime Minister is negotiating with the "internal opposition." Thus, the "operational environment" around Brexit now looks like this. Today, the deputies are likely to agree to postpone the date of the country's withdrawal from the EU based on the preliminary data on June 30. At the same time, Theresa May will again submit a draft deal to parliament with the vote to take place on March 20, according to press information. If the House of Commons fails for the third time, Brussels will insist on a longer transfer of Brexit either until the end of next year or until mid-2021. According to British ministers, such intentions are supported by Theresa May. Moreover, she allegedly warned the Conservatives that the country would remain "in a swamp of uncertainty" for a few more years if they did not support the agreement for the third time. By and large, all of the above scenarios eliminate the "hard" Brexit, which means that the GBP/USD pair has the potential to test the price highs of this year again. The material has been provided by InstaForex Company - www.instaforex.com |
| Posted: 14 Mar 2019 01:18 AM PDT The pound, followed by the euro, experienced a period of growth on the news on Brexit. The British Parliament rejected the agreement with the EU for the last time on March 12, and on March 13 voted against Britain's withdrawal from the EU without a deal. Today, March 14, the Parliament will vote on the issue of postponing Brexit-for a long time-and, very likely, this option will be adopted. As a result, Brexit will be postponed for a long time - and this is a positive for the markets. The EURUSD completely blocked the growth of the fall, which followed the ECB's decision to launch a new liquidity injection cycle. Now, an attempt at an upward trend looks more likely - but for now we have a return to the range. We are ready to take a position on the trend when you exit the range: We are ready to buy the euro at a breakthrough of 1.1425. We are ready to sell the euro at a break of 1.1175 downwards. |
| Indicator analysis. Daily review for March 14, 2019 for the pair GBP / USD Posted: 14 Mar 2019 01:12 AM PDT Trend analysis (Fig. 1). On Thursday, there is a high probability of an upward movement. The first upper target 1.3432 is the resistance line of the ascending channel (yellow thin line). Fig. 1 (daily schedule). Comprehensive analysis: - indicator analysis - up; - Fibonacci levels - up; - volumes - up; - candlestick analysis - down; - trend analysis - up; - Bollinger lines - up; - weekly schedule - up. General conclusion: On Thursday, there is a high probability of an upward movement. The first upper target 1.3432 is the resistance line of the ascending channel (yellow thin line). The material has been provided by InstaForex Company - www.instaforex.com |
| Posted: 14 Mar 2019 01:12 AM PDT To open long positions on GBP/USD you need: Yesterday, the British Parliament voted against the Brexit scenario without a deal, which led to the pound's growth. A vote on the extension of the exit from the EU will be made today. You need to be very careful with long positions on the pound. Buyers need a breakthrough and consolidation above the level of 1.3286, which will lead to growth in the area of a high of 1.3329, where I recommend taking profits. The main task of the bulls will be the test of resistance of 1.3375, which will increase the chance for a continuation of the uptrend. However, a more optimal buying scenario would be a correction of the pound to the support area of 1.3216 and 1.3155. To open short positions on GBP/USD you need: Bears will emerge from the resistance level of 1.3286, or you can open short positions immediately to rebound from a high of 1.3329. Sellers will try to return the pair to the support of 1.3216, at the first test of which a good upward rebound will occur. However, when GBP/USD falls again to this level, you can increase short positions in order to update the low of 1.3155, where I recommend taking profits. Indicator signals: Moving averages Trading takes place above the 30-day and 50-day moving averages, but with current volatility, this is not a signal to buy. Bollinger bands If the pound falls, support will be provided by the lower limit of the Bollinger Bands indicator around 1.3155. An upward trend will limit the upper limit of the indicator in the area of 1.3329, where you can open short positions immediately to a rebound. Description of indicators
|
| Posted: 14 Mar 2019 01:06 AM PDT To open long positions on EURUSD you need: Euro buyers should be careful as the uptrend slows down. It is best to return to long positions after a correction and the formation of a false breakdown in the support area of 1.1303 or to rebound from a low of 1.1278. Good inflation data in Germany and Italy can support the euro, which will lead to the test of resistance of 1.1338, but I do not recommend you to buy the breakdown there, since it is possible to form a divergence on the MACD indicator, which will limit the upward potential. A second test and consolidation above 1.1338 by the second half of the day will be a signal to buy with a target of 1.1368 and 1.1405. To open short positions on EUR USD it is required: Bears will count on another unsuccessful attempt to break the resistance of 1.1338, with the formation of divergence on the MACD indicator, which can lead to a downward correction to the area of 1.1303 and 1.1278, where I recommend taking profit. In case of good inflation data in Germany and Italy, the growth of EUR/USD may continue, in this scenario, it is best to return to short positions against the trend by rebounding from a high of 1.1368. Indicator signals: Moving averages As long as trading is above the 30-day and 50-day moving averages, the demand for the euro will continue. Bollinger Bands The growth of the euro may be limited by the upper border of the Bollinger Bands indicator in the area of 1.1338, while the breakthrough of the lower border of the indicator in the area of 1.1295 will be a signal to sell the euro. Description of indicators
|
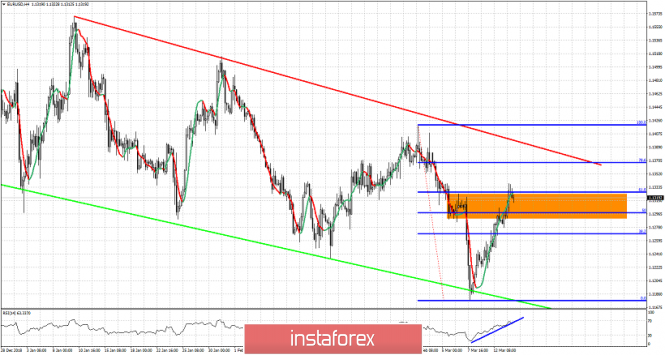
| Technical analysis for EUR/USD for March 14, 2019 Posted: 14 Mar 2019 12:57 AM PDT EUR/USD is inside the major resistance area and at the important Fibonacci 61.8% retracement level. Besides, the pair is now at a possible reversal area. As long as it holds above 1.13, then chances for a move towards 1.1390 are high.
Green line - support trend line Orange rectangle - resistance area Blue line - RSI support trend line EUR/USD is trading at the top of our resistance area and at the 61.8% Fibonacci retracement level. This is an important resistance. The support is at 1.13-1.1290 and the next one is at 1.1240. Bears need to see a reversal from the current levels and start a new sequence of lower lows and lower highs that will eventually break 1.1240 for a move towards 1.11. Bulls, on the other hand, need to break above the red major trend line resistance in order to be more confident of a medium-term trend change to bullish and a possible move towards 1.17. The RSI is holding above its support trend line and has still not entered overbought levels. Medium-term trend remains bearish and I continue to consider the bounce as a selling opportunity as long as the price is below the red trend line. The material has been provided by InstaForex Company - www.instaforex.com |
| Indicator analysis. Daily review for March 14, 2019 for the pair EUR / USD Posted: 14 Mar 2019 12:57 AM PDT Trend analysis (Fig. 1). On Thursday, the price may roll back down (the last three white candles on the falling volumes are very strong signals down the candlestick analysis). The first lower target of 1.1301 is the pullback level of 23.6% (yellow dotted line). Fig. 1 (daily schedule). Comprehensive analysis: - indicator analysis - down; - Fibonacci levels - down; - volumes - down; - candlestick analysis - down; - trend analysis - up; - Bollinger lines - down; - weekly schedule - up. General conclusion: On Thursday, the price may roll back down (the last three candles are white and fit into the body of the last black candle - a very strong signal down the candlestick analysis). The first lower target of 1.1301 is the pullback level of 23.6% (yellow dotted line). The material has been provided by InstaForex Company - www.instaforex.com |
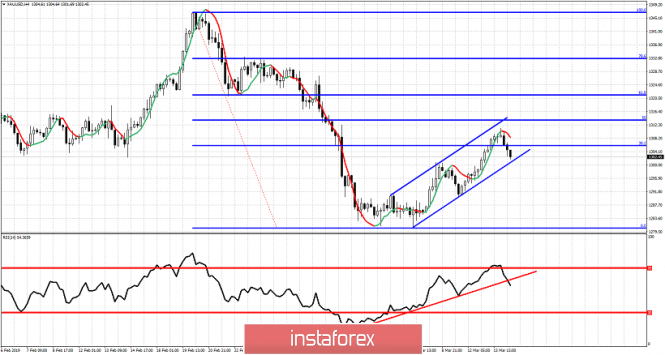
| Technical analysis for Gold for March 14, 2019 Posted: 14 Mar 2019 12:51 AM PDT Gold price has reached as high as $1,311 and is now pulling back towards $1,300. Short-term trend remains bullish as long as price is above $1,300 and inside the bullish short-term channel. Gold price is likely to move downwards to $1,250-60, and a break below $1,300 would increase the chances of this scenario coming true.
Red line - RSI trend line support Gold price bounced as expected towards $1,300-$1,310 area which was our initial target area for a bounce. Price remains inside the bullish channel where support is at $1,300. Price has reached the 38% Fibonacci retracement and marginally crossed above it closer to the 50% retracement. Price has reversed and the RSI is breaking below the red support trend line. This is a bearish sign. If this break of the RSI support is combined with a drop of price below $1,300, we could see another strong selling wave that would push gold price towards $1,250. The material has been provided by InstaForex Company - www.instaforex.com |
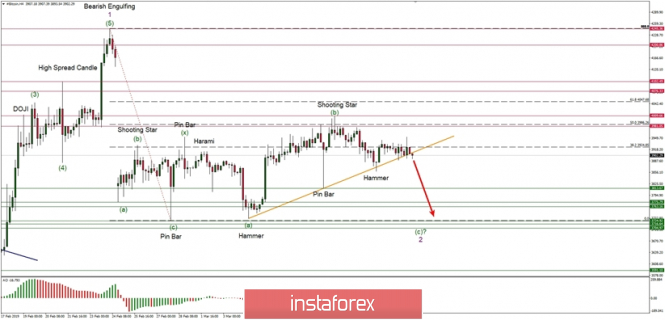
| Bitcoin Elliott Wave analysis for 14/03/2019 Posted: 14 Mar 2019 12:18 AM PDT Technical Market Overview: The BTC/USD pair is at a very interesting place right now. The price will either bounce back up from the trendline support around the level of $3,901 or the price will break through the trendline and will move lower. The next target for this wave is seen at the level of $3,813, but this is not the final target as the wave (c) should easily move below the bottom of the wave (a) located at the level of $3,724. The bearish bias continues and the momentum supports the negative outlook. Weekly Pivot Points: WR3 - $4,374 WR2 - $4,179 WR1 - $4,091 Weekly Pivot - $3,907 WS1 - $3,816 WS2 - $3,625 WS3 - $3,539 Trading Recommendations: Please keep an eye on the market reaction to the trendline test and trade accordingly. The protective stop-loss orders for the long-term traders should be placed at $4,010 level as any violation of this level will invalidate the short-term bearish outlook. The short-term traders or daytraders should place the protective stop-loss orders above the level of $3,951 if they are on the sell side of the market. The potential wave (c) should be a form of an impulsive wave, so it will be a sudden and quick wave down (it even might be a spike down), so please be prepared.
|
| You are subscribed to email updates from Forex analysis review. To stop receiving these emails, you may unsubscribe now. | Email delivery powered by Google |
| Google, 1600 Amphitheatre Parkway, Mountain View, CA 94043, United States | |


No comments:
Post a Comment