Forex analysis review |
- GBP/USD. March 21. Results of the day. The pound's fall against the background of an increasing likelihood of "hard" Brexit
- EUR/USD. March 21. Results of the day. The fate of Brexit is in the hands of the European Union
- Why the dollar jumped
- Brexit: The UK proposed a date of June 30, which did not suit the EU. The deadline is May 22, with a number of conditions
- Elliott wave analysis of GBP/JPY for March 21, 2019
- Elliott wave analysis of EUR/JPY for March 21, 2019
- Bitcoin analysis for March 21, 2019
- Analysis of Gold for March 21, 2019
- AUD/USD analysis for March 21, 2018
- March 21, 2019: GBP/USD Intraday technical levels and trading recommendations
- GBP / USD: Bank of England passes the baton to the EU summit
- GBP / USD plan for the American session on March 21. Bank of England will raise rates in the event of an orderly exit from
- EUR / USD plan for the US session on March 21. The euro fell after yesterday's growth due to changes in the policy of the
- FRS: Fed can completely refuse to raise interest rates this year
- GOLD Trading system "Regression Channels" on March 21. Gold takes advantage of the odds
- Technical analysis of NZD/USD for March 21, 2019
- Technical analysis of AUD/USD for March 21, 2019
- GBP / USD Trading system "Regression Channels" on March 21. Fed meeting affected the pound and the Bank of England meeting
- Oil is likely to continue falling despite OPEC and sanctions
- EUR / USD Trading system "Regression Channels" on March 21. Fed statements created pressure on the US dollar
- Trading recommendations for the EURUSD currency pair - placement of trading orders (March 21)
- The dollar fell on the basis of the Fed meeting. Did the regulator back up?
- The Fed moves to a neutral policy
- How will the dollar behave after the publication of the minutes of the Fed meeting
- Wave analysis of EUR / USD for March 21. Euro ready to complete a wave
| Posted: 21 Mar 2019 04:07 PM PDT 4-hour timeframe The amplitude of the last 5 days (high-low): 123p - 97p - 116p - 70p - 126p. Average amplitude for the last 5 days: 106p (145p). Yesterday, the British pound ignored the results of the Fed meeting, while the US dollar fell on all fronts, and it also remained indifferent to today's release of retail sales in the UK. Both in monthly and annual terms, retail sales were higher than analysts' forecasts. But it was the US currency that was increasing in price since the very beginning of the European trading session. Meanwhile, the Bank of England left the current interest rate unchanged, the balance of power in voting for the rate change has remained unchanged, and the Bank of England head Mark Carney said that companies are well prepared for the worst scenario of Brexit. He also noted that the consequences would not be as bad as expected even in the event of a "hard" brexit. Markets regarded these statements as a growing likelihood of a "hard" exit from the EU. The fact is that the European Union doubts the sensibility of granting a delay to Theresa May. It failed to convince Parliament and adopt an agreement with the EU. So why does London need a delay? What will it give? Also, the parties differ in terms of this very delay. In general, in the coming days we are waiting for a lot of interesting news relating to the negotiations on Brexit's postponement. Everything can end, even a disordered Brexit. There is also good news: if Brexit is orderly, most experts expect a rate increase from the regulator. But for now it is too early to talk about it. At the moment, the pound fell, so the current trend for the instrument is downward. All indicators are pointing down, and the "dead cross" is strong. Trading recommendations: The GBP/USD pair continues to move downwards. Thus, it is now recommended to trade on the decline with targets of 1.3039 and 1.3009. Long positions can be considered for a target of a resistance level of 1.3459, if the pair overcomes the critical line, since the trend will shift into growth in this case. In addition to the technical picture should also take into account the fundamental data and the time of their release. Explanation of illustration: Ichimoku Indicator: Tenkan-sen-red line. Kijun-sen – blue line. Senkou span a – light brown dotted line. Senkou span B – light purple dotted line. Chikou span – green line. Bollinger Bands Indicator: 3 yellow lines. MACD: A red line and a histogram with white bars in the indicator window. The material has been provided by InstaForex Company - www.instaforex.com |
| EUR/USD. March 21. Results of the day. The fate of Brexit is in the hands of the European Union Posted: 21 Mar 2019 04:06 PM PDT 4-hour timeframe The amplitude of the last 5 days (high-low): 44p - 44p - 40p - 28p - 112p. Average amplitude for the last 5 days: 54p (43p). On Thursday, March 21, the EUR/USD currency pair started a downward correction after yesterday's strengthening against the background of the "dovish" attitude of the Federal Reserve. Meanwhile, passions continue to boil around Britain. However, the European Union is also coming to the fore at this stage of Brexit. The fact is that the UK wants to postpone Brexit for several months. The European Union will meet London only if the final date is at May 23 (that is, before the elections to the European Parliament), or if the delay is not less than a year. But even in this case, Theresa May must provide guarantees that during that time she will be able to convince Parliament and it will accept the divorce agreement that was reached with the EU. What guarantees can Theresa May provide? We have already seen several attempts to push her version of the deal through Parliament, and all of them ended in failure. What new trump cards can a current prime minister have? She has no choice but to negotiate with individual parties and even with representatives of their own party. But will this option satisfy Juncker and the company? If not, then in a week we can witness hard Brexit, which, no one really needs. From a technical point of view, as long as the pair is above the critical line, an uptrend remains. If the pair manages to leave below the Kijun-Sen line, then it would turn into a downward trend. And even despite the completion of the rate hike cycle in the United States, it cannot be said that the dollar has no chance of growth anymore. Trading recommendations: The EUR/USD pair has started to adjust. Thus, it is now recommended to wait for the completion of a correction in the form of a price rebound from the critical line and resume long positions with the target area of a resistance of 1.1419 - 1.1431. Sell positions are recommended to be considered if traders manage to overcome the critical line. In this case, it would shift to a downward trend, and the first goal will be the level of 1.1323. In addition to the technical picture, one should also take into account the fundamental data and the time of their release. Explanation of illustration: Ichimoku Indicator: Tenkan-sen-red line. Kijun-sen – blue line. Senkou span a – light brown dotted line. Senkou span B – light purple dotted line. Chikou span – green line. Bollinger Bands Indicator: 3 yellow lines. MACD: A red line and a histogram with white bars in the indicator window. The material has been provided by InstaForex Company - www.instaforex.com |
| Posted: 21 Mar 2019 04:06 PM PDT After the Federal Reserve meeting, traders stopped waiting for a rate hike this year, and the yield on 10-year US government bonds fell to 2.51%. Futures on US indices and European stocks went down, although growth was recorded in Asia. It seems that today's decline in the yield of government securities and European stocks indicates that the market perceived the "soft" message of Fed officials not as a portion of new steroids, but as a threat to recession. The US dollar jumped, focusing on stocks, and not on bond yields. Yield decreases, and bonds become more expensive when the demand for defensive assets increases. This is a highly reliable public debt, as well as gold, the quotes of which have also increased. The mood in the markets is mostly cautious for today. Note that the Fed's softer monetary policy favors risky assets, but most of them have already reflected strong growth in their value in 2019. It seems that the decision of the US regulator was estimated in advance. The softening position of the US central bank cannot help but cause unease, because it implies the weaker prospects for economic recovery than previously reported. In the past two weeks, Treasury yields have already fallen, fuelled by fears of an expansion in the global recovery. At the moment, it has reached the lowest levels in more than a year. The dollar is now actively trying to catch up. I must say that this is not the only reason to sell risky assets and buy the greenback. Trade negotiations between the US and China are "stalling", Brexit is overgrown with new problems, rumors and promises are drawn-out. Today, British Prime Minister Theresa May arrived in Brussels and made a statement. The politician expressed the hope that the postponement would be enough for Parliament to accept this or that version of the deal, since it voted against the "hard" scenario of leaving the EU. "I sincerely hope that we will come out with an agreement. I am working to ensure that Parliament is able to approve the deal, and a short extension will give me this opportunity. I am here to discuss a request for a short delay until June with my leading colleagues. Parliament has done everything possible to avoid a choice. All the members of Parliament have been talking about is what they don't want, "said Teresa May. Failure to vote at the EU Economic Summit could be a very strong bearish factor for the pound and the GBPUSD pair as a whole. |
| Posted: 21 Mar 2019 04:06 PM PDT The British pound fell sharply against the US dollar during the first half of the day after news came out that the EU leaders might reject the British Prime Minister Theresa May's request to postpone Brexit. Yesterday, the government sent a request to the EU to postpone the UK release date from March 29 to June 30. However, today there are reports in the media that the release date cannot be postponed to a date later than May 22. Moreover, one of the EU's conditions is the Parliament's ratification of May's proposed agreement on Brexit, which has already been rejected twice by the House of Commons. This news put serious pressure on the pound, since this option significantly increases the likelihood that the UK will withdraw from the EU on March 29 without an agreement. Let me remind you that the summit in Brussels will begin today, where the leaders of the European Union will decide on the granting of the delay and its duration for two days. As for the fundamental data that came out today on the UK economy, it did not have the desired effect and did not help the pound. According to the report, UK retail sales increased in February, despite the events related to Brexit. According to the National Bureau of Statistics, in February 2019, UK retail sales rose by 0.4% compared with January, after rising by 0.9% in January. Economists had expected retail sales to decline by 0.4% in February. Good retail sales are sure to support GDP growth after a weak completion in 2018. Today, a report was also released in which it was stated that the net borrowings of the PSNB state sector amounted to £0.2 billion in February. The net borrowings of the UK public sector over the past 11 months at the end of March 2019 amounted to 23.1 billion pounds. The Bank of England's decision to leave the key interest rate at 0.75% slightly supported the British pound. The decision was made with a vote ratio of 9-0. The regulator said that it expects a smooth tightening of monetary policy in the event of an orderly exit of Great Britain from the EU, and that the outlook for the economy depends on it. As for the technical picture of the GBPUSD pair, large levels of support are now visible in the areas of 1.3080 and 1.3030. In case of an upward correction on Brexit news, growth can be restrained by the resistances of 1.3225 and 1.3320. The material has been provided by InstaForex Company - www.instaforex.com |
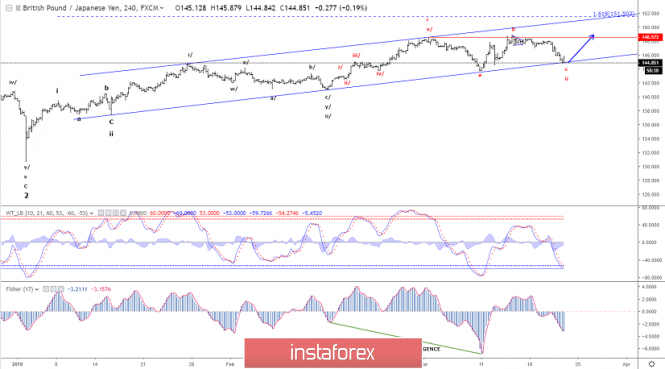
| Elliott wave analysis of GBP/JPY for March 21, 2019 Posted: 21 Mar 2019 09:19 AM PDT
We have seen the expected corrective decline towards 144.60. Once support at 144.60 has been tested a new impulsive rally will be expected for a rally above minor resistance at 145.88 indicating a corrective low is in place for more upside pressure towards 148.87 on the way higher to 151.50. R3: 147.31 R2: 146.46 R1: 145.88 Pivot: 145.30 S1: 144.81 S2: 144.60 S3: 143.69 Trading recommendation: We are look to buy GBP at 144.60 or upon a break above 145.88. Our stop will be placed at 143.60. The material has been provided by InstaForex Company - www.instaforex.com |
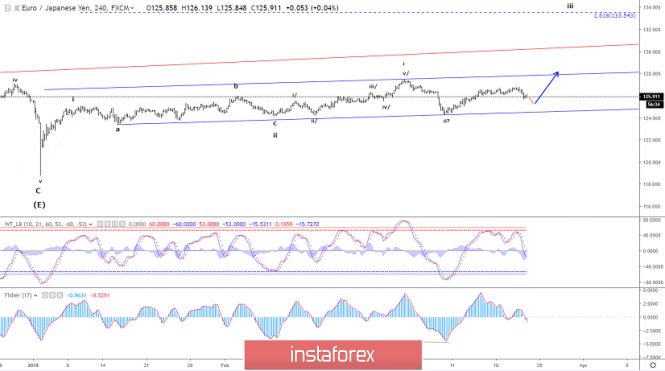
| Elliott wave analysis of EUR/JPY for March 21, 2019 Posted: 21 Mar 2019 09:13 AM PDT
EUR/JPY failed to break above the minor resistance at 126.75 and instead broke below support at 126.05 indicating a deeper corrective decline to 125.25 before the next impulsive rally to 126.75 and above here confirms continuation higher to 129.50 and longer term closer to the 161.8% extension target at 133.50. Short-term minor resistance at 126.71 should be able to cap the upside for the corrective dip to 125.25 before the next rally higher. Only a direct break above 126.71 will indicate that the correction completed early and a the next impulsive rally is developing. R3: 126.75 R2: 126.50 R1: 126.27 Pivot: 125.75 S1: 125.58 S2: 125.25 S3: 125.18 Trading recommendation: Our stop at 125.80 was hit for a 100 pips profit. We are look for a new buying opportunity at 125.25 or upon a break above 126.27. The material has been provided by InstaForex Company - www.instaforex.com |
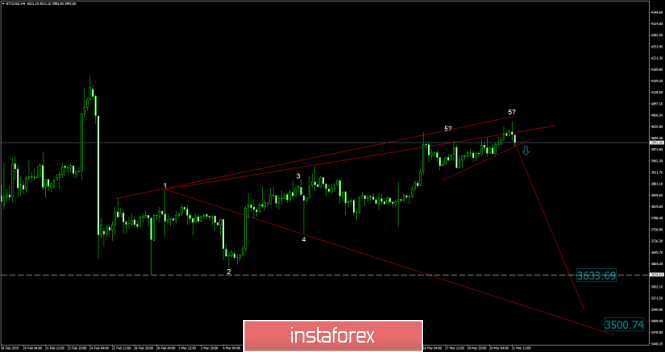
| Bitcoin analysis for March 21, 2019 Posted: 21 Mar 2019 07:32 AM PDT BTC has been trading upward but on the very slow paste, which is potential warning for the future upside.
According to the H4 time – frame, we found that that there is potential for a change in the trend direction from bullish to bearish. The resistance at the price of $4.020 is holding that we expect potential downward movement. We might see potential fifth wolf's wave to complete the bearish pattern and that would signal downside. The projection for the potential drop is set at $3.633 and $3.500. Trading recommendation: We are watching a potential breakout of the upward trendline to confirm further downside. The targets are set at the price of $3.633 and $3.500. The material has been provided by InstaForex Company - www.instaforex.com |
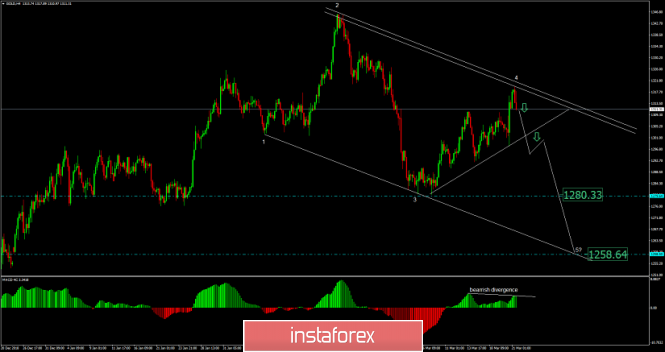
| Analysis of Gold for March 21, 2019 Posted: 21 Mar 2019 07:20 AM PDT Gold has been trading as we expected. The price tested and rejection of the level $1.318.59.
According to the H4 time – frame, we found that successful rejection of the parallel line (resistance) at $1.319.50, which is a sign that buying looks risky. We also found that hidden bearish divergence on the macd oscillator and the potential end of the fourth wolf's wave pattern. Gold is expected to head towards the $1.280.35 and EPA (Estimated Price at Arrival) $1.258.6. Trading recommendation: We entered short positions on Gold from $1.310.00 but we plan to add another short position if we see a breakout of the upward trendline at $1.297.50. The main target is set at the price of $1.258.65. The material has been provided by InstaForex Company - www.instaforex.com |
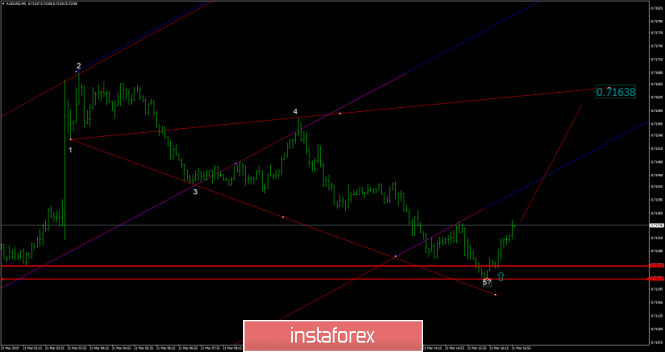
| AUD/USD analysis for March 21, 2018 Posted: 21 Mar 2019 07:07 AM PDT AUD/USD has been trading downwards. The price tested the level of 0.7127.
According to the 5M time-frame price structure, we found that there are prospects for an upward movement since there is potential fifth point of the wolf's wave bullish pattern. The price of AUD/USD is expected to grow based on this pattern and the current market structure. The EPA (Estimated Price at Arrival) is seen at 0.7165. Trading recommendation: We are long AUD on intraday prospective from 0.7130 with the target at 0.7165. Protective stop can be placed below 0.7115. The material has been provided by InstaForex Company - www.instaforex.com |
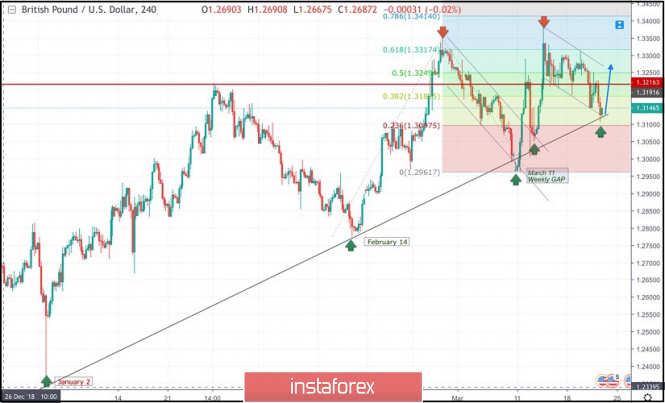
| March 21, 2019: GBP/USD Intraday technical levels and trading recommendations Posted: 21 Mar 2019 07:05 AM PDT
On January 2nd, the market initiated the depicted uptrend line around 1.2380. This uptrend line managed to push price towards 1.3200 before the GBP/USD pair came to meet the uptrend again around 1.2775 on February 14. Another bullish wave was demonstrated towards 1.3350 before the bearish pullback brought the pair towards the uptrend again on March 11. A weekly bearish gap pushed the pair slightly below the trend line (almost reaching 1.2960) before the bullish breakout above short-term bearish channel was achieved on March 11. Bullish persistence above 1.3060 allowed the GBP/USD pair to pursue the bullish momentum towards 1.3130, 1.3200 then 1.3360 where the current bearish pullback was initiated. Bullish persistence above 1.3250 ( 50% Fibonacci expansion level ) was needed for confirmation of a bullish Flag pattern. However, significant bearish pressure was demonstrated below 1.3250. Hence, the short-term outlook turned to become bearish towards 1.3120 - 1.3100 where the depicted uptrend line comes to be tested again. The current price zone of (1.3120-1.3090) corresponding to the uptrend line should be watched for a possible bullish reversal as long as bullish persistence above (1.3080) is maintained. On the other hand, a bearish breakout below 1.3080 (23.6% Fibonacci expansion) invalidates the current bullish scenario allowing further bearish decline towards 1.3000 and 1.2965 (Next Fibonacci level). Trade Recommendations: Intraday traders should wait for a valid BUY entry anywhere around (1.3120-1.3090). T/P level to be located around 1.3180 and 1.3250. SL to be set as H4 closure below 1.3080. The material has been provided by InstaForex Company - www.instaforex.com |
| GBP / USD: Bank of England passes the baton to the EU summit Posted: 21 Mar 2019 06:30 AM PDT The current week was eventful for the GBP / USD pair in the background of the Fed, the Bank of England, and the EU Brexit summit. Despite the sharp weakening of the dollar, the British currency ended the day with a pullback to 1.32 support. The pound traders appeared to be disappointed that British Prime Minister Theresa May asked Brussels for a short-term postponement of the extreme date of the country's withdrawal from the EU. If it were not for the "soft" comments of the Fed following the next meeting, which ended yesterday, the loss of the pound within the day could have been more substantial. Today, the GBP/USD pair was unable to grow on the recovery attempt and continued to decline to 1.31. Pressure on the pound is still exerted by the continuing uncertainty around the exit of the United Kingdom from the EU. Considering how late London's official request to postpone Brexit was made, EU members are unlikely to be able to take any decision on this matter at the next meeting of the European Council. Earlier, the President of the European Commission, Jean-Claude Juncker, allowed the possibility of convening an emergency EU summit next week (until March 29) to decide whether to approve the UK's request for an extension of Article 50 of the Lisbon Treaty. At the same time, the best options in Brussels are either to consider the postponement of Brexit until May 23, 2019 before the elections to the European Parliament or for a year. In addition, the EU is unhappy that there is no agreement between the government and the British Parliament and they question the fact that Theresa May will be able to reach a consensus in the next 2 months. If the British Prime Minister can not provide Brussels with assurances that the Brexit deal will eventually be accepted by the House of Commons, the renewal request is likely to be rejected. Meanwhile, all these events look unfavorable for the Bank of England, which is forced to leave without attention the fact of wage and consumer price growth in the country in favor of the continuing uncertainty over Brexit. Following the results of the next meeting, which took place today, the regulator decided to leave the base interest rate at the level of 0.75% again and at the same time, they confirmed the volume of assets repurchase from the market in the amount of 435 billion pounds sterling. Additionally, the management of the Bank of England reported that further changes in interest rates would depend on the Brexit process and the next step for the Central Bank could either be raising or lowering borrowing costs. It is assumed that the emergence of new reasons for postponing Brexit will be positive for the pound. At the same time, you should not finally write off the possibility of the United Kingdom's exit from the EU without a deal, which could turn into a failure for the British currency. The material has been provided by InstaForex Company - www.instaforex.com |
| Posted: 21 Mar 2019 06:23 AM PDT To open long positions on the GBP / USD pair, you need: The Bank of England kept interest rates unchanged, saying that they were ready to raise them in the future provided that Britain will leave the EU in an orderly manner. This supported the pound, which fell sharply in the morning before the EU summit. Traders can return to purchases after fixing above the resistance of 1.3131, which will lead to an upward correction in the area of 1.3173 and 1.3222, where I recommend taking profits. In the case of further reductions on the news on Brexit, the long positions are best to look at the rebound from the lows of 1.3085 and 1.3034. To open short positions on the GBP / USD pair, you need: Bears coped with the task for the first half of the day but a further decrease is possible only with negative news on the postponement of the UK exit date from the EU. A failed consolidation above 1.3131 will be the first sell signal for the pound. Otherwise, short positions can be opened for a rebound from the maximum of 1.3173 and 1.3222. The main targets of the bears will be the minimums near 1.3085 and 1.3034, where I recommend taking profits. More in the video forecast for March 21 Indicator signals: Moving averages Trading is below 30- and 50-moving averages, which indicates the advantage of the pound sellers. Bollinger bands In the case of an upward correction in the pound in the second half of the day, growth may be limited by the average border of the Bollinger Bands indicator around 1.3194. Description of indicators MA (moving average) 50 days - yellow MA (moving average) 30 days - green MACD: fast EMA 12, slow EMA 26, SMA 9 Bollinger Bands 20 The material has been provided by InstaForex Company - www.instaforex.com |
| Posted: 21 Mar 2019 06:13 AM PDT To open long positions on EUR / USD pair, you need: A significant correction occurred in the area of major support level 1.1396, to which I drew attention in my morning review. Currently, the bulls are required to return to this range, which will lead to the formation of a new wave of growth with an update of the highs in the area of 1.1427 and 1.1459, where I recommend taking profits. A weak US labor market data could help the euro bulls. In case of further decline, long positions are best to return on a rebound from a minimum of 1.1361. To open short positions on EUR / USD pair, you need: The bears managed to break through the important support of 1.1396 from the second attempt, however, the downward trend ended there. While trading will be conducted below this range, the option of further reducing the EUR/USD pair will be maintained and the sellers' goal will be at least in the area of 1.1361, where I recommend taking profits. Under the scenario of return to resistance 1.1396, it is best to look again at short positions from the resistance of 1.1427 and best to sell the euro on a rebound from the maximum of 1.1459. More in the video forecast for March 21 Indicator signals: Moving averages The bears tested the 30- and 50-day moving averages, however, only a fixation below on which will indicate a break in the upward trend. Bollinger bands In the event of a further decline in the euro, support will be provided by the lower limit of the Bollinger Bands indicator around 1.1373. Euro growth will be limited to the middle of the channel in the 1.1410 area. Description of indicators MA (moving average) 50 days - yellow MA (moving average) 30 days - green MACD: fast EMA 12, slow EMA 26, SMA 9 Bollinger Bands 20 The material has been provided by InstaForex Company - www.instaforex.com |
| FRS: Fed can completely refuse to raise interest rates this year Posted: 21 Mar 2019 04:55 AM PDT The US Federal Reserve has left the range of interest rates on federal funds unchanged. The Fed may completely refuse to raise interest rates this year. The European currency has seriously strengthened its position in tandem with the US dollar after the US Federal Reserve left the range of interest rates on federal funds unchanged yesterday, signaling that it can completely refuse to increase rates this year. According to the data, the Fed left the range of interest rates on federal funds unchanged between 2.25% and 2.50%, saying that it would respect the calm approach to the issue of changes in interest rates in the future. Strong pressure on the US dollar was driven by the statement that interest rates will not rise this year, but this decision is not final and much will depend on the incoming data. The committee still expects the median interest rate on federal funds to be 2.4% by the end of 2019 and 2.6% by the end of 2020. In 2021, the rate will not rise and will remain at 2.6%. In the long run, the Fed expects the federal funds rate to be 2.8%. Changes in monetary policy are primarily associated with a slowdown in economic growth. Despite the fact that the situation on the labor market remains favorable, the growth of the economy slowed down compared to the 4th quarter, which is reflected in a slowdown in the growth of household spending and investment by companies. The Fed predicts the GDP growth in 2019 to 2.1% versus the December forecast of 2.3%. Unemployment in the US in 2019 is expected to be 3.7% against the December forecast of 3.5%. Another important statement from the Fed concerns plans in completing the process of reducing its balance sheet, which will begin in May of this year and last until October. The regulator noted that he would continue to reduce mortgage-backed securities in his holding after the balance reduction process was completed. At the same time, it would reinvest the income from it into treasury bonds. Beginning in October 2019, the Fed will reinvest up to $20 billion a month in Treasury securities. During the press conference, which took place immediately after the meeting of the Open Market Operations Committee, Jerome Powell said that the US economy is in good shape but the Fed leaders will be patient when considering changes in monetary policy. Powell drew attention to data on retail sales, which indicate a slight slowdown in consumer spending, while expectations on inflation did not cause concern and remained near the lower limit of the range. As for the technical picture of the EUR/USD pair, its further growth will be supported and highly depend on the area of 1.1395. To maintain the upward trend, buyers of risky assets need to return to the resistance level of 1.1430, which will lead to the formation of large growth with the update of weekly highs at 1.1460 and 1.1490. The material has been provided by InstaForex Company - www.instaforex.com |
| GOLD Trading system "Regression Channels" on March 21. Gold takes advantage of the odds Posted: 21 Mar 2019 04:37 AM PDT 4 hour timeframe Technical details: Senior linear regression channel: direction - up. Junior linear regression channel: direction - down. Moving average (20; smoothed) - up. CCI: 234.9411 After a strong decline in gold prices in the period of February 20 - March 5, this drags metal to continue its recovery and form a new uptrend. Yesterday, the Fed greatly helped many currencies and precious metals rise in price but gold was no exception. The exempted one was the sterling pound. Thus, the rise in prices for the most famous precious metal is absolutely logical. Plus you should not forget that the more uncertainty is associated with a particular currency asset, there is a greater demand for safe-haven assets and one of which is gold. Now, there is enough uncertainty in the world and talks about the UK is not relevant to even speak once again. The US and China seem to have agreed on a trade agreement but there is no signed agreement. However, information has already appeared that China does not adhere to the terms of the agreement. Meanwhile, the US is threatening a trade war with the European Union, whose economy is going through hard times. In general, there are plenty of reasons to buy gold. From a technical point of view, the purple bars of the Heiken Ashi indicator and the upward direction of the older linear regression channel clearly indicate the direction of the trend. Due to the strong overbought of the CCI indicator, a rollback may follow in the near future. Nearest support levels: S1 - 1316.41 S2 - 1312.50 S3 - 1308.59 Nearest resistance levels: R1 - 1320.31 Trading recommendations: Gold is currently continuing its upward movement. Thus, purchase orders with a target of 1320.31 and higher are relevant today. Heiken Ashi's reversal will indicate the beginning of a downward correction. In addition to the technical picture should also take into account the fundamental data and the time of their release. Explanations for illustrations: The senior linear regression channel is the blue lines of unidirectional movement. The younger linear regression channel is the purple lines of unidirectional movement. CCI - blue line in the indicator window. The material has been provided by InstaForex Company - www.instaforex.com |
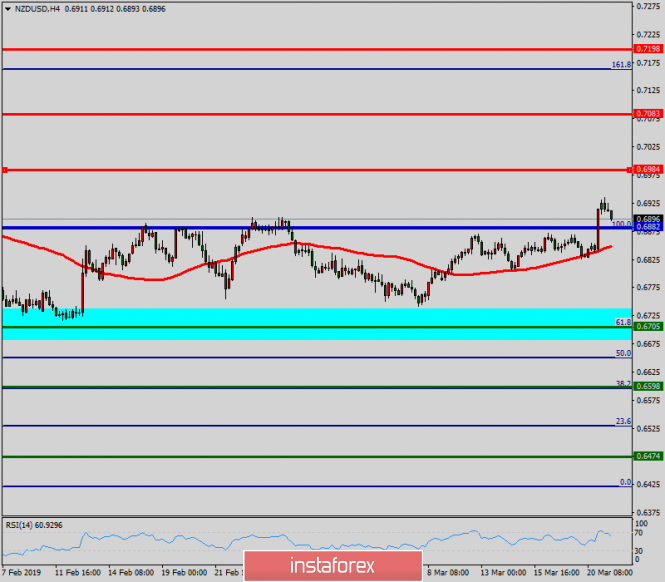
| Technical analysis of NZD/USD for March 21, 2019 Posted: 21 Mar 2019 04:36 AM PDT Pivot point : 0.6882. The NZD/USD pair breached resistance which had turned into strong support at the level of 0.6705. The pair is still moving around the daily pivot point of 0.6882. The level of 0.6705 coincides with a golden ratio, which is expected to act as major support today. The RSI is considered to be overbought, because it is above 70. The RSI is still signaling that the trend is upward as it is still strong above the moving average (100). Besides, note that the pivot point is seen at 0.6882. This suggests that the pair will probably go up in the coming hours. Accordingly, the market is likely to show signs of a bullish trend. In other words, buy orders are recommended to be placed above 0.6800 with the first target at the level of 0.6882. From this point, the pair is likely to begin an ascending movement to 0.6882 and further to 0.6984. The level of 0.6984 will act as strong resistance. On the other hand, if there is a breakout at the support level of 0.6705, this scenario may become invalidated. The material has been provided by InstaForex Company - www.instaforex.com |
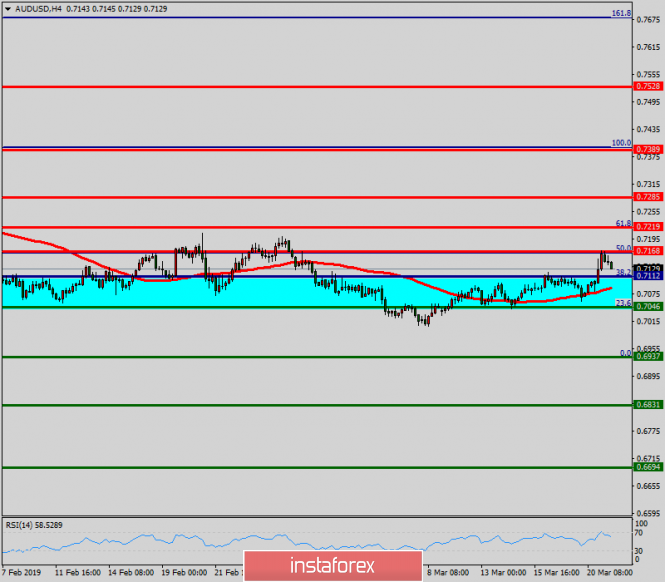
| Technical analysis of AUD/USD for March 21, 2019 Posted: 21 Mar 2019 04:24 AM PDT The AUD/USD pair is set above strong support at the level of 0.7046 which coincides with the 23.6% Fibonacci retracement level and 0.7168. This support has been rejected four times confirming the uptrend. Hence, the major support is seen at the level of 0.7046, because the trend is still showing strength above it. Accordingly, the pair is still in the uptrend in the area of 0.7046 and 0.7168. The AUD/USD pair is trading in the bullish trend from the last support line of 0.7112 towards the first resistance level of 0.7168 in order to test it. This is confirmed by the RSI indicator signaling that we are still in the bullish trending market. Now, the pair is likely to begin an ascending movement to the point of 0.7168 and further to the level of 0.7290. The level of 0.7389 will act as the major resistance and the double top is already set at the point of 0.7389. At the same time, if there is a breakout at the support levels of 0.7112 and 0.7046, this scenario may be invalidated. Overall, however, we still prefer the bullish scenario. The material has been provided by InstaForex Company - www.instaforex.com |
| Posted: 21 Mar 2019 04:12 AM PDT 4 hour timeframe Technical details: Senior linear regression channel: direction - up. The younger linear regression channel: direction - up. Moving average (20; smoothed) - sideways. CCI: -106.4178 The GBP / USD currency pair has fixed below the MA. Thus, a change in the downward trend has responded to the outcome of the Fed meeting rather indirectly. However, the rise in the pair was not enough to go above the MA, which was weak in general. Hence, the sterling pound is now in a position where the market does not know which way to go next. The new strengthening of the pound will be completely illogical in the context of the situation in Brexit. Yesterday, the Fed's meeting did not contribute to the decline in the pair amid the decline in GDP forecasts for the coming years and the statement which in fact about ending the key rate increase cycle. It should also be noted that today the meeting of the results of the meeting of the Bank of England will take place. However, no changes are expected in monetary policy but any interesting information can still do. The key question for the next few days remains: what decision will the EU take at the request of Theresa May to postpone Brexit to June 30? Earlier, information has already been received that Brussels is against the transfer of a "divorce" precisely for this period, although on the whole it is ready to meet London. Moreover, on March 21, a report on retail sales in the UK for February will be published. However, Brexit will be postponed either to May 23 or to a much later date. although generally ready to meet London. However, Brexit will be postponed either to May 23 or to a much later date, although generally, they are ready to meet London. Nearest support levels: S1 - 1.3184 S2 - 1.3123 S3 - 1.3062 Nearest resistance levels: R1 - 1.3245 R2 - 1.3306 R3 - 1.3367 Trading recommendations: The GBP/USD pair has begun a round of correction but it was already against a downward correction. Thus, you should wait for the Heiken-Ashi indicator to turn down in order to open short positions with targets of 1.3184 and 1.3123. Purchase orders will again become relevant not earlier than breaking of the MA and the level of 1.3245. In this case, the bulls will again seize the initiative on the market and the first target levels in trading longs will be the levels of 1.3306 and 1.3367. It should be noted. Explanations for illustrations: The senior linear regression channel is the blue lines of unidirectional movement. The junior linear channel is the purple lines of unidirectional movement. CCI is a blue line in the indicator regression window. The moving average (20; smoothed) is on the blue line on the price chart. Murray levels - multi-colored horizontal stripes. Heiken Ashi is an indicator that colors bars in blue or purple. The material has been provided by InstaForex Company - www.instaforex.com |
| Oil is likely to continue falling despite OPEC and sanctions Posted: 21 Mar 2019 03:50 AM PDT
Oil could not stay at the highs of 2019 which were reached during the previous session. But, generally speaking, the markets remain relatively tough against the background of supply cuts led by OPEC and the US government sanctions against Iran and Venezuela. Futures for WTI crude oil in the United States were worth $ 60.11 per barrel, losing 12 cents, or 0.2 percent, while at the beginning of the day WTI reached its highest level since November 12. Brent crude oil traded at $ 68.54 per barrel, which is close to $ 68.69 per barrel at the beginning of the session, the highest level since November 13. Since the beginning of 2019, oil prices have risen by almost a third due to a reduction in OPEC supplies, as well as US sanctions against Iran and Venezuela. Oil production in OPEC fell from a peak of mid-2018, 32.8 million barrels per day to 30.7 million barrels per day in February. Venezuelan exports to the United States completely stopped. Exports of Iranian oil also declined remarkably. States seek to reduce oil exports from Iran by about 20 percent, to below 1 million barrels per day, demanding that importing countries reduce purchases in order to avoid US sanctions. Oil stocks in the US last week fell by almost 10 million barrels, helped by high demand for export and refining. Export growth is associated with a sharp increase in US oil production, which last week returned to a record level of 12.1 million barrels per day, which makes America the largest producer in the world. The United States was able to outrun both Russia and Saudi Arabia. The material has been provided by InstaForex Company - www.instaforex.com |
| Posted: 21 Mar 2019 03:39 AM PDT 4 hour timeframe Technical details: Senior linear regression channel: direction - down. Junior linear regression channel: direction - down. Moving average (20; smoothed) - up. CCI: 210.0263 On Thursday, March 21, the EUR/USD currency pair made a strong upward breakout as part of the continuing uptrend. The Federal Reserve has left the key rate unchanged but lowered GDP forecasts for 2019 and 2020. They also stated that the rate hike is likely in 2019 amid fears of a slowdown in the country's economic growth. Thus, it was precisely the open statement in 2019 that was no longer enough to rely on monetary policy tightening, which provoked the sale of the American currency. By and large, no more important information from the Fed has been received but Donald Trump can rejoice. He has long criticized Jerome Powell for raising the key interest rate too quickly, which makes the dollar more expensive but Trump opposes and complicates the servicing of public debt. Euro currency broke through the trend line yesterday, which connected several lower peaks at once. At the moment, we can assume makes that the global downward trend of the euro has broken. Of course, as before, a lot will depend on the nature of the fundamental news in the coming months. The EU economy still looks much weaker than the American one. Nevertheless, the euro received certain chances of forming an upward trend. Nearest support levels: S1 - 1.1322 S2 - 1,1292 S3 - 1.1261 Nearest resistance levels: R1 - 1.1353 R2 - 1.1383 R3 - 1,1414 Trading recommendations: The EUR/USD currency pair resumed its upward movement. Hence, significant targets for long positions will be at 1.1444 and 1.1475. Heiken Ashi's reversal will indicate a downward correction round. Sell positions will become relevant not earlier than the fixation of the pair below the moving average line with targets at 1.1322 and 1.1292, given that the trend of the pair will change to downward. In addition to the technical picture should also take into account the fundamental data and the time of their release. Explanations for illustrations: The senior linear regression channel is the blue lines of unidirectional movement. The younger linear regression channel is the purple lines of unidirectional movement. CCI - blue line in the indicator window. The moving average (20; smoothed) is on the blue line on the price chart. Murray levels - multi-colored horizontal stripes. Heiken Ashi is an indicator that colors bars in blue or purple. The material has been provided by InstaForex Company - www.instaforex.com |
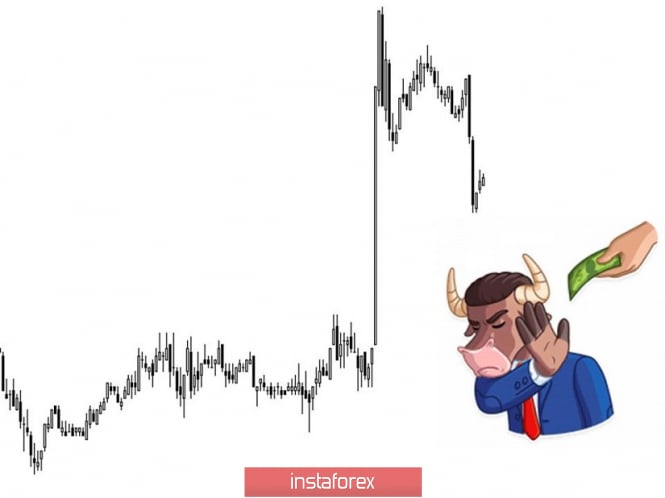
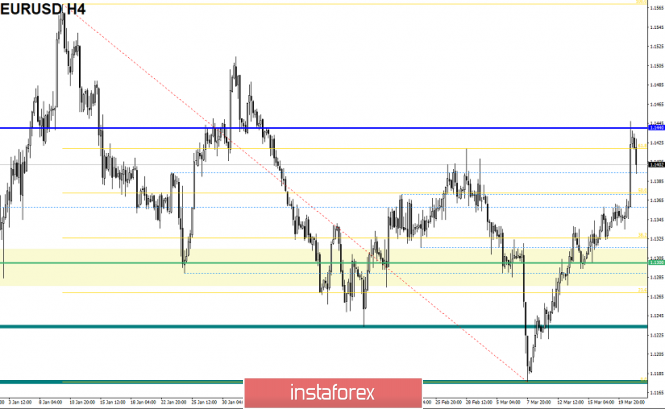
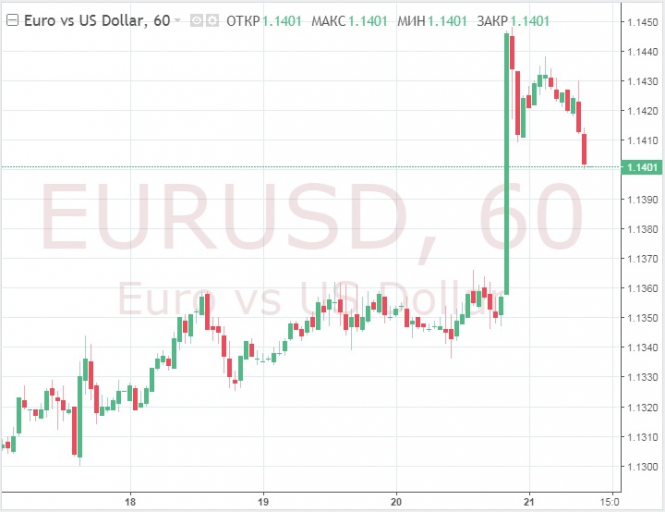
| Trading recommendations for the EURUSD currency pair - placement of trading orders (March 21) Posted: 21 Mar 2019 02:58 AM PDT The currency pair Euro / Dollar for the last trading day showed an extremely high volatility of 112 points, in comparison with the previous days, having as a result of pulsed candles. From the point of view of technical analysis, we see that the sluggish market has been replaced by active growth, reaching as a result of the resistance level of 1.1440. Considering the chart in general terms, we see significant growth, in a little less than two weeks the quote jumped from 1.1180 to 1.1440, which is already alarming traders. Information and news background had a whole layer of information. We will start with the most anticipated event of the week - the meeting of the Federal Commission on Open Market Operations. Dear and beloved Fed Chairman Jerome Powell said at a press conference that this year they will not raise the interest rate, but a one-time increase is planned for 2020. At the same time, the head of the Federal Reserve announced a reduction in the volume of asset repurchases from May, and already in September of this year, he wants to stop the repurchase of assets. Naturally, against the background of the above, the dollar was literally spilled on all currency pairs, I think you have already appreciated the jump on the euro / dollar. Go ahead and turn to our beloved Brexit, as here the circus is in full swing.
Today, the circus tent continues, as Teresa May is in Brussels and there is an active process of discussing the postponement. Further development Analyzing the current trading chart, we see that a rebound from the level of 1.1440 has already occurred, which is quite normal against the background of this kind of overheating. It is likely to assume that the downward interest will still remain in the market, where, together with the information background, we can sink to 1.1380-1.1360.
Based on the data available, it is possible to decompose a number of variations, let's consider them: - Positions to buy at this time are not considered due to a strong bearish interest. Consideration of these transactions will be carried out as soon as a point of support is found. - Traders considered selling positions as soon as the price reached the level of 1.1440 and the deceleration process started. Now, there is a process of conducting the transaction in the direction of 1.1380-1.1360. Indicator Analysis Analyzing a different sector of timeframes (TF ), we see that in the short term, the indicators have changed to descending against the background of recovery of quotes. Intraday and mid-term prospects still maintain an upward interest. Weekly volatility / Measurement of volatility: Month; Quarter; Year Measurement of volatility reflects the average daily fluctuation , with the calculation for the Month / Quarter / Year. (March 21, was based on the time of publication of the article) The current time volatility is 44 points. It is likely to assume that due to the information background, volatility can still grow. Key levels Zones of resistance: 1.1440; 1.1550; 1.1650 *; 1.1720 **; 1.1850 **; 1.2100 Support areas: 1.1300 **; 1.1214; 1.1120; 1.1000 * Periodic level ** Range Level The material has been provided by InstaForex Company - www.instaforex.com |
| The dollar fell on the basis of the Fed meeting. Did the regulator back up? Posted: 21 Mar 2019 02:05 AM PDT On the eve of the US currency fell sharply against the backdrop of the fact that the US Federal Reserve System (FRS), the US left the interest rates unchanged and hinted at the lack of plans to raise them in 2019. Today, the dollar index is recovering after reaching its lowest level since the beginning of February. At the moment, the regulator is going to keep the interest rate unchanged this year and increase it once in 2020. According to experts, if everything is exactly like this, then this will be a landmark moment. Since the 1970s, the Fed has kept the rate three times stable for more than a year after its increase in the previous three months: in 1997, 2000, 2006. At the same time, the next step of the Central Bank was almost always a reduction in the rate. "The Fed has given the markets even more than they could count on," Goldman Sachs experts stated. As we can recall, the consensus forecast of economists suggested that at least one rate increase by the Fed will still be this year. "For 2020, the US Central Bank still laying another increase in the rate, which, according to the forecast, will be the last. However, given the upcoming US presidential elections and the almost guaranteed attempts by Donald Trump to raise his rating at the expense of criticism from the Fed, this seems unlikely, " the representatives of ING believe. Meanwhile, market expectations have become even more "dovish." Therefore, futures traders raised their estimate of the probability of a rate reduction to almost 50% this year. Today, many probably wonder: why has the regulator decided to change his rhetoric so drastically? It is possible that everything will be tied to the already mentioned presidential elections in the United States now, although there is still a lot of time left to them. The head of the White House, obviously, knows that by tradition, only those presidents under which the stock market showed growth, could succeed in electing for a second term. Thus, the Fed must do everything possible for that. In addition, to improve economic performance, the United States is likely to need a weaker dollar to improve economic performance. The material has been provided by InstaForex Company - www.instaforex.com |
| The Fed moves to a neutral policy Posted: 21 Mar 2019 01:55 AM PDT On March 20, the decision on rates was published and kept unchanged to 2.25 - 2.50%. The Fed has changed and the GDP growth forecast for 2019 was noticeably downward from the range of 2.3-3.5 % to 1.9-2.2%. The text of the Fed statement emphasized the neutral position of the Fed with the desire to ensure a balance between supporting GDP growth and controlling inflation. All these suggest that the Fed stopped raising rates for a long period of time and perhaps, the next Fed action will not be a raise but a rate cut. The material has been provided by InstaForex Company - www.instaforex.com |
| How will the dollar behave after the publication of the minutes of the Fed meeting Posted: 21 Mar 2019 01:51 AM PDT
The Federal Reserve has abandoned plans to raise rates this year. It was a signal that a three-year campaign to normalize policies could be completed this year. The dollar could not resist after such a decision of the regulator. Investors quickly appreciated the prospects for abandoning the rate cut, and the yield on US Treasury bonds fell to its lowest level since the beginning of 2018. The change in the Fed's rate led to a fall in the dollar to 110.47 yen, which lost 0.6 percent overnight, the biggest drop since early January. The euro climbed to a seven-week high and was trading at $ 1.1424.
It is worth noting that the markets were ready for such a decision by the Fed, and currencies, including the dollar, behave predictably, which is generally in line with expectations. Now it is necessary to adjust trading strategies in view of the complete absence of a rate increase this year. The central bank also reduced its growth and inflation projections, while raising unemployment projections. In continuation of its pigeon strategy, the Fed will stop cutting its balance in September, a few months earlier than many expected. The only consolation for the dollar has been that in recent months, central banks around the world have changed their aggressive tone as economic growth has slowed almost everywhere. This need for incentives means that many central banks will not want their currencies to go up against the dollar. Of course, a more cautious tone and lower US economic outlook will limit dollar growth, but it should be kept in mind that with similarly weak growth prospects in other countries, including Europe, China, Australia and Japan, it is doubtful that the dollar will depreciate to a large extent. The material has been provided by InstaForex Company - www.instaforex.com |
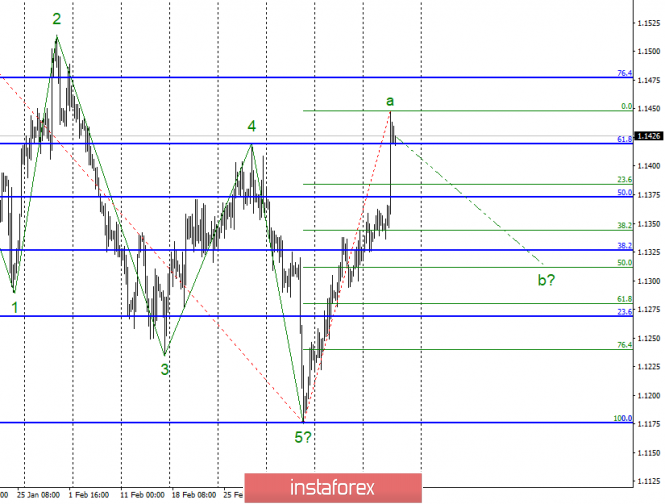
| Wave analysis of EUR / USD for March 21. Euro ready to complete a wave Posted: 21 Mar 2019 01:41 AM PDT
Wave counting analysis: On Wednesday, March 20, trading ended for EUR / USD by 75 bp increase. The Fed, led by Jerome Powell, frankly disappointed the market with words about stopping the increase in the key rate. In addition, the GDP forecast for 2019 was reduced to 2.1% y / y, and for 2020 - to 1.9% y / y. Thus, wave a received a longer view, but is already ready for its completion. In this case, the pair will proceed to the construction of the wave and with targets located near the level of 50.0% on the Fibonacci grid constructed by the size of wave a. The wave may take a more extended form than it is now, but the more likely option is still the beginning of the construction of a corrective wave. Sales targets: 1.1344 - 38.2% Fibonacci (small grid) 1.1311 - 50.0% Fibonacci (small grid) Purchase goals: 1.1477 - 76.4% Fibonacci General conclusions and trading recommendations: The pair supposedly completed the construction of wave a or is close to completion. Now I recommend taking profits on purchases and preparing for short-term small sales with targets located around 1.1344 and 1.1311, which corresponds to 38.2% and 50.0% Fibonacci, based on building wave b. The material has been provided by InstaForex Company - www.instaforex.com |
| You are subscribed to email updates from Forex analysis review. To stop receiving these emails, you may unsubscribe now. | Email delivery powered by Google |
| Google, 1600 Amphitheatre Parkway, Mountain View, CA 94043, United States | |



No comments:
Post a Comment