
Forex analysis review |
- Fractal analysis of major currency pairs for March 27
- Control zones NZDUSD 03/27/19
- Control zones USDCAD 03/27/19
- March 25, 2019 : GBP/USD Intraday technical outlook and trade recommendations.
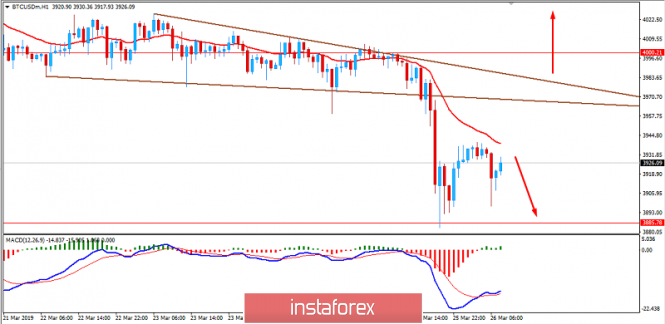
- Bitcoin analysis for March 26, 2019
- GBP/USD. March 26. Results of the day. Three more resignations in the British Parliament. Total chaos
- EUR/USD. March 26. Results of the day. The euro at a loss. Where to look next?
- Analysis of Gold for March 26, 2019
- GBP/USD. March 26. The trading system. "Regression Channels". British Parliament seizes control of Brexit
- GBP/USD analysis for March 26, 2019
- EUR/USD. March 26. The trading system. "Regression Channels". Euro is ready for a new fall on the basis of "technology"
- Increasing the slope of the yield curve of treasuries could stir up the currency markets
- Analysis of the EUR / USD divergence on March 26. The end of the pair = new fall?
- Analysis of the GBP / USD divergence for March 26. Consolidation of the pair near the level of 1.3200
- GBP / USD plan for the US session on March 26. The pound enjoys the support after the emergence of alternatives on Brexit
- EUR / USD plan for the US session on March 26. The lack of important data does not allow the euro to continue to grow
- Technical analysis of NZD/USD for March 26, 2019
- Technical analysis of EUR/USD for March 26, 2019
- Fed decision will support gold, experts say
- The dollar is rising against the yen, along with optimism about the global economy
- GBP/USD: a fateful week for Brexit and pound sterling
- Brexit: Get ready for alternative scenarios. The decision of the British Parliament to deprive Prime Minister Theresa May
- Trading plan for 03/26/2019
- Forecast for Gold on March 26, 2019
- BITCOIN Analysis for March 26, 2019
| Fractal analysis of major currency pairs for March 27 Posted: 26 Mar 2019 06:32 PM PDT Forecast for March 27: Analytical review of H1-scale currency pairs:
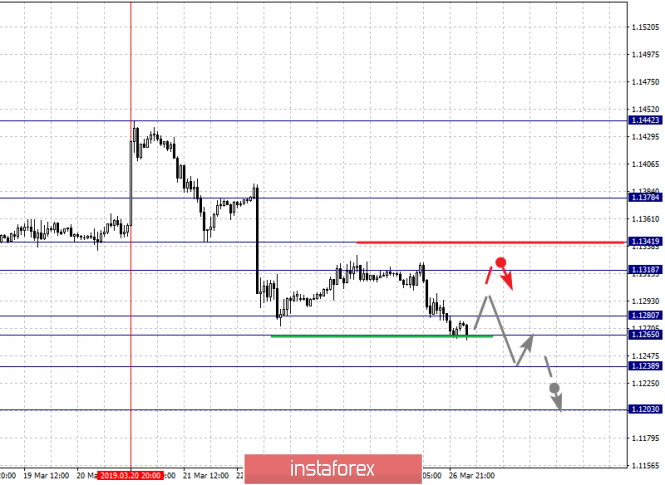
For the Euro / Dollar pair, the key levels on the H1 scale are: 1.1378, 1.1341, 1.1318, 1.1280, 1.1265, 1.1238 and 1.1203. Here, we continue to follow the development of the downward structure of March 20. Continuation of the movement to the bottom is expected after the price passes the noise range of 1.1280 - 1.1265, in this case the goal is 1.1238. For the potential value for the downward movement, we consider the level of 1.1203, after reaching which, we expect to go into a correction. The short-term upward movement is possible in the corridor 1.1318 - 1.1341. The breakdown of the latter value will lead to in-depth movement. Here, the target is 1.1378. This level is a key support for the upward structure. The main trend is the formation of the downward structure of March 20. Trading recommendations: Buy 1.1318 Take profit: 1.1340 Buy 1.1345 Take profit: 1.1376 Sell: 1.1265 Take profit: 1.1240 Sell: 1.1236 Take profit: 1.1205
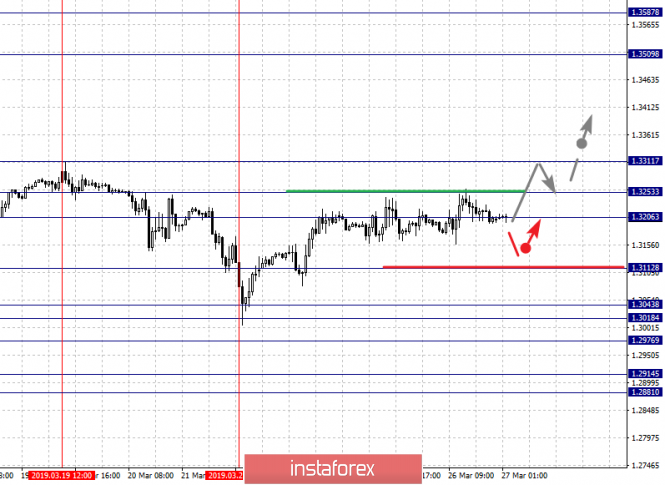
For the Pound / Dollar pair, the key levels on the H1 scale are 1.3253, 1.3206, 1.3161, 1.3043, 1.3018, 1.2976, 1.2914 and 1.2881. Here, the situation is in equilibrium: the downward structure of March 19 and the upward potential of March 21. Short-term upward movement is possible in the corridor 1.3206 - 1.3253. The latter is a key support for the downward structure of March 19. Its breakdown will have to develop the upward cycle. Here, the first target is 1.3311. Continuation of the movement to the bottom is expected after the breakdown 1.3112. In this case, the first goal is 1.3043. A passage at the price of the noise range 1.3043 - 1.3018 will lead to the development of a downward trend on the H1 scale. Here, the goal is 1.2976, and consolidation is near this level. The breakdown of the level 1.2976 should be accompanied by a pronounced downward movement. In this case, the target is 1.2914. For the potential value for the downward structure, we consider the level of 1.2881, after reaching which, we expect a rollback to the top. The main trend is the equilibrium situation (the potential is shifted towards the upward structure of March 21). Trading recommendations: Buy: 1.3208 Take profit: 1.3250 Buy: 1.3255 Take profit: 1.3310 Sell: 1.3112 Take profit: 1.3045 Sell: 1.3016 Take profit: 1.2978
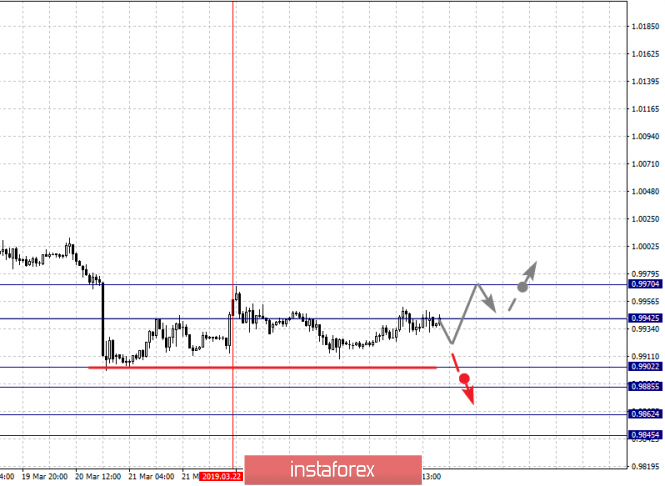
For the Dollar / Frank pair, the key levels on the H1 scale are: 0.9970, 0.9942, 0.9928, 0.9902, 0.9885, 0.9862 and 0.9845. Here, the price has entered an equilibrium situation and so far we do not observe pronounced initial conditions for the top. Short-term downward movement is possible in the corridor 0.9902 - 0.9885. The breakdown of the latter value should be accompanied by a pronounced downward movement. Here the goal is 0.9862. For the potential value of the bottom, we consider the level of 0.9845, after reaching which, we expect consolidation. Short-term upward movement is possible in the corridor 0.9942 - 0.9970. The breakdown of the latter value will have to form an upward structure. In this case, the goals have not yet been defined. The main trend is the equilibrium situation. Trading recommendations: Buy : 0.9943 Take profit: 0.9970 Sell: 0.9902 Take profit: 0.9886 Sell: 0.9883 Take profit: 0.9862
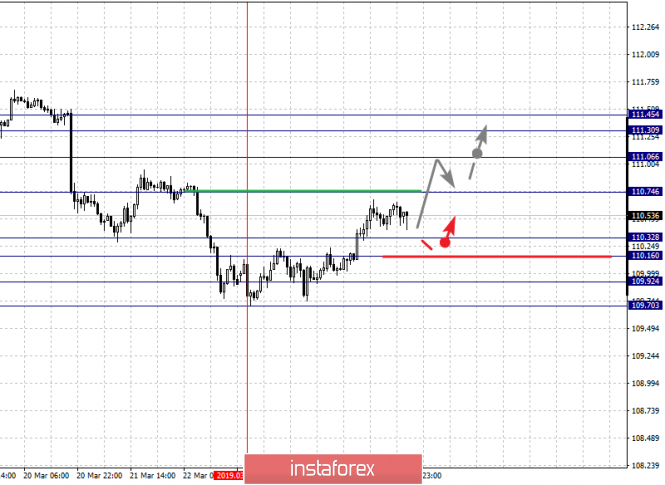
For the Dollar / Yen pair, the key levels on the scale are: 111.45, 111.30, 111.06, 110.74, 110.32, 110.16, 109.92 and 109.70. Here, the price has issued a pronounced ascending structure of March 25. Continuation of the movement to the top is expected after the breakdown of 110.74. In this case the goal is 111.06, which is near the price consolidation. For the potential value of the top, we consider the level of 111.45, after reaching which, we expect a rollback to the bottom. Short-term downward movement is possible in the corridor 110.32 - 110.16. The breakdown of the latter value will lead to a prolonged correction. Here, the goal is 109.92. This level is a key support for the upward structure. Its breakdown will lead to the development of a downward trend. In this case, the first goal is 109.70. The main trend is the rising structure of March 25. Trading recommendations: Buy: 110.75 Take profit: 111.05 Buy: 111.07 Take profit: 111.30 Sell: 110.32 Take profit: 110.16 Sell: 110.14 Take profit: 109.92
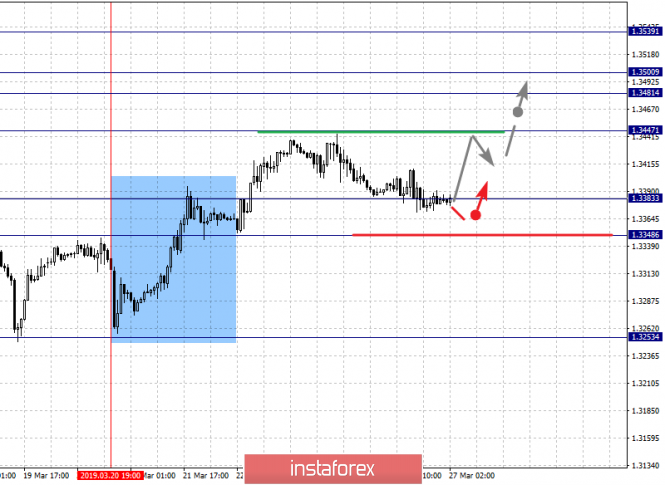
For the Canadian dollar/ Dollar pair, the key levels on the H1 scale are: 1.3539, 1.3500, 1.3481, 1.3447, 1.3383 and 1.3348. Here, we are following the development of the ascending structure of March 20. Continuation of the movement to the top is expected after the breakdown of 1.3447. In this case, the goal is 1.3481, in the corridor of the 1.3481 – 1.3500 consolidation. For the potential value of the top, we consider the level 1.3539, upon reaching which, we expect a correction. Short-term downward movement is possible in the corridor 1.3383-1.3348. The breakdown of the last value will have to form the expressed initial conditions for the downward cycle. Buy: 1.3447 Take profit: 1.3480 Buy : 1.3500 Take profit: 1.3539 Sell: 1.3381 Take profit: 1.3350
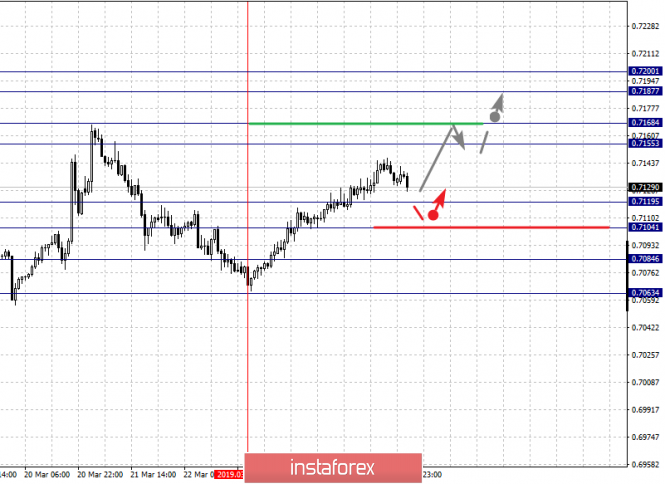
For the Australian dollar / Dollar pair, the key levels on the H1 scale are : 0.7200, 0.7187, 0.7168, 0.7155, 0.7119, 0.7104, 0.7084 and 0.7063. The main trend is the formation of the ascending structure of March 25. Here, we are following the formation of the ascending structure of March 25. Short-term movement to the top is expected in the range of 0.7155 - 0.7168. The breakdown of the latter value will allow movement to a potential target - 0.7200. After reaching this level, we expect consolidation in the corridor 0.7187 - 0.7200, as well as rollback to the bottom. Short-term downward movement is possible in the corridor 0.7119 - 0.7104. The breakdown of the latter value will lead to a prolonged correction. Here, the target is 0.7084. This level is a key support for the upward structure from March 25. Its breakdown will allow to count on movement to a potential target - 0.7063. Trading recommendations: Buy: 0.7155 Take profit: 0.7166 Buy: 0.7170 Take profit: 0.7187 Sell : 0.7119 Take profit : 0.7106 Sell: 0.7102 Take profit: 0.7085
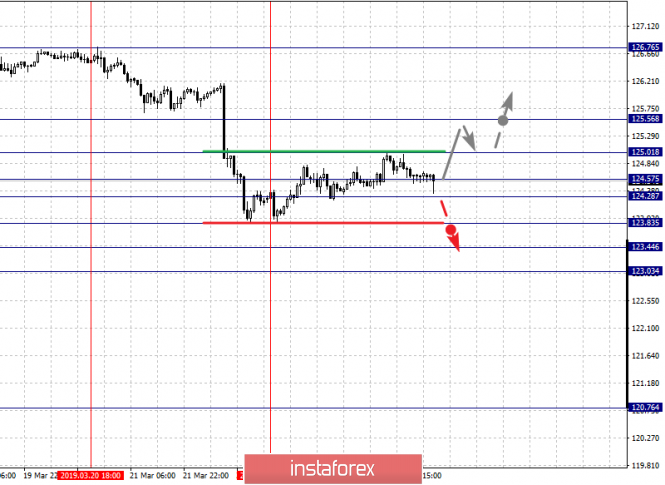
For the Euro / Yen pair, the key levels on the H1 scale are: 125.56, 125.01, 124.57, 124.28, 123.83, 123.44 and 123.03. Here, we are following the development of the downward structure from March 20, at the moment the price is in the correction. Continuation of the movement to the bottom is expected after the breakdown of 123.83. Here the target is 123.44, in the corridor 123.83 - 123.44 of price consolidation. For the potential value for the downward movement, we consider the level of 123.03, after reaching which, we expect a rollback to the top. Consolidation is possible in the corridor 124.28 - 124.57. The breakdown of the latter value will lead to a prolonged correction. Here, the target is 125.01. This level is a key support for the bottom. Its breakdown by price will allow us to count on the movement to the potential target - 125.56. The main trend is the downward structure of March 20, the stage of correction. Trading recommendations: Buy: 124.60 Take profit: 125.00 Buy: 125.05 Take profit: 125.55 Sell: 123.80 Take profit: 123.48 Sell: 123.42 Take profit: 123.06
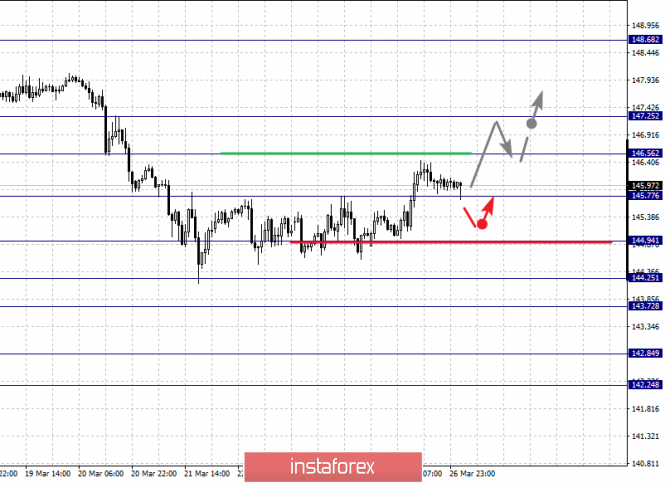
For the Pound / Yen pair, the key levels on the H1 scale are : 147.25, 146.56, 145.77, 144.94, 144.25, 143.72, 142.84 and 142.24. Here, we continue to follow the development of the downward cycle of March 14. Continuation of the movement to the bottom is expected after the breakdown of 144.94. In this case, the first goal is 144.25. Short-term downward movement is possible in the corridor 144.25 - 143.72. The breakdown of the latter value should be accompanied by a pronounced downward movement. Here, the target is 142.84. For the potential value of the bottom, we consider the level of 142.24, after reaching which, we expect a rollback to the top. Short-term ascending movement is possible in the corridor 145.77 - 146.56. The breakdown of the latter value will lead to the development of the ascending structure. Here, the first goal is 147.25, and up to this level, we expect clearance of expressed initial conditions. Trading recommendations: Buy: 145.80 Take profit: 146.55 Buy: 146.65 Take profit: 147.25 Sell: 144.94 Take profit: 144.25 Sell: 143.70 Take profit: 142.86 The material has been provided by InstaForex Company - www.instaforex.com |
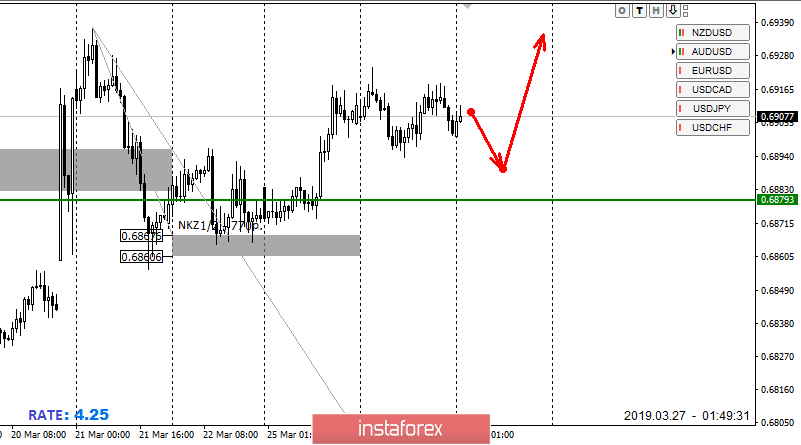
| Posted: 26 Mar 2019 05:34 PM PDT Last week, the pair tested NKZ 1/2 0.6867-0.6860, which led to an increase in demand. Upward movement is impulsive in the medium term. Now we can state the formation of a local accumulation zone, where the extremes of last week come to the fore. Movement within the upward impulse allows you to hold purchases and look for favorable prices for re-entry. Yesterday's low should be used to find the "false breakout" pattern in case of its retest on today's movement. This will give you the opportunity to re-enter a long position. To break the upward momentum, the pair will be required to fall to the NKZ a mentioned above. When the next US session closes, the rate should be below the level of 0.6860. If this happens, the upward movement is considered complete, and sales will come to the fore. The probability of implementing this model is at 30%, which does not make it possible for us to consider selling from current levels, since they will not be profitable at a distance. Daily KZ - daily control zone. The zone formed by important data from the futures market, which change several times a year. Weekly KZ - weekly control zone. The zone formed by the important marks of the futures market, which change several times a year. Monthly KZ - monthly control zone. The zone, which is a reflection of the average volatility over the past year. The material has been provided by InstaForex Company - www.instaforex.com |
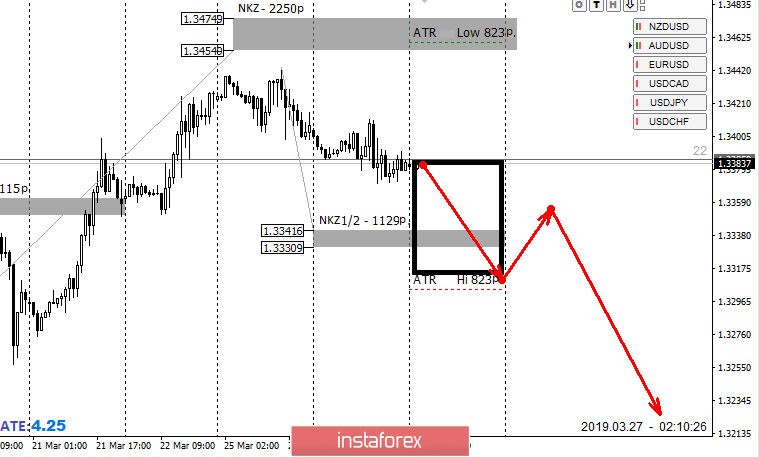
| Posted: 26 Mar 2019 05:33 PM PDT Today, the main support will be the NKZ 1/2 1.3341-1.3330. The test of this zone will make it possible for you to get favorable prices for the purchase. The upward movement is still a medium-term impulse, therefore the growth target is the weekly short-term of 1.3474-1.3454. Purchases must be calculated in such a way that the risk-to-profit ratio when making a transaction is greater than 1 to 3. This week's downward movements do not go beyond the limits of the average daily movement, which speaks of an impulsive attribute. For the formation of a reversal descending model, the pair will need to fall to the NKZ 1/2 and its breakdown with consolidation lower during the US session. If this happens, you will have to give up purchases and start searching for a pattern for selling the instrument. Daily KZ - daily control zone. The zone formed by important data from the futures market, which change several times a year. Weekly KZ - weekly control zone. The zone formed by the important marks of the futures market, which change several times a year. Monthly KZ - monthly control zone. The zone, which is a reflection of the average volatility over the past year. The material has been provided by InstaForex Company - www.instaforex.com |
| March 25, 2019 : GBP/USD Intraday technical outlook and trade recommendations. Posted: 26 Mar 2019 08:29 AM PDT
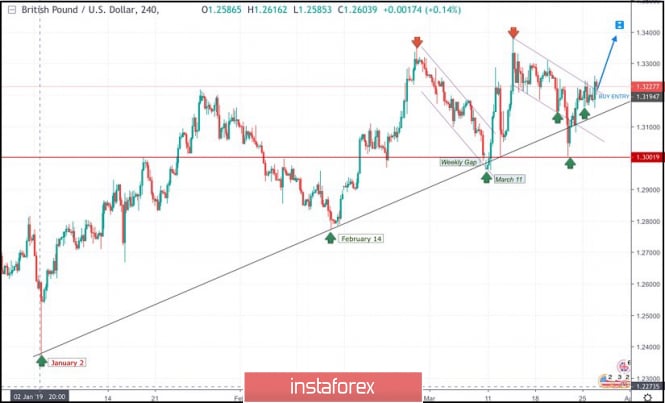
On January 2nd, the market initiated the depicted uptrend line around 1.2380. This uptrend line managed to push price towards 1.3200 before the GBP/USD pair came to meet the uptrend again around 1.2775 on February 14. Another bullish wave was demonstrated towards 1.3350 before the bearish pullback brought the pair towards the uptrend again on March 11. A weekly bearish gap pushed the pair slightly below the trend line (almost reaching 1.2960) before the bullish breakout above short-term bearish channel was achieved on March 11. Bullish persistence above 1.3060 allowed the GBPUSD pair to pursue the bullish momentum towards 1.3130, 1.3200 then 1.3360 where the recent bearish pullback was initiated. Bullish persistence above 1.3250 was needed for confirmation of a bullish Flag pattern. However, significant bearish pressure was demonstrated below 1.3250. Hence, the short term outlook turned to become bearish towards 1.3120 - 1.3100 where the depicted uptrend line failed to provide any immediate bullish support. Bearish breakout below 1.3100 allowed quick bearish decline towards 1.3000 where the current bullish momentum that brought the pair back above 1.3200 was initiated (False bearish breakout). Today, The price level around 1.3250 stands as an Intraday resistance/supply level that needs to be broken to the upside for confirmation of the depicted flag pattern bullish breakout. On the other hand, bearish rejection around 1.3250 may initiate bearish decline towards 1.3180 then 1.3100 thus remainin within the current consoliation range. Trade Recommendations: Intraday traders should wait for a bullish breakout above (1.3250) on H1 chart. Bullish projection levels to be located around 1.3320 then 1.3400. SL to be placed above 1.3180. The material has been provided by InstaForex Company - www.instaforex.com |
| Bitcoin analysis for March 26, 2019 Posted: 26 Mar 2019 08:25 AM PDT BTC has been trading downwards as we expected. The price tested the level of $3.847 and reached our both downward targets.
According to the h1 time – frame, we found the excess (pin bar, aggressive buyers) after the sell off in the background, which is sign that we got some swap from selling to buying power. Most recently, there is the breakout of the intraday bullish flag pattern, which is sign that upward movement may resume. Support levels are seen at $3.911, $3.936 and $3.975. Key support is set at the price of $3.847. Trading recommendation: We reached both yesterday's downward targets and we started to buy BTC from $3.900 with targets at $3.936 and $3.975. Protective stop is placed at $3.845. The material has been provided by InstaForex Company - www.instaforex.com |
| Posted: 26 Mar 2019 08:17 AM PDT 4-hour timeframe The amplitude of the last 5 days (high-low): 70p - 126p - 223p - 143p - 86p. Average amplitude for the last 5 days: 130p (135p). The British pound sterling is trading in different directions during the second trading day of the week, without a definite trend, and moreover inside the Ichimoku cloud. Total confusion is present not only in the British Parliament, but also on the GBP/USD pair. Yesterday, it became known that three more high-ranking officials had resigned as part of a protest against the policy of Theresa May. Recall that earlier, several ministers had already submitted their resignation. The Brexit process itself is in complete impasse. Hope for a favorable outcome rests not with Theresa May, but with the parliament, which tomorrow will hold a series of votes on all sorts of options for leaving the country from the EU, including the rejection of Brexit. The most interesting thing that may well be a situation where none of the options will not be approved by the majority. It is difficult to say whether there were similar cases in world history. What will happen in this case is even harder to say than to assume whether Brexit will take place now, almost three years after the referendum, after almost three years of negotiations with the EU. Technical factors are now frankly secondary. Firstly, because any news could potentially send a pound in one direction or another for 100-200 points, despite the technical picture, and secondly, because of the nature of the pair's movement, the technique now looks not very "beautiful." The pound is still frankly lucky that, given the entire fundamental background, it still does not trade below 1.2500. Trading recommendations: The GBP/USD currency pair is now in a difficult situation with the absence of any tendency substantiated by anything. Perhaps tomorrow will shed light on at least the near future of Britain and the fate of Brexit, which, in turn, will allow the pair to breathe more freely. In addition to the technical picture should also take into account the fundamental data and the time of their release. Explanation of the illustration: Ichimoku indicator: Tenkan-sen - the red line. Kijun-sen - the blue line. Senkou Span A - light brown dotted line. Senkou Span B - light purple dotted line. Chinkou Span - green line. Bollinger Bands indicator: 3 yellow lines. MACD Indicator: Redline and histogram with white bars in the indicator window. The material has been provided by InstaForex Company - www.instaforex.com |
| EUR/USD. March 26. Results of the day. The euro at a loss. Where to look next? Posted: 26 Mar 2019 08:17 AM PDT 4-hour timeframe The amplitude of the last 5 days (high-low): 28p - 112p - 95p - 118p - 43p. Average amplitude for the last 5 days: 79p (79p). At the European trading session on Tuesday, March 26, the US dollar rose against the European currency, but the pair did not manage to leave below the previous local minimum. Thus, the pair retains both the chances for further downward movement and the chances for the beginning of the formation of a new uptrend, which is more preferable, based on the long-term distribution of forces between the economies of the US and the EU. It should also be noted that the pair continues to trade within the Ichimoku cloud, so the "dead cross" sell signal remains weak. Thus, in the current situation, it remains to wait for clarification. Important fundamental data neither yesterday nor today were available to traders. As for the US dollar, despite the fall in yields on 10-year bonds, a lot of talk about recession, the huge public debt of the United States and the fact of such an odious president like Donald Trump, this currency continues to hold positions against the euro currency. This is especially well seen on higher timeframes. The European Union has nothing to hide in macroeconomic terms. The growth rates of its economy are inferior to those of the United States, it's not even worth talking about monetary policy, and the divorce process with the UK can still result in a "tough" scenario. In general, the key factors are now technical, trading should now be done with heightened accuracy - there is no pronounced trend, and in the long run - in general, flat. Trading recommendations: The pair EUR / USD is trying to resume the downward movement. Thus, short positions in small lots are now recommended for the support level of 1.1234. Buy orders are recommended to be considered if the pair succeeds in consolidating back above the critical line, with a view to the resistance level of 1.1409. In addition to the technical picture should also take into account the fundamental data and the time of their release. Explanation of the illustration: Ichimoku indicator: Tenkan-sen - the red line. Kijun-sen - the blue line. Senkou Span A - light brown dotted line. Senkou Span B - light purple dotted line. Chinkou Span - green line. Bollinger Bands indicator: 3 yellow lines. MACD Indicator: Redline and histogram with white bars in the indicator window. The material has been provided by InstaForex Company - www.instaforex.com |
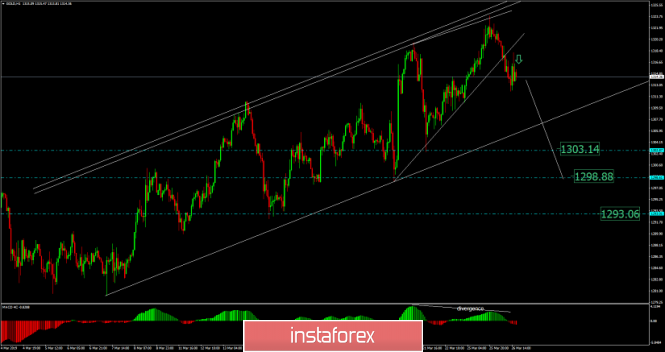
| Analysis of Gold for March 26, 2019 Posted: 26 Mar 2019 08:17 AM PDT Gold has been trading downwards. The price tested the level of $1.312.00 We expect downside movement.
Gold did breakout of the 5-day upward trendline, which acted like support for days. This is a sign that buyers lost the interest in the Gold and that sellers started the distribution process. We do expect potential test of the short-term support at $1.303.15 and then potently the testing of $1.298.90 and $1.293.00. Key short-term resistance is set at the price of $1.323.70. Trading recommendation: We exited long position and started to sell Gold from $1.314.20 with targets at $1.303.15, $1.298.90 and $1.293.00. Protective stop is placed at $1.324.00. The material has been provided by InstaForex Company - www.instaforex.com |
| Posted: 26 Mar 2019 07:57 AM PDT 4-hour timeframe Technical details: The upper linear regression channel: direction - up. The lower linear regression channel: direction - sideways. Moving average (20; smoothed) - sideways. CCI: -20.9130 The GBP / USD currency pair continues to trade along the moving average line. Meanwhile, the British parliament realized that Theresa May could not offer anything new except for her Brexit plan, and her only strategy was to threaten the government with a "tough" version of Brexit and took control of the situation. A member of the Conservative Party, Oliver Letwin, put to the vote an amendment that allows the parliament on March 27 to vote for absolutely any Brexit options, and this amendment was adopted by a majority of parliamentarians. Thus, on March 27, bypassing Theresa May, the parliament will vote for all sorts of scenarios of leaving the EU, including a repeated referendum and a refusal to leave the European Union. It is difficult to say whether this is good news, but it is definitely a shift from the "dead" place where the country was led by the prime minister. Thus, tomorrow during the day we will be able to find out what the British Parliament wants, which rejected the options of "tough" Brexit and Brexit according to the "Checkers" plan. Theresa May's reaction to this event has not yet happened, but for some reason, it seems that her political career will result in the failure to accept the Brexit agreement and the subsequent resignation by agreement. Tomorrow's trading can be distinguished by high volatility and tool jerks from side to side. Nearest support levels: S1 - 1.3184 S2 - 1.3123 S3 - 1.3062 Nearest resistance levels: R1 - 1.3245 R2 - 1.3306 R3 - 1.3367 Trading recommendations: The pair GBP / USD continues the upward correction. In the coming days, the pair may again "storm", so with the opening of any position, it is recommended to be careful. News from the UK can have a strong impact on the currency pair. In addition to the technical picture should also take into account the fundamental data and the time of their release. Explanations for illustrations: The senior linear regression channel is the blue lines of the unidirectional movement. The junior linear channel is the purple lines of the unidirectional movement. CCI is the blue line in the indicator regression window. The moving average (20; smoothed) is the blue line on the price chart. Murray levels - multi-colored horizontal stripes. Heikin Ashi is an indicator that colors bars in blue or purple. The material has been provided by InstaForex Company - www.instaforex.com |
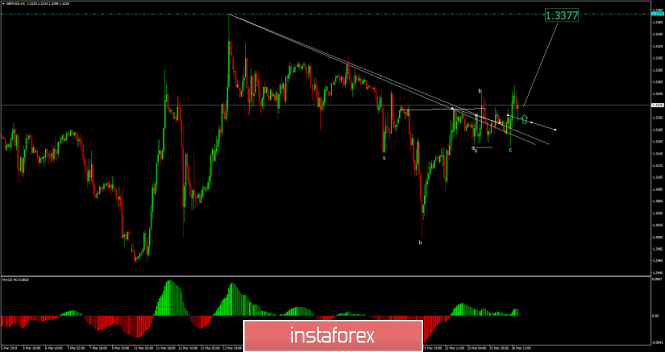
| GBP/USD analysis for March 26, 2019 Posted: 26 Mar 2019 07:55 AM PDT GBP/USD has been trading sideways at the price of 1.3225 but we expect the further upward movement and potential test of 1.3377.
Gold price remains in a bullish short-term trend. The supply trendline has been broken and price remains above 1.3220. The last couple of sessions price mainly moves sideways between 1.3157 and 1.3260. This consolidation might be followed by a new bullish momentum towards 1.3377. There is also a confirmed inverted head and shoulders pattern, which is another sign of the potential strength. As long as the support at the price of 1.3155 we remain bullish. Trading recommendation: We are long GBP from 1.3225 and with target at 1.3377. Protective stop is placed at 1.3140. The material has been provided by InstaForex Company - www.instaforex.com |
| Posted: 26 Mar 2019 07:49 AM PDT 4-hour timeframe Technical details: The upper linear regression channel: direction - down. The lower linear regression channel: direction - down. Moving average (20; smoothed) - down. CCI: -80.7398 On Tuesday, March 26, the EUR/USD currency pair corrected almost to the moving average line and resume the downward movement. At least this is what the trading system shows. The second closed bar of the blue color indicator Heikin Ashi will signal a downward reversal. Important macroeconomic reports today from Europe are not expected. Information on the housing price index, the number of building permits received and the level of consumer confidence will come from America. However, these reports are far from the most important, so the reaction of traders to them can be very restrained or absent altogether. Thus, the foreground will remain the technical factors that so far predict the Euro currency another fall. Although, as we said earlier, from a fundamental point of view, the confrontation between the dollar and the euro has leveled off due to the Fed's refusal from the course of systematic monetary tightening. The advantage still remains with the US currency, but it is not as clear as it was before. Therefore, taking into account the fact that over the past few months, the pair has not been able to build an uptrend or overcome 1.1200, there are more chances now to form an uptrend. Nearest support levels: S1 - 1.1292 S2 - 1.1261 S3 - 1.1230 Nearest resistance levels: R1 - 1.1322 R2 - 1.1353 R3 - 1.1383 Trading recommendations: The EUR/USD currency pair may resume a downward movement. Thus, it is now recommended to consider sell orders with targets at 1.1292 and 1.1261. Turning the Heikin Ashi indicator down will signal the opening of the short positions. Buy positions can be considered no earlier than fixing the pair back above the moving average line with targets at 1.1353 and 1.1383 since the trend, in this case, will change to ascending. In addition to the technical picture should also take into account the fundamental data and the time of their release. Explanations for illustrations: The senior linear regression channel is the blue lines of the unidirectional movement. The younger linear regression channel is the purple lines of the unidirectional movement. CCI - blue line in the indicator window. The moving average (20; smoothed) is the blue line on the price chart. Murray levels - multi-colored horizontal stripes. Heikin Ashi is an indicator that colors bars in blue or purple. The material has been provided by InstaForex Company - www.instaforex.com |
| Increasing the slope of the yield curve of treasuries could stir up the currency markets Posted: 26 Mar 2019 07:26 AM PDT Last Friday, for the first time since 2007, the US government bond yield curve took the form of inversion, which is considered to be an indicator of the approaching recession in the US economy. Meanwhile, according to ex-Fed Chairman Janet Yellen, the market hints more at a reduction in interest rates in the United States, rather than foreshadowing a recession. At least, this is indicated by futures on the federal funds rate. At the same time, it is possible that Federal Reserve is currently refraining from tightening monetary policy so that later it does not have to drastically reduce the rate and pull the country's economy out of recession. In particular, in 2016, a similar pause was enough to bring the United States back onto the path of growth and even demonstrate impressive acceleration. The same opinion is shared by the ECB, the Bank of Japan and the National Bank of China. It is possible that they are now trying to repeat the same trick that worked three years ago. Experts at Morgan Stanley believe that the yield curve of American treasuries in the area from 3 months to 10 years should remain inverted at least until the June Fed meeting before the regulator begins to feel "discomfort". "If the inversion persists longer, the Central Bank will probably begin to consider the steps necessary to support the economy," representatives of the financial institute noted. Nomura believes that the market will be laid on a more aggressive reduction in the interest rates of the Fed only if there are real signs of a slowdown in the US economy. "When large rates on recession appear, then there will be no flattening and inversion of the yield curve, but a sharp increase in its angle of a tilt against the background of a decrease in the Central Bank rate. Under these conditions, currency fluctuations will increase," experts said. The material has been provided by InstaForex Company - www.instaforex.com |
| Analysis of the EUR / USD divergence on March 26. The end of the pair = new fall? Posted: 26 Mar 2019 06:49 AM PDT 4h As seen on the 4-hour chart, the EUR/USD pair returned to the retracement level of 38.2% (1.1328) and rebounded from it with a reversal in favor of the US dollar. Thus, on March 26, the fall in quotations can be continued in the direction of the retracement level of 23.6% (1.1269). On the current chart, emerging divergences are not observed in any indicator. Closing the pair above the Fibo level of 38.2% will work in favor of the European currency and the resumption of growth in the direction of the next retracement level of 50.0% (1.1374). The Fibo grid is based on extremes of January 10, 2019, and March 7, 2019. Daily As seen on the 24-hour chart, the quotes of the pair fell to the retracement level of 127.2% (1.1285). Rebounding the pair's rate from the Fibo level of 127.2% will allow traders to expect a turn in favor of the EU currency and some growth in the direction of the retracement level of 100.0% (1.1553). Fixing the pair quotations below the Fibo level of 127.2% will increase the probability of a further fall in the direction of the next retracement level of 161.8% (1.0941). The Fibo grid is based on extremes of November 7, 2017, and February 16, 2018. Trading recommendations: Buy deals on EUR/USD pair can be opened with the target at 1.1374 if the pair closes above the level of 1.1374. The stop loss order should be placed under the retracement level of 38.2%. Sell deals on EUR/USD pair can be carried out now with the target at 1.1269, as the pair completed the rebound from the retracement level of 1.1328. The stop loss order should be placed above the Fibo level of 38.2%. The material has been provided by InstaForex Company - www.instaforex.com |
| Posted: 26 Mar 2019 06:32 AM PDT 4h As seen on the 4-hour chart, the GBP/USD pair completed the passage of the last bearish divergence peak. Thus, the growth of quotations can be continued today in the direction of the retracement level of 100.0% (1.3300). Rebounding the course of the pair from this level will again allow us expecting a reversal in favor of the American currency and a slight drop in the direction of the retracement level of 76.4% (1.3094). Closing the pair above the Fibo level of 100.0% will increase the chances for further growth in the direction of the next retracement level of 127.2% (1.3534). The Fibo grid is built on the ground of extremums from September 20, 2018, and January 3, 2019. 1h As seen on the hourly chart, the pair rebounded several times from the Fibo level of 50.0% (1.3171), then rebound from the retracement level of 38.2% (1.3220) and a decrease back to the level of 50.0%. The new release of quotes on March 26 from the Fibo level of 50.0% will again work in favor of the British currency and some growth in the direction of the retracement level of 38.2%. Fixing the rate below the Fibo level of 50.0% will make it possible to expect a continuation of a fall in the direction of the next retracement level of 61.8% (1.3121). The Fibo grid is built on the grounds of the extremums from March 11, 2019, and March 13, 2019. Trading advice: Buy deals on GBP/USD pair can be opened with targets at 1.3220 and 1.3281 and a stop loss order under the level of 50.0% if the pair completes another hang-up from the level of 1.3171 (hourly chart). Sell deals on GBP/USD pair can be opened with the target at 1.3121 and a stop loss order above the level of 50.0% if the pair closes below the retracement level of 1.317 1 (hourly chart). The material has been provided by InstaForex Company - www.instaforex.com |
| Posted: 26 Mar 2019 06:32 AM PDT To open long positions on the GBP / USD pair, you need: Pound buyers are gradually returning to the market after news that tomorrow there will be a vote in Parliament for alternative Brexit scenarios. Given this situation, trading will be above the support of 1.3215 as demand for the pound will continue, which leaves a chance for a resumption of the upward correction to the highs of 1.3266 and 1.3316, where I recommend taking profits. In the case of a repeated decline of the pound below the level of 1.3215 amid the news on Brexit, it is best to consider long positions on a rebound from the lows of 1.3166 and 1.3126. To open short positions on the GBP / USD pair, you need: The bears have missed the resistance level of 1.3215 and the main task in the afternoon will be to return to this range. In this scenario, trading will continue in a wider side channel with an upper border of 1.3240 and a lower border of 1.3166. In case of further growth in GBP/USD, it is best to consider short positions on a false breakdown from the resistance of 1.3266 or a rebound from the high of 1.3316. Important fundamental data on the UK economy is not expected today, hence, the whole emphasis will be on the news about Brexit. More in the video forecast for March 26 Indicator signals: Moving averages Trade is conducted above the 30- and 50-medium moving averages, which indicates the bullish nature of the market. Maintaining the given scenario is important in order to update new local maximums. Bollinger bands The downward correction for the pound is limited by the lower limit of the Bollinger Bands indicator in the area of 1.3166. Description of indicators MA (moving average) 50 days - yellow MA (moving average) 30 days - green MACD: fast EMA 12, slow EMA 26, SMA 9 Bollinger Bands 20 The material has been provided by InstaForex Company - www.instaforex.com |
| Posted: 26 Mar 2019 06:18 AM PDT To open long positions on EUR / USD pair, you need: The euro strengthened its position against the US dollar in the first half of the day. However, with the absence of important fundamental statistics in the background, the upward trend could not continue. At the moment, buyers need to break through the resistance level of 1.1324 and a test of which observed in the first half of the day will lead to a further upward correction to the area of 1.1358 and 1.1388 maximum, where I recommend taking profits. In the scenario of returning to the low of the day at the support level of 1.1294, it is best to consider long positions in EUR/USD on the area of 1.1269 or on the rebound from the support of 1.1247. To open short positions on EUR / USD pair, you need: Sellers coped with the task in the morning and did not allow the pair to rise above resistance 1.1324. While the trade is conducted below this range, the pressure on the euro will remain. Yet, the main goal will be to break through and consolidate below the support of 1.1294, which will lead to the formation of a new downward wave and update weekly lows in areas of 1.1269 and 1.1247, where I recommend taking profits. In case that it grew higher than 1.1324 in the second half of the day, it is best to consider short positions in EUR/USD on a rebound from the resistance levels of 1.1358 and 1.1388. More in the video forecast for March 26 Indicator signals: Moving averages Trade is conducted in the area of 30- and 50-medium moving, which indicates the lateral nature of the market with the advantage of sellers. Bollinger bands The volatility of the Bollinger Bands indicator is low, which does not give signals to enter the market. Description of indicators MA (moving average) 50 days - yellow MA (moving average) 30 days - green MACD: fast EMA 12, slow EMA 26, SMA 9 Bollinger Bands 20 The material has been provided by InstaForex Company - www.instaforex.com |
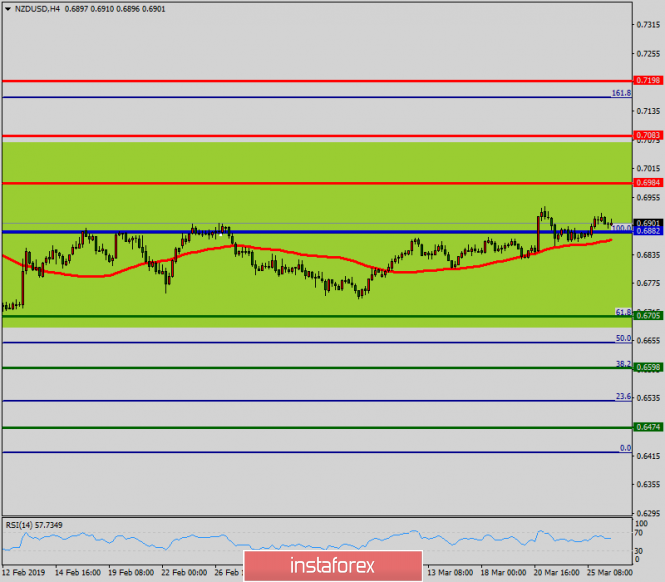
| Technical analysis of NZD/USD for March 26, 2019 Posted: 26 Mar 2019 05:49 AM PDT The NZD/USD pair breached resistance which had turned into strong support at the level of 0.6705. The pair is still moving around the daily pivot point of 0.6882. The level of 0.6705 coincides with a golden ratio, which is expected to act as major support today. The RSI is considered to be overbought, because it is above 70. The RSI is still signaling that the trend is upward as it is still strong above the moving average (100). Besides, note that the pivot point is seen at 0.6882. This suggests that the pair will probably go up in the coming hours. Accordingly, the market is likely to show signs of a bullish trend. In other words, buy orders are recommended to be placed above 0.6800 with the first target at the level of 0.6882. From this point, the pair is likely to begin an ascending movement to 0.6882 and further to 0.6984. The level of 0.6984 will act as strong resistance. On the other hand, if there is a breakout at the support level of 0.6705, this scenario may become invalidated. The material has been provided by InstaForex Company - www.instaforex.com |
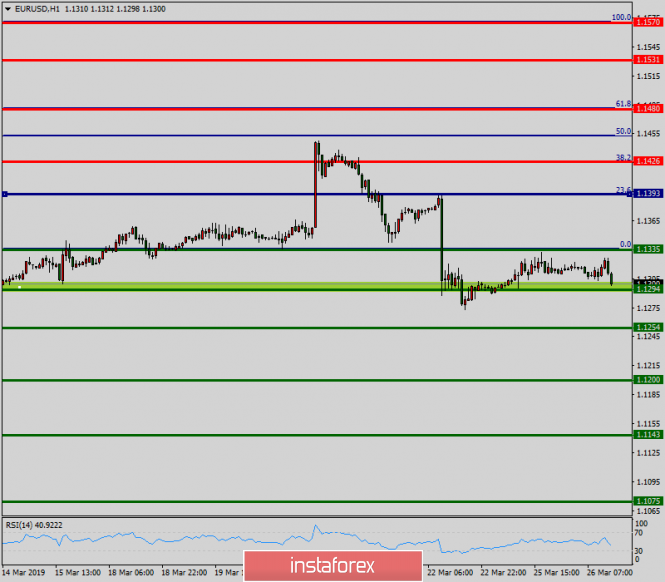
| Technical analysis of EUR/USD for March 26, 2019 Posted: 26 Mar 2019 05:30 AM PDT The EUR/USD pair is trading around the daily pivot point (1.1393). It continued to move downwards from the level of 1.1393 to the bottom around 1.1335. This week, the first resistance level is seen at 1.1393 followed by 1.1426, while the first daily support is seen at 1.1335. Furthermore, the moving average (100) starts signaling a downward trend; therefore, the market is indicating a bearish opportunity below 1.1393. So, it will be good to sell at 1.1393 with the first target at 1.1335. The downtrend is also expected to continue towards 1.1294. The strong daily support is seen at the 1.1254 level. According to the previous events, we anticipate the EUR/USD pair to trade between 1.1393 and 1.1254 in coming hours. The price area of 1.1393 remains a significant resistance zone. Thus, the trend remains bearish as long as the level of 1.1393 is not broken. On the contrary, in case a reversal takes place, and the EUR/USD pair breaks through the resistance level of 1.1393, then a stop loss should be placed at 1.1453. The material has been provided by InstaForex Company - www.instaforex.com |
| Fed decision will support gold, experts say Posted: 26 Mar 2019 04:58 AM PDT According to experts of the investment bank Standard Chartered, the refusal to raise interest rates by the Federal Reserve System (FRS) of the United States is able to support prices for the yellow metal. Experts believe that the Fed may not raise rates this year. Many analysts expected a similar decision from the American regulator. However, it contrasts very strongly with the statement made in December last year. Recall that there were about two possible rate increases in 2019. The abrupt change in the rhetoric of the Fed has forced investors to turn to the gold market once again. They considered the yellow metal to be the safest asset. Note that in 2018 a huge amount of precious metal was removed from the United States. According to the US Geological Survey (USGS), exports of the yellow metal increased by 23% compared with 2017. The USGS stated that America exported 473.6 tons of gold last year and imported 212.8 tons. At the end of 2018, net exports of precious metals amounted to 260.8 tons, which exceeds the data in 2016 by five times. Standard Chartered believes that the macroeconomic background will support the gold market. Moreover, experts believe that the US currency rate will decline in the current situation. The material has been provided by InstaForex Company - www.instaforex.com |
| The dollar is rising against the yen, along with optimism about the global economy Posted: 26 Mar 2019 04:44 AM PDT The dollar begins to compensate for recent losses against the yen after the yield of Treasury bonds rose from 15-month lows and it became clear that investors overestimated the likelihood of a sharp decline in the global economy. The pound is stuck in a narrow range in anticipation of the outcome of a vote of British lawmakers. In general, world markets rolled back after the inversion of the yield curve of US Treasury bonds, which in the past signaled a recession. This supported the dollar, as it shows that the economic outlook remains quite good. The American began to move away from a six-week low of 109.70 yen. Now, we should wait for data on consumer confidence and the housing sector in the United States, these reports will be important signals for the foreign exchange market. The dollar should receive further support if today's economic indicators are sustainable, because strong data may be the only factor preventing further decline in Treasury bond yields. The euro remained under pressure amid growing concerns about a slowdown in the eurozone economy but managed to achieve modest growth after a stronger than predicted indicator of business confidence in Germany. The Australian dollar, sensitive to changes in sentiment regarding risks, increased by 0.15 percent to 0.7123 dollars. The material has been provided by InstaForex Company - www.instaforex.com |
| GBP/USD: a fateful week for Brexit and pound sterling Posted: 26 Mar 2019 04:00 AM PDT
The British Parliament took control of the Brexit process. The House of Commons spoke in favor of holding this week a series of votes on various options for action related to Brexit. Thus, the deputies are trying to find a way out of this situation. The amendment submitted by conservative Oliver Letwin was supported by 329 parliamentarians, 302 were against. It does not specify exactly what alternatives will be offered to deputies. According to the British media, among the options may be a repeated referendum, withdrawal from the EU without an agreement, and maintaining the country's membership in the EU Customs Union and the single European market, and even the abolition of Brexit. "It's obvious that Theresa May's plan failed. It means that trying to put the squeeze on the parliamentarians by forcing them to vote for the third time for the draft agreement, which they have twice rejected, is not the way to solve the problem. Resigning in exchange for supporting the plan is also not an option. To give talks about the conditions for the country's withdrawal from the EU into the hands of ardent supporters of Brexit is not in the interests of British society. The crisis must be resolved by the lawmakers themselves, who are obliged to forget about interparty feuds and unite for the sake of the common cause. If it is not possible to reach a consensus this time, then it will be necessary at least to request a long-term deferment of Brexit from Brussels. The main thing now for Britain is not to overstep the brink, beyond which the state is awaited by chaos and uncertainty," reported by the Financial Times. As for the British currency, it reacted with restraint to the latest news on Brexit. The GBP/USD pair is still in a narrow trading range, awaiting "indicative" voting in the House of Commons for the divorce process. It is assumed that on Wednesday the legislators will vote on a number of alternative strategies for Brexit. It will be an important day for the pound sterling, which will clarify the chances of the United Kingdom to reach a deal with the European Union. |
| Posted: 26 Mar 2019 03:49 AM PDT Perhaps the key event on Monday was the decision of the British Parliament to deprive the Prime Minister Teresa May of control over the exit process from the EU. This decision was made with a ratio of 392-302 votes, which opens up the possibility for voting on alternative Brexit plans. The parliamentarians made this decision after three more ministers from Theresa May's cabinet voted to give parliament control over the exit from the EU and resigned. This is due to the growing discontent with the British Prime Minister and her actions regarding Brexit. Most likely, the vote on alternative scenarios Brexit will take place tomorrow, and we can only guess what it can lead to. There are a lot of scenarios, but one of them, concerning the uncontrolled withdrawal of Great Britain from the EU, can be definitely excluded since parliamentarians have repeatedly stated that such a Brexit scenario is unacceptable. British Prime Minister May said yesterday that for the third vote on the agreement on withdrawal from the EU is not enough to support. This suggests that today's vote on Brexit will not take place. The British Prime Minister also noted that she still expects to hold a third vote in the coming days, since the government is not bound by the conclusions of parliament on the voting process. As for the technical picture of the GBPUSD pair, such decisions will most likely support the pound, since it is precisely possible to exclude the most "catastrophic" scenario. A break above the resistance range of 1.3215 may lead to an increase in demand for the pound, which will open new weekly highs for the bulls near 1.3270 and 1.3315. In the event of a decrease in the pound, good areas will be supported by the 1.3085 and 1.3005. USA The data released yesterday on the American economy did not greatly affect the EURUSD pair since they did not represent much interest. According to the report, the index of national activity of the Fed-Chicago fell in February 2019. This happened due to the slow growth of employment indicators. Thus, the index fell to -0.29 points in February against -0.25 points in January. But production activity in the area of responsibility of the Federal Reserve Bank of Dallas grew in March. According to the report, the Fed-Dallas manufacturing index in March 2019 rose to 11.5 points against 10.1 points in February. The index of total business activity fell to 8.3 points from 13.1 points. Yesterday's speech by the President of the Federal Reserve Bank of Boston, Eric Rosengren, did not impress the market, as in general, he repeated the words of his colleagues who spoke before him. Rosengren believes that the continuing reduction in the assets balance of the US Federal Reserve System was not the cause of volatility in the financial market, which would allow the regulator to take a wait-and-see attitude towards interest rates. As for the technical picture of the EURUSD pair, it remained unchanged. The trading instrument keeps the intermediate level of 1.1295 from further falling, a breakthrough of which will increase the pressure on risky assets and will lead to the updating of last week's lows in the areas of 1.1270 and 1.1225. With an upward correction, the growth of the euro was already limited by the level of 1.1330, however, its repeated test may lead to a larger upward movement in the area of resistance 1.1355. The material has been provided by InstaForex Company - www.instaforex.com |
| Posted: 26 Mar 2019 02:43 AM PDT The market stopped waiting for the end of the story with Brexit, which is about to come. Although no macroeconomic statistics came out and the events of yesterday were almost epochal. As a matter of fact, the House of Commons removed Theresa May from solving the issue with Brexit, and her ministers flee from her like rats from a ship. Thus, the Minister for the Affairs of the Middle East and North Africa, as well as deputy ministers for business and industry, as well as health, resigned. They publicly advocated giving the House of Commons the right to independently decide which options for the Brexit situation would be considered on Wednesday. At the same time, the European Union officially announced that it had begun preparations for a "tough" divorce, that is, without an agreement and a transitional period. In fact, Brussels proposes to London either to accept a "divorce" agreement and then the exit will take place on May 22, followed by a transitional period. If the House of Commons rejects the agreement for the third time, then the exit will take place on April 12, and without "preliminary caresses" in the form of a transition period. This is the "hard" option. So on Wednesday, the House of Commons will decide what to do next. There are no many options. You can accept the enslaving agreement and hope that the European Union in the future will appreciate complementing its economic component. You can demonstrate your pride and inflexibility and get a threat of economic disaster. Although in general, these two options from the point of view of the economy are not much different. You can refuse from Brexit at all or hold a second referendum. But the trouble is that the last two options just do not like the great mass of subjects of Her Majesty. Basically, those who belong to supporters of Brexit. So for parliamentarians, these two options are guaranteed to become political suicide. But all this awaits us only on Wednesday. And the result is almost impossible to predict. We do not even know which of the options and in what order will be considered. Parliamentarians will decide tomorrow. Another thing is that someone from British politicians can say something, and the market will immediately start to panic. If the parliamentarians are smart enough to keep their mouths shut, market participants will still sit like knives, and no macroeconomic statistics will be able to bring them to life. But today there are data on construction in the United States. And although the data is not so important, nevertheless it is expected that the number of new construction projects will be reduced by as much as 28.3%. It turns out that the number of new construction projects has decreased by more than a quarter. This will impress anyone. And yes, the number of building permits issued may be reduced by 0.6%, which no one will notice. But the intrigue around tomorrow's meeting of the House of Commons clearly holds the minds and hearts of market participants. The euro/dollar currency pair, forming a slight pullback, concentrated within the level of 1.1300, resulting in amplitude of 1.1290 / 1.1330. It is likely to assume the preservation of the current oscillation, where traders monitor the boundaries for a breakdown when placing trading orders. The currency pair pound/dollar, forming a correctional movement, reached the previously passed cluster of 1.3220, where it formed a narrow range of 1.3170 / 1.3220. It is likely to assume that the current amplitude fluctuation is preserved, where the current cluster already makes it clear to traders that they are waiting for positions on the market that are likely to lead to impulse candles. Now, traders monitor existing boundaries for breakdown and clear fixation before placing trading orders. |
| Forecast for Gold on March 26, 2019 Posted: 26 Mar 2019 02:42 AM PDT Gold (Gold) The price made a deep correction of 61.8% in the period of decline from February 20 to March 7, where it met with the MACD daily scale line. The Marlin oscillator signal line bent down a bit. On the four-hour chart, we see a double-formed divergence with the Marlin oscillator. The transition of the signal line of the oscillator to the negative zone will be the first working signal to lower the price of gold. This transition can take place when the price reaches the level of 50.0% Fibonacci at 1313.30. The target of the mid-term decline at 1276.30 is the support formed by a three-time test in January, which we see on the daily chart. |
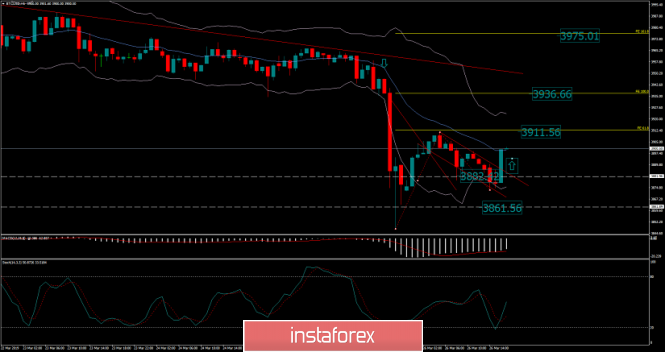
| BITCOIN Analysis for March 26, 2019 Posted: 26 Mar 2019 01:43 AM PDT Bitcoin sank below the Triangle pattern in the support area with a daily close recently which pushed the price down to the edge of $3,880 support area. Despite the formation of the descending Triangle pattern, a sudden breakout below support was a surprise for the bulls. Meanwhile, the price is currently being propelled higher away from the strong support area of $3,800-80. The price managed to reject off the support area quite well but could not establish impulsive counter-momentum to break above the dynamic level of 20 EMA. Moreover, MACD is showing a bullish crossover currently that indicates vaguely further bullish momentum in the coming days. As the price remains below $3,950-$4,000, the bearish pressure is expected to push the price lower with a target towards $3,500-600 support area in the coming days. On the contrary, a break above $4,000 with a daily close will encourage further bullish pressure with an upward target towards $4,500. SUPPORT: 3,500-600, 3,800-80 RESISTANCE: 3,950, 4,000, 4,250, 4,500 BIAS: BEARISH MOMENTUM: VOLATILE
|


| You are subscribed to email updates from Forex analysis review. To stop receiving these emails, you may unsubscribe now. | Email delivery powered by Google |
| Google, 1600 Amphitheatre Parkway, Mountain View, CA 94043, United States | |
No comments:
Post a Comment