
Forex analysis review |
- Fractal analysis of major currency pairs on March 28
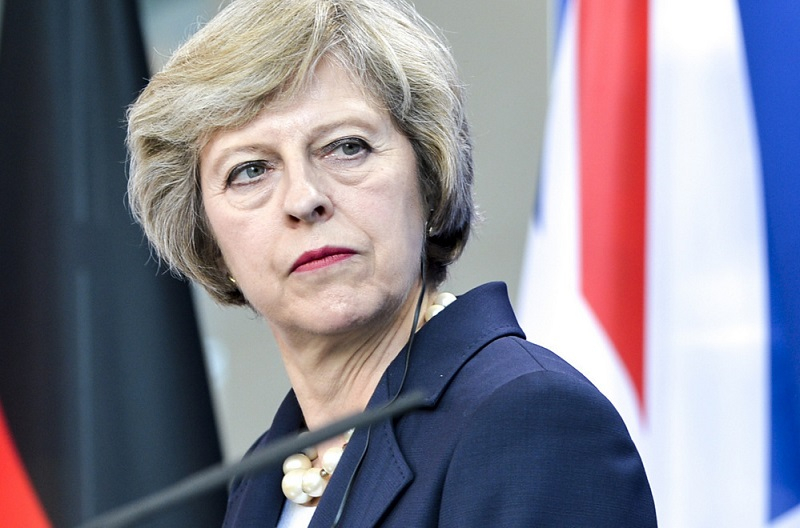
- May will leave in exchange for support of her Brexit proposal
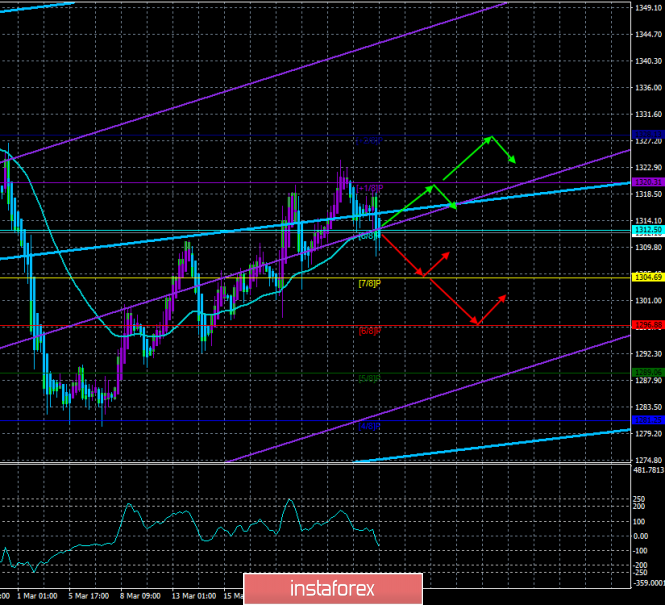
- GOLD. March 27 Trading system "Regression Channels". Gold may respond to UK evening voting
- EUR/USD. March 27. Results of the day. The pair will again test the support area of 1.1200 - 1.1270
- AUD/USD: the aussie can repeat the kiwi's fate
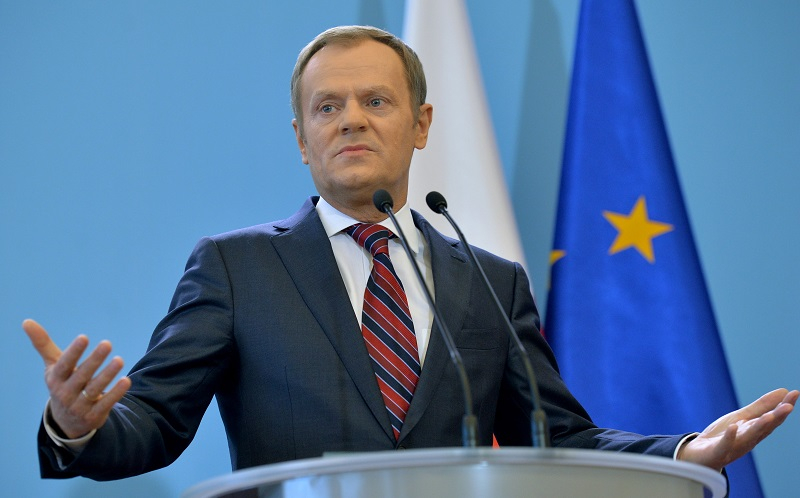
- GBP/USD. March 27. Results of the day. Donald Tusk stands for absolute deferral of Brexit. May goes all-in
- "Kiwi" was the victim of softening the rhetoric of the New Zealand Central Bank, on the order of the "Aussie"?
- Bitcoin analysis for March 27, 2019
- GBP/USD analysis for March 27, 2019
- Analysis of Gold for March 27, 2019
- EURUSD: Why so much attention to the inversion of the yield curve?
- GBP / USD plan for the American session on March 27. Traders are waiting for news on Brexit from the UK Parliament
- EUR / USD plan for the US session on March 27. Speech by ECB President Mario Draghi supported the euro
- March 27, 2019 : EUR/USD Intraday technical analysis and trade recommendations.
- March 27, 2019 : GBP/USD demonstrating a bullish flag pattern for Intraday traders.
- Wave analysis for GBP / USD pair on March 27. Important ballots will take place today but how will this affect the pound?
- Technical analysis of USD/CAD for March 27, 2019
- Wave analysis for EUR / USD pair on March 27. The euro suddenly began to fall again, while the chances of a rising wave remain
- Technical analysis of USD/CHF for March 27, 2019
- Technical analysis of GBP/USD for March 27, 2019
- Central Bank waiting for the beginning of the crisis
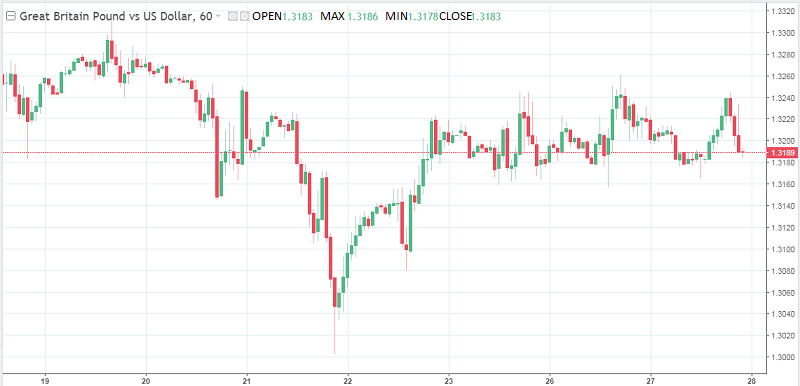
- The dollar is strengthening, and the pound is waiting for an answer to the question: will Britain leave the EU or not?
- Overview of the foreign exchange market on 03/27/2019
- Trading Plan 03/27/2019
- Trading recommendations for the GBPUSD currency pair - placement of trading orders (March 27)
| Fractal analysis of major currency pairs on March 28 Posted: 27 Mar 2019 06:22 PM PDT Forecast for March 28: Analytical review of H1-scale currency pairs:
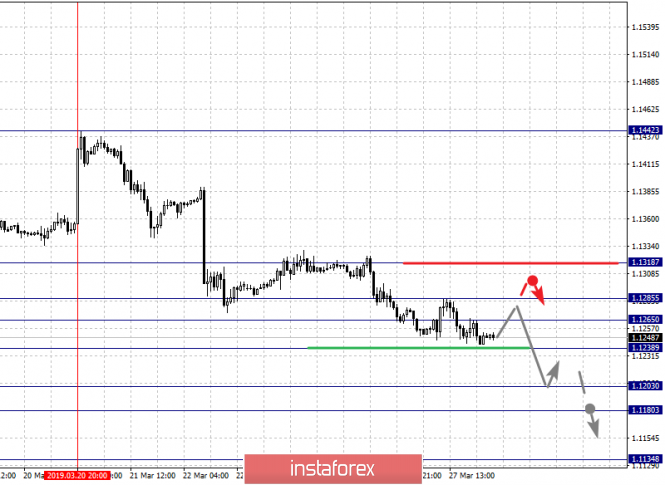
For the euro / dollar pair, the key levels on the H1 scale are: 1.1318, 1.1285, 1.1265, 1.1238, 1.1203, 1.1180 and 1.1134. Here, we continue to follow the development of the downward structure of March 20. Continuation of the movement to the bottom is expected after the breakdown of the level 1.1238. In this case, the target is 1.1203. The price consolidation is in the corridor 1.1203 - 1.1180 . We consider the level 1.1134 to be a potential value for the bottom. After reaching this level, we expect a rollback to the top. Short-term upward movement is possible in the corridor 1.1265 - 1.1285, and breaking the last value will lead to in-depth movement. Here, the goal is 1.1318. This level is a key support for the downward structure. The main trend is the downward structure of March 20. Trading recommendations: Buy 1.1265 Take profit: 1.1283 Buy 1.1287 Take profit: 1.1318 Sell: 1.1236 Take profit: 1.1205 Sell: 1.1203 Take profit: 1.1181
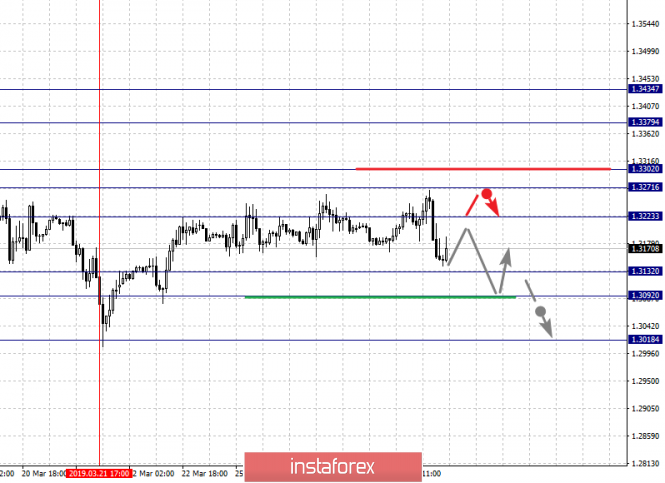
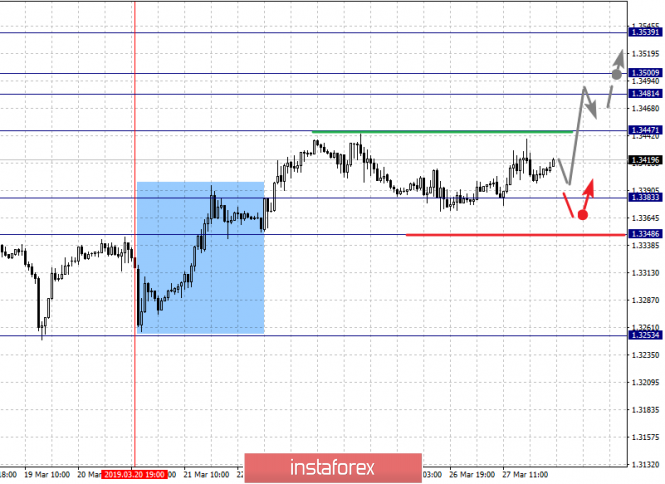
For the pound / dollar pair, the key levels on the H1 scale are 1.3434, 1.3379, 1.3302, 1.3271, 1.3223, 1.3132, 1.3092 and 1.3018. Here, we are following the ascending structure of March 21. Continuation of the movement to the top is expected after the breakdown of the level 1.3223. In this case, the goal is 1.3271. The passage at the price of the noise range 1.3271 - 1.3302 should be accompanied by a pronounced upward movement. Here, the goal is 1.3379. Near this level is the price consolidation. For the potential value to the top, we consider the level of 1.3434. After reaching which, we expect a rollback to the bottom. Short-term downward movement is possible in the range of 1.3132 - 1.3092. Hence, the probability of a reversal to the top and the breakdown of level 1.3092 will have to develop a downward structure. In this case, the first potential target is 1.3018. The main trend is the ascending structure of March 21. Trading recommendations: Buy: 1.3223 Take profit: 1.3270 Buy: 1.3303 Take profit: 1.3379 Sell: 1.3132 Take profit: 1.3093 Sell: 1.3090 Take profit: 1.3020
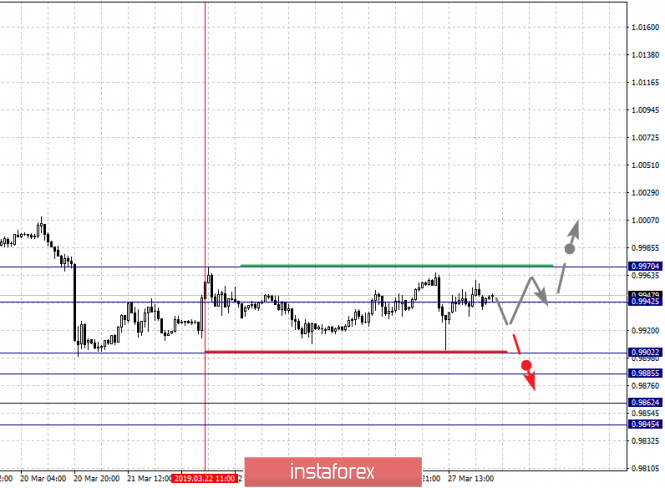
For the dollar / franc pair, the key levels on the H1 scale are: 0.9970, 0.9942, 0.9928, 0.9902, 0.9885, 0.9862 and 0.9845. Here, the situation is in equilibrium. Short-term downward movement is possible in the corridor 0.9902 - 0.9885. The breakdown of the latter value should be accompanied by a pronounced downward movement. Here, the goal is 0.9862. For the potential value of the bottom, we consider the level of 0.9845. After reaching which, we expect a consolidation. Short-term upward movement is possible in the corridor 0.9942 - 0.9970. The breakdown of the latter value will have to form an upward structure. In this case, the goals have not been defined yet. The main trend is the equilibrium situation. Trading recommendations: Buy: 0.9943 Take profit: 0.9970 Sell: 0.9902 Take profit: 0.9886 Sell: 0.9883 Take profit: 0.9862
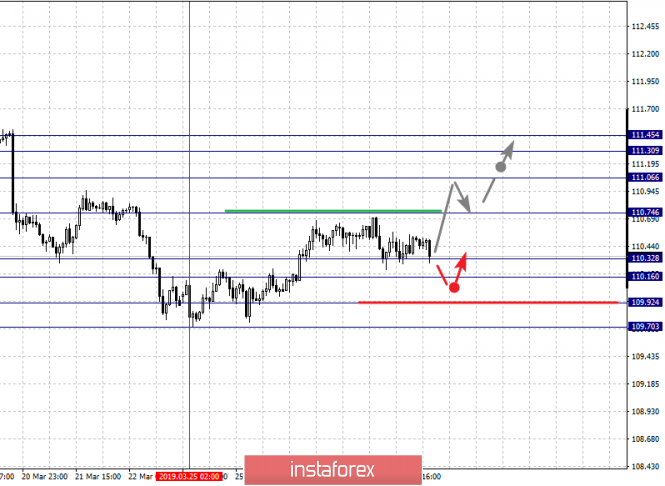
For the dollar / yen pair, the key levels on the H1 scale are: 111.45, 111.30, 111.06, 110.74, 110.32, 110.16, 109.92 and 109.70. Short-term downward movement is possible in the corridor 110.32 - 110.16. The breakdown of the latter value will lead to a prolonged correction. Here, the goal is 109.92. This level is a key support for the upward structure. Its breakdown will lead to the development of a downward trend. In this case, the first goal is 109.70. The main trend: the rising structure of March 25. Trading recommendations: Buy: 110.75 Take profit: 111.05 Buy: 111.07 Take profit: 111.30 Sell: 110.32 Take profit: 110.16 Sell: 110.14 Take profit: 109.92
For Canadian dollar / dollar pair, the key levels on the H1 scale are: 1.3539, 1.3500, 1.3481, 1.3447, 1.3383 and 1.3348. Here, we are following the development of the ascending structure of March 20. Continuation of the movement to the top is expected after the breakdown of 1.3447. In this case, the goal is 1.3481. The price consolidation is in the corridor 1.3481 - 1.3500. For the potential value of the top, we consider the level of 1.3539. After reaching which, we expect to go into a correction. Short-term downward movement is possible in the corridor 1.3383 - 1.3348. The breakdown of the latter value will have to be made for the pronounced initial conditions of the downward cycle. The main trend is the ascending structure of March 20, the stage of correction. Trading recommendations: Buy: 1.3447 Take profit: 1.3480 Buy: 1.3500 Take profit: 1.3539 Sell: 1.3381 Take profit: 1.3350
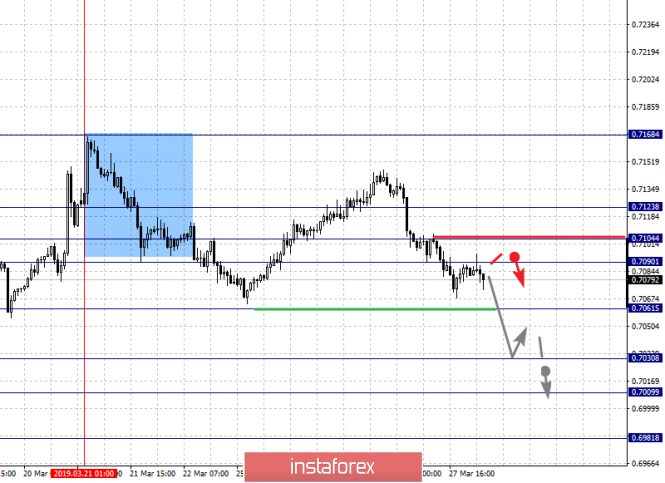
For the Australian dollar / dollar, the key levels on the H1 scale are : 0.7123, 0.7104, 0.7090, 0.7061, 0.7030, 0.7009 and 0.6981. Here, the next target for the downward movement will be determined from the downward structure on March 21st. Continuation of the movement to the bottom is expected after the breakdown to 0.7060. In this case, the goal is 0.7030. The breakdown of which will lead to short-term downward movement in the corridor 0.7030 - 0.7009. For the potential value of the bottom, we consider the level of 0.6981. And from this level, we expect a rollback to the top. Short-term upward movement is possible in the corridor of 0.7090 - 0.7104. The breakdown of the latter value will lead to a prolonged correction. Here, the target is 0.7123. This level is a key support for the downward structure. The main trend is the downward structure of March 21. Trading recommendations: Buy: 0.7090 Take profit: 0.7102 Buy: 0.7106 Take profit: 0.7120 Sell: 0.7060 Take profit: 0.7032 Sell: 0.7028 Take profit: 0.7010
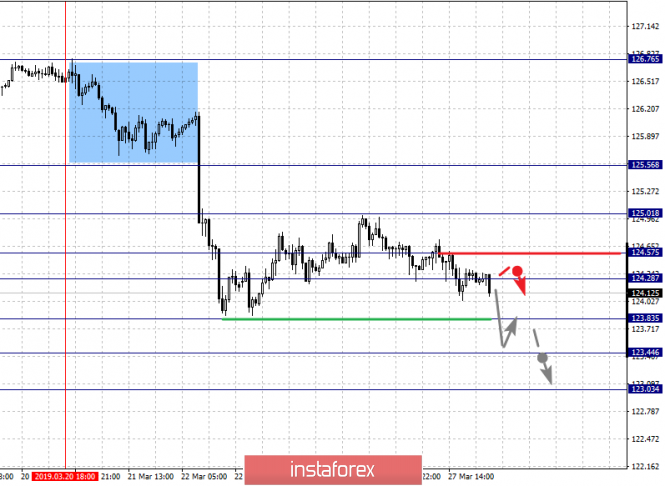
For the euro / yen pair, the key levels on the H1 scale are: 125.56, 125.01, 124.57, 124.28, 123.83, 123.44 and 123.03. Here, we are following the development of the downward structure of March 20. Continuation of the movement to the bottom is expected at level 123.83 after the breakdown. Here, the target is 123.44. The price consolidation is in the corridor 123.83 - 123.44. For the potential value of the downward movement, we consider the level of 123.03. After reaching which, we expect a rollback to the top. The consolidated movement is possible in the corridor 124.28 - 124.57. The breakdown of the latter value will lead to a prolonged correction. Here, the target is 125.01. This level is a key support for the bottom. Its breakdown by price will allow us to count on the movement to the potential target 125.56. The main trend is the downward structure of March 20. Trading recommendations: Buy: 124.60 Take profit: 125.00 Buy: 125.05 Take profit: 125.55 Sell: 123.80 Take profit: 123.48 Sell: 123.42 Take profit: 123.06
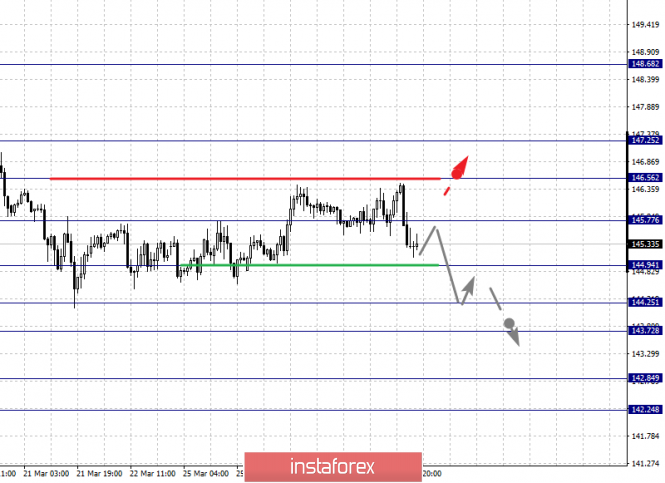
For the pound / yen pair, the key levels on the H1 scale are: 147.25, 146.56, 145.77, 144.94, 144.25, 143.72, 142.84 and 142.24. Here, we continue to follow the development of the downward cycle for March 14. Continuation of the movement to the bottom is expected after the breakdown of 144.94. In this case, the first goal is 144.25. Short-term downward movement is possible in the corridor 144.25 - 143.72. The breakdown of the latter value should be accompanied by a pronounced downward movement. Here, the target is 142.84. For the potential value of the bottom, we consider the level of 142.24. After reaching which, we expect a rollback to the top. Short-term ascending movement is possible in the corridor 145.77 - 146.56. The breakdown of the latter value will lead to the development of the ascending structure. Here, the first goal is 147.25. And up to this level, we expect clearance of expressed initial conditions. The main trend is the downward structure of March 14. Trading recommendations: Buy: 145.80 Take profit: 146.55 Buy: 146.65 Take profit: 147.25 Sell: 144.94 Take profit: 144.25 Sell: 143.70 Take profit: 142.86 The material has been provided by InstaForex Company - www.instaforex.com |
| May will leave in exchange for support of her Brexit proposal Posted: 27 Mar 2019 04:53 PM PDT The British Parliament, taking control of the Brexit process, hopes to find a way out of the impasse. On Wednesday, lawmakers will explore alternatives to the prime mnister's project through a series of so-called "demonstrative" votes. The Theresa May Agreement is still a promising option. In addition, there were rumors that she would leave her position as prime minister in exchange for support of her Brexit proposal. Voting will begin at 19:00, the results are expected by 21:00 London time. It is possible that the ministers will need more time to choose an option they prefer. In this case, the meeting will continue on Monday. Voting may not provide the result that MPs are counting on, but the fact that they have united and challenged the government is already a huge breakthrough. Meanwhile, the pound, which won back losses against the background of traders' belief in a positive outcome of Brexit, is waiting for the results of a new vote. Here is what leading strategists wrote: Credit Agricole CIB "Despite the fact that political uncertainty is likely to continue, our long-term view remains constructive - the pound will rise to $1.39 by September." Newton Asset Management "There is a possibility that MPs will not come to any of the final options, which will further confuse the situation." European Council President Donald Tusk, who spoke on Wednesday at the European Parliament's plenary session in Strasbourg, said that the British should retain the right to revise Brexit plans and be given the time to do so, that is, agree to a lengthy delay. This means that the UK will participate in European elections. Results that may follow a series of votes:
|
| GOLD. March 27 Trading system "Regression Channels". Gold may respond to UK evening voting Posted: 27 Mar 2019 04:21 PM PDT
Technical details: Senior linear regression channel: direction - up. The younger linear regression channel: direction - up. Moving average (20; smoothed) - up. CCI: -88.5593 Gold continues its upward movement, despite the strengthening of the US dollar, if for example, when paired with Eurocurrency. The conclusion is that gold is now in demand, and the US dollar is not getting any cheaper, which is reflected in the growth of "gold" quotes. At the moment, the tool has been adjusted to the moving average line and may even be fixed below it. However, the last three fixings below the moving within the current uptrend turned out to be false. Therefore, it might happen this time. Thus, we recommend returning to a rising trade if the instrument returns to an area above the moving average. The evening meeting of the British Parliament, by the way, may also affect the quotes of the main precious metal. If it turns out that the parliament supports the "tough" Brexit or any other "bad" option, this may cause a demand for safe-haven assets, as the pound sterling falls under the pressure of market participants. However, it should also be kept in mind that gold is influenced by a large number of factors, and not all of them are obvious, as is the case with many currency pairs. Therefore, the formation of a downtrend should also be prepared. Nearest support levels: S1 - 1312.50 S2 - 1304.69 S3 - 1296.88 Nearest resistance levels: R1 - 1320.31 R2 - 1328.13 Trading recommendations: Gold is currently being adjusted. Thus, it is recommended to wait for the completion of the correction and resume trading for a raise with targets at 1320.31 and 1328.13, if the price remains above the moving average. Sell orders will become actual small lots. However, before that, travers must overcome the moving average with the target at 1304.69. In addition to the technical picture, the fundamental data and the time of their release should also be taken into account. Explanations for illustrations: The senior linear regression channel refers to the blue lines of unidirectional movement. The younger linear regression channel refers to the purple lines of unidirectional movement. CCI - blue line in the indicator window. The moving average (20; smoothed)pertains to the blue line on the price chart. Murray levels - multi-colored horizontal stripes. Heiken Ashi is an indicator in blue or purple colored bars. The material has been provided by InstaForex Company - www.instaforex.com |
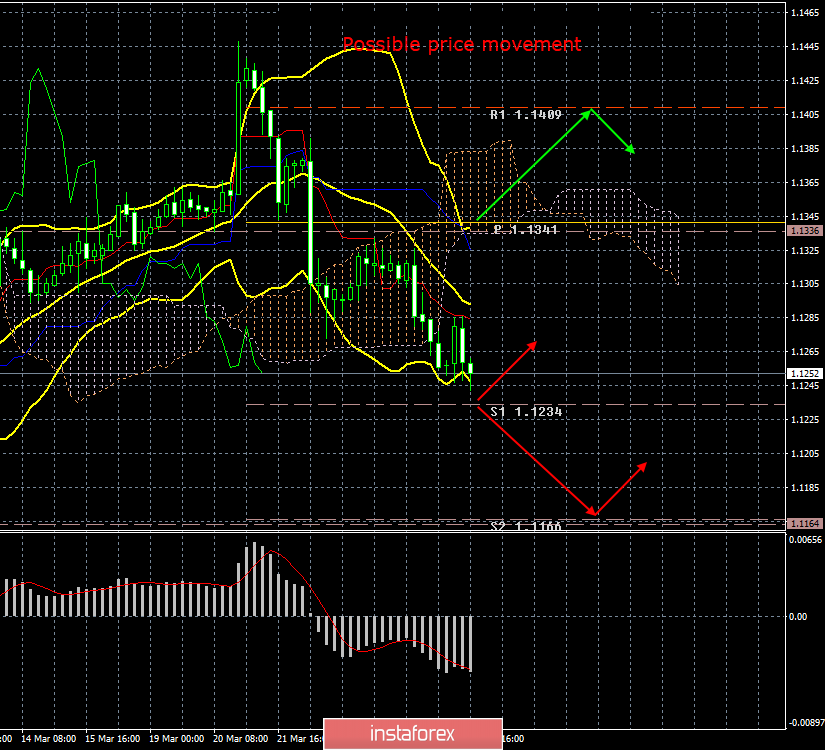
| EUR/USD. March 27. Results of the day. The pair will again test the support area of 1.1200 - 1.1270 Posted: 27 Mar 2019 04:16 PM PDT 4-hour timeframe The amplitude of the last 5 days (high-low): 112p - 95p - 118p - 43p - 63p. Average amplitude for the last 5 days: 86p (79p). The only event of the day that could attract the attention of traders of the EUR/USD pair was ECB Head Mario Draghi's speech in Frankfurt. No one hoped this speech will affect monetary policy and turn out "hawkish". At best, it could be neutral. But in practice, Draghi again spoke of the "persistent deterioration in external demand," "high uncertainty," "risks that have grown in recent months," and "maintaining the ECB's position at rates until at least the end of 2019". Question: which of the above could somehow support the euro currency? The euro slightly rose at the beginning of the European trading session, but after a few hours, it began a much more logical fall, based on Draghi's rhetoric. Today, we believe the European currency's decline was reasonable. However, in general, despite all of eurozone's problems, we continue to insist that the fundamental factors of the dollar and the euro have been levelled off recently. Now the US dollar's position does not appear unconditional. Thus, from our point of view, the pair retains good chances for starting the formation of an upward trend in the near future. However, of course, it is not worth wondering exactly when it will begin and whether it will start. It is better to wait for specific signals from the Ichimoku indicator or other technical indicators. Until then, there is a high probability that the euro will further fall. The pair, by the way, fell again to absolute lows over the past year and a half. Will it manage with its eighth attempt to overcome the area of 1,1200 - 1.1270? Trading recommendations: The EUR/USD pair continues to move down. Thus, now, short positions are still recommended for the target of a support level of 1,1234, and in case the first target has been overcome - for the target of 1,1166. However, it is not a fact that traders will be able to overcome the support area mentioned above. It is recommended to consider long positions only when the pair manages to consolidate back above the critical line, with a view to the resistance level of 1.1409. In addition to the technical picture should also take into account the fundamental data and the time of their release. Explanation of illustration: Ichimoku Indicator: Tenkan-sen – red line. Kijun-sen – blue line. Senkou span a – light brown dotted line. Senkou span B – light purple dotted line. Chikou span – green line. Bollinger Bands Indicator: 3 yellow lines. MACD: A red line and a histogram with white bars in the indicator window. The material has been provided by InstaForex Company - www.instaforex.com |
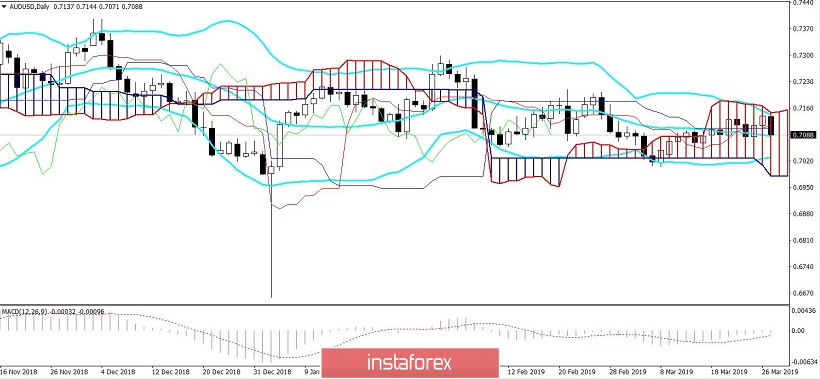
| AUD/USD: the aussie can repeat the kiwi's fate Posted: 27 Mar 2019 04:15 PM PDT After a two-day growth, the Australian dollar shows a downward trend today, returning to the bottom of the 70th figure. The extremely mild meeting of the Reserve Bank of New Zealand excited traders of the aussie, as the RBA may soon take a similar position. The likelihood that the RBNZ decreases interest rates has acquired real features, and according to some estimates, even an estimated timeframe. And although in recent years, the New Zealand regulator is more prone to "dovish" conclusions (compared to their counterparts from Australia), AUD/USD traders have something to think about, especially on the eve of the RBA meeting, which will be held next week - April 2. Despite the general trend among the central banks of the world to soften their rhetoric, traders of AUD/USD and NZD/USD were taken by surprise by such a straightforward statement from the New Zealand regulator. The members of the RBNZ stated that they had revised their previous estimates, since the dynamics of GDP growth did not correspond to their earlier forecasts. Also in the text of the accompanying statement, the regulator stressed that the interest rate will not be increased for "quite a long time" and will remain at 1.75% for at least two years, that is, until the end of 2020. The market braced for a wait-and-see position and reacted poorly to this fact. However, RBNZ Head Adrian Orr's speech knocked out the New Zealand currency, and in the knockdown - the aussie. He said that against the background of all possible options, the most likely direction of the rate's movement is down, due to weak global economic prospects and a significant slowdown in the dynamics of domestic spending. After these words, the "kiwi" fell by more than 150 points. The AUD/USD pair's decrease is less impulsive, although the downward dynamics is pronounced and has little or no chance of a pullback. The fact is that rumors about a possible easing of the monetary conditions of the RBA have been going on for several months. For example, at the end of February, one of the largest Australian banks in the "big four" banks in the country, Westpac, surprised traders by allowing a double rate cut by the Australian regulator before the end of this year. Prior to that, Philip Lowe voiced such a scenario, however, he allowed only one reduction, and even then, at the very least. But the situation seems to be unfolding in the worst case scenario - especially for the Australian economy, which is too dependent on Chinese indicators, which, in turn, continue to show negative dynamics. Against the background of complex and problematic trade negotiations between the United States and the People's Republic of China, today, Chinese industrial companies reported on the largest-scale decline in profits (for the first two months of the year) in the last 8 years. The main reason is a decrease in demand both in the domestic market and in the external one. Profit levels logically fell amid falling prices in the most important sectors of the industry: we are talking about the steel sector, oil refining, automotive and chemical. Such a sharp and, most importantly, a comprehensive decline in profits suggests that the dynamics of growth of Chinese GDP may be lower and thus, weak forecasts. Last year, China's economy expanded at its slowest rate in almost 30 years - and the People's Bank of China does not expect an improvement this year (the target for the current year was reduced to 6.5%). Naturally, the Chinese economy's recession will also affect the Australian economy. Recent data showed a disappointing result. Traders were alerted not only by the fact of a slowdown in the country's GDP (in the fourth quarter of last year), but also by the fact of a persistent downward trend of a key indicator. So, if Australia's GDP was at the level of 1.1% in the first quarter of 2018 (quarterly), in the second quarter it fell to 0.9%, in the third - to 0.3%, and finally, in the fourth - up to 0.2%. Similar dynamics is observed in the annual expression of the indicator: I quarter - 3.2%, II - 3.1%, III - 2.7% and IV - 2.3%. The latest release was not only worse than forecast, but it also set a certain anti-record: in quarterly terms, the indicator showed the weakest growth since the third quarter of 2016. It is noteworthy that these figures were published just a day after the March meeting of the RBA, whose members voiced optimistic notes. Now members of the Australian regulator will operate with more recent numbers that leave much to be desired. This indicates a high probability that the April meeting of the Australian central bank will take place along the same lines as the March meeting of the RBNZ. This probability will exert background pressure on the AUD/USD pair, however, it is unlikely for the bears to gain a foothold under the key mark of 0.70 (therefore, when approaching this target, long positions will look risky). But if Philip Lowe also allowed a rate cut, the aussie would not just pierce, but actually settle in the area of 0.68-0.69. The material has been provided by InstaForex Company - www.instaforex.com |
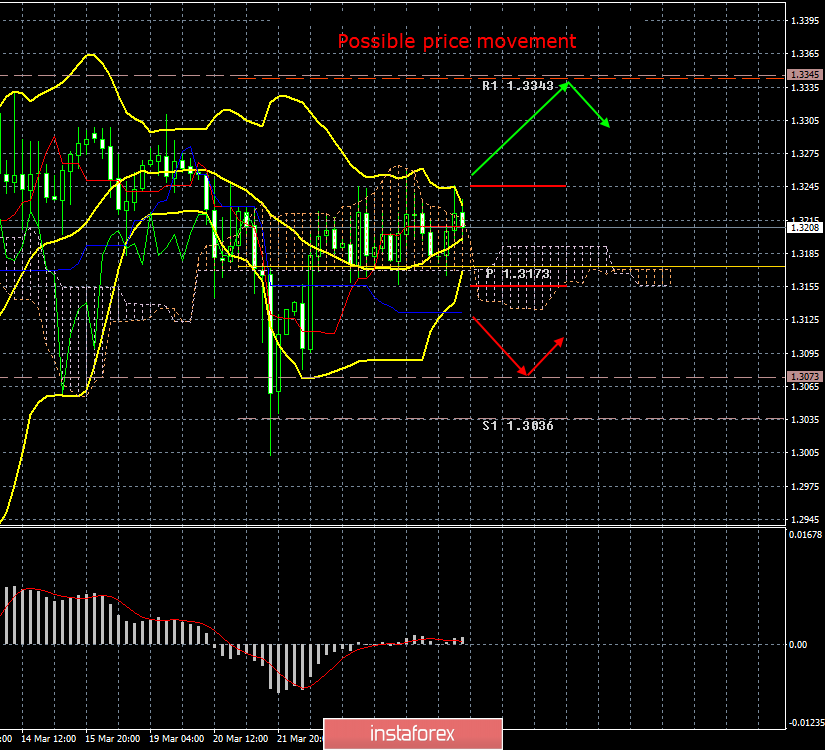
| Posted: 27 Mar 2019 04:08 PM PDT 4-hour timeframe The amplitude of the last 5 days (high-low): 126p - 223p - 143p - 86p - 104p. Average amplitude for the last 5 days: 136p (130p). There is only a few hours left until a whole series of votes in the British Parliament, and the British pound sterling has clearly been in hiding in recent days and is waiting for the results of these votes. Today, the head of the European Council, Donald Tusk, said publicly that the European Union should give the UK time to decide if it really wants to leave the EU, hinting at the petition of 6 million citizens of Great Britain who wish to cancel Brexit. However, London has already managed to reject this petition. Tusk said that London only has time until April 12 to draw up a "deal" with the EU, and until May 22 to leave the EU without any agreements. Otherwise, the UK will have to participate in elections to the European Parliament, and Brexit itself will have to be postponed to a much later date. However, it no longer matters, and the pound did not respond to this Tusk's speech. The main thing now is to find out which of the Brexit options does the majority of MP's support in order to figure out which strategy to follow in the near future. Meanwhile, Theresa May also publicly announced that she would resign only if Parliament supports her version of the Brexit agreement. May needs to save his political career, and the Parliament doesn't need Theresa May's option, even considering her resignation. Even if some MPs will "like" this option, the adoption of this proposal will indicate a form of betrayal to the whole country, since the Brexit variant that was rejected twice will be approved by the same Parliament. This is absurd. Trading recommendations: The GBP/USD currency pair is now in a difficult situation with the absence of any tendency substantiated by anything. The British Parliament's meeting in the evening could shed light on at least the country's immediate future and the fate of Brexit, but until this point, we do not recommend taking risks. In addition to the technical picture, one should also take into account the fundamental data and the time of their release. Explanation of the illustration: Ichimoku indicator: Tenkan-sen - the red line. Kijun-sen - the blue line. Senkou Span A - light brown dotted line. Senkou Span B - light purple dotted line. Chikou Span - green line. Bollinger Bands indicator: 3 yellow lines. MACD Indicator: Red line and histogram with white bars in the indicator window. The material has been provided by InstaForex Company - www.instaforex.com |
| Posted: 27 Mar 2019 08:11 AM PDT The New Zealand dollar fell against the US namesake to a maximum of more than two weeks after the Central Bank of the country announced at the end of the next meeting that the next change in the interest rate may be its decline. "Apparently, the RBNZ has joined the number of previously committed "pigeon" reversal of the Central banks. The reaction to this event of the currency market clearly shows that investors were taken by surprise," said Kay Van-Petersen, an economist from Singapore. "The pair NZD/USD can test the mark of 0.6737 in the next few sessions, and definitely within a month," he added. "The fall of the kiwi was a shock because of the announcement of future changes in monetary policy by the New Zealand Central Bank and had a downward pressure, in particular, on the Australian dollar," said Jason Wong, currency strategist at Bank of New Zealand (BNZ). The weak statistics on China also had a negative impact on the Australian dollar. According to the National Bureau of Statistics of China, in January-February, the profit of industrial enterprises of the country fell by 14% on an annualized basis. The reduction was the most significant since October 2011. China is the largest trade and economic partner of Australia and the buyer of its commodities. The slowdown in the growth of the Chinese economy and the decline in imports from the Green Continent to the PRC adversely affect the Australian currency. Next week, April 2, the next meeting of the Reserve Bank of Australia will be held. Most likely, the regulator will not change its monetary policy, but may soften the rhetoric by focusing on the possible reduction in interest rates. If the Central Bank will indeed follow such statements, then the Aussie could sharply fall in price, including against the US dollar. The material has been provided by InstaForex Company - www.instaforex.com |
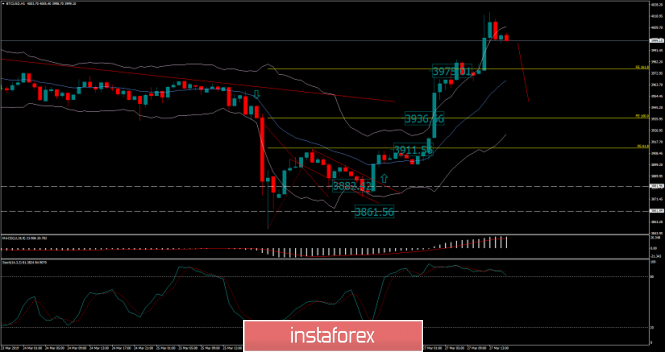
| Bitcoin analysis for March 27, 2019 Posted: 27 Mar 2019 07:59 AM PDT BTC has been trading upward as we expected. All our upward targets were met. Potential overbought condition incoming.
According to the H1 time – frame, we found that all 3 upward targets were met at $3.911, $3.936 and $3.975. Anyway, currently I see that there is 4-hour balance and bearish divergence on the Stochastic oscillator. We expect potential pullback in the next period. Support levels are seen at $3.967 and $3.951. Key resistance is seen at the price of $4.049. Trading recommendation: We exited from our Long position on BTC with 3 targets reached. We are neutral now on the BTC but there is a potential for downside and potential testing of $3.967 and $3.951. The material has been provided by InstaForex Company - www.instaforex.com |
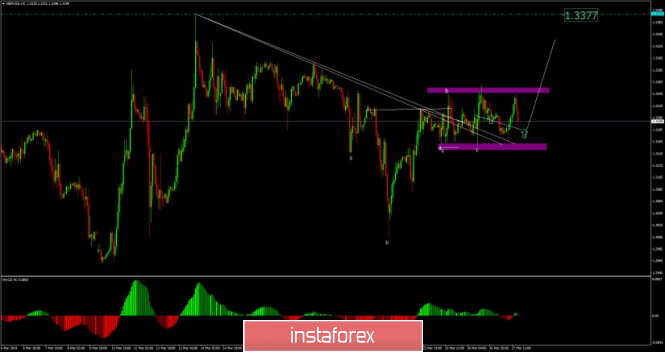
| GBP/USD analysis for March 27, 2019 Posted: 27 Mar 2019 07:49 AM PDT GBP/USD has been trading sideways at the price of 1.3200 but we expect the further upward movement and potential test of 1.3377
. Our analysis from yesterday is still valid. Gold price remains in a bullish short-term trend. The supply trendline has been broken and price remains above 1.3220. The last couple of sessions price mainly moves sideways between 1.3157 and 1.3260. This consolidation might be followed by a new bullish momentum towards 1.3377. There is also a confirmed inverted head and shoulders pattern, which is another sign of the potential strength. As long as the support at the price of 1.3155 we remain bullish. Trading recommendation: We are long GBP from 1.3225 and with target at 1.3377. Protective stop is placed at 1.3140. The material has been provided by InstaForex Company - www.instaforex.com |
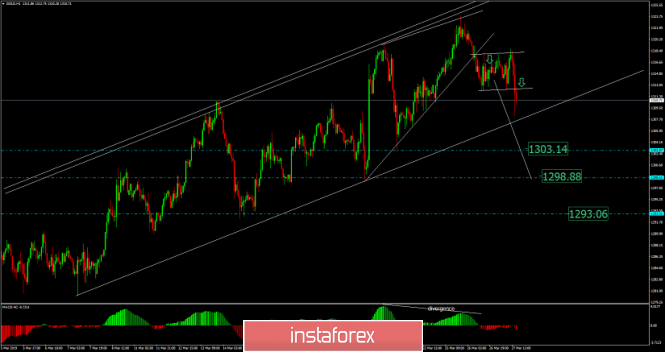
| Analysis of Gold for March 27, 2019 Posted: 27 Mar 2019 07:36 AM PDT Gold has been trading downwards as we expected. The price tested the level of $1.308.28. We are still bearish on the Gold.
According to the H1 time – frame, we found the breakout of the upward trendline and most recently there is the breakout of the bearish flag, which is good sign of the weakness. Bearish divergence is still present the this only adds more on the downside. Key resistance level is seen at the price of $1.322.30. Support levels are seen at $1.303.15, $1.298.90 and $1.293.00. Trading recommendation: We are still short on the Gold from $1.314.20 with targets at $1.303.15, $1.298.90 and $1.293.00. Protective stop is placed at $1.324.00. The material has been provided by InstaForex Company - www.instaforex.com |
| EURUSD: Why so much attention to the inversion of the yield curve? Posted: 27 Mar 2019 07:05 AM PDT The euro received some support and strengthened against the US dollar in the first half of the day after the speech of the European Central Bank President Mario Draghi, who again identified the risks associated with a slowdown in global economic growth and the eurozone as a whole. The ECB President noted that the slowdown in the economic growth of the eurozone does not necessarily foreshadow a serious decline, but the risks have increased in recent months, which leaves uncertainty at a rather high level. Let me remind you that the latest data on the euro area once again disappointed investors, signaling a weak economic growth rate at the beginning of this year. Draghi also said he expects a gradual return to growth in potential, but the current balance of risks is still shifted in a negative direction. In turn, the ECB is aware of future risks and is ready to respond in the event of further significant deterioration in prospects. The President of the ECB once again drew attention to the fact that he does not have a shortage of tools to carry out the tasks assigned to him. Given the lack of important fundamental statistics, an interview with Federal Reserve Bank President Dallas Robert Kaplan was published in the first half of the day, in which he stated that the Fed is too early to think about lowering rates. As noted in the morning forecast, traders and investors reacted positively to the quotations of futures on the Fed's rates, where the probability of their decline by the end of the year was estimated at 66% versus 72% at the end of last week. Kaplan also pointed out that weighty bases are required to lower interest rates. And although the current inversion of the yield curve is one of them, the difference in profitability should be more significant and long lasting. According to the representative of the Fed, to prove its constancy, the inversion of the yield curve should last for months, not weeks. Under the inversion of the yield curve is meant the case when the yield of long-term treasury bonds becomes lower than the yield of short-term ones. Let me remind you that at the moment the yield on 10-year Treasury bonds fell below the yield on three-month bonds, and this market has not seen since August 2007. Are these the first signs of an impending crisis? Closer to the afternoon, data on the US foreign trade deficit came out, which supported the US dollar and returned to the market the EURUSD pair sellers. According to the report, the deficit fell sharply in January this year due to a significant increase in exports, while imports fell. This day can be recorded in the "piggy bank" of Donald Trump, who for a long time led the war, then the negotiations on trade with China and is trying to straighten the balance as quickly as possible. According to the US Department of Commerce, the deficit of foreign trade in goods and services of the United States in January 2019 decreased by 15% compared with December and amounted to 51.15 billion dollars. Economists had forecast a deficit of $ 57 billion. As I noted above, exports in January rose immediately by 0.9% compared with December, to $ 207.34 billion, while imports fell by 2.6%, $ 258.49 billion. As for the technical picture of the EURUSD pair, it remained unchanged. As long as trading will be above support at 1.1250, the demand for euro will remain, but its breakdown will lead to a new wave of decline in risky assets, with the renewal of 1.1220 and 1.1170 lows. In the event of a persistent demand for the euro, sellers of risky assets will manifest themselves after the update of resistance 1.1290 and from a larger high of 1.1325. The material has been provided by InstaForex Company - www.instaforex.com |
| Posted: 27 Mar 2019 06:56 AM PDT To open long positions on the GBP / USD pair, you need: Pound buyers are gradually returning to the market, entrenched above resistance 1.3212. As long as trading continues above this range, the demand for the pound will continue, which leaves a possibility for a continuation of the upward correction to the highs of 1.3261 and 1.3316, where I recommend taking profits. In the case of a repeated decline of the pound under the level of 1.3212 on the news on Brexit, it is best to consider long positions on a rebound from the lows of 1.3162 and 1.3122. To open short positions on the GBP / USD pair, you need: The bears have missed the resistance level of 1.3212 and the main task for the second half of the day will be to return to this range. In this scenario, trading will continue on a wider side channel with an upper border of 1.3261 and a lower border of 1.3162. In the case of further growth of GBP/USD, it is best to consider short positions on a false breakdown from the resistance of 1.3261 or a rebound from the high of 1.3316. Important fundamental data on the UK economy is not expected today but the whole emphasis will be on the news about Brexit. More in the video forecast for March 27 Indicator signals: Moving averages Trade is conducted above the 30- and 50-medium moving averages, which indicates the bullish nature of the market. It is necessary to update new local maximums in order to sustain this trend. Bollinger bands The downward correction on the pound is limited by the lower limit of the Bollinger Bands indicator in the area of 1.3175. Description of indicators MA (moving average) 50 days - yellow MA (moving average) 30 days - green MACD: fast EMA 12, slow EMA 26, SMA 9 Bollinger Bands 20 The material has been provided by InstaForex Company - www.instaforex.com |
| Posted: 27 Mar 2019 06:47 AM PDT To open long positions on EUR / USD pair, you need: The euro has slightly strengthened its position against the US dollar in the first half of the day after the speech of the European Central Bank President Mario Draghi, who once again focused on the sufficiency of tools to support the growth of the eurozone economy. At the moment, buyers need to break through the resistance level of 1.1289, which was not possible in the first half of the day. Its breakthrough will lead to a further upward correction to the highs of 1.1324 and 1.1358, where I recommend taking profits. If in case the EUR/USD pair returned to the minimum area for the day to support 1.1251, it is best to consider long positions after the update 1.1224 or on the rebound from support 1.1198. To open short positions on EUR / USD pair, you need: Sellers coped with the task in the morning and did not allow the pair to rise above the resistance of 1.1289. The pressure on the euro will remain as long as the trade is conducted below this range but the main goal will be to break through and consolidate below support for 1.1251, which will lead to the formation of a new downward wave and update weekly lows in the 1.1224 and 1.1198 areas, where I recommend taking profits. If the growth scenario is higher than 1.1289 in the second half of the day, short positions in EUR/USD can only be considered for a rebound from resistances 1.1324 and 1.1358. More in the video forecast for March 27 Indicator signals: Moving averages Trade is conducted below the 30- and 50-medium moving, which indicates the preservation of the bearish nature of the market. Bollinger bands The break at the lower border of the Bollinger Bands indicator in the area of 1.1251 will lead to a new wave of sales of the European currency. On the other hand, a break at the upper border of the indicator in the area of 1.1289 will support the euro. Description of indicators MA (moving average) 50 days - yellow MA (moving average) 30 days - green MACD: fast EMA 12, slow EMA 26, SMA 9 Bollinger Bands 20 The material has been provided by InstaForex Company - www.instaforex.com |
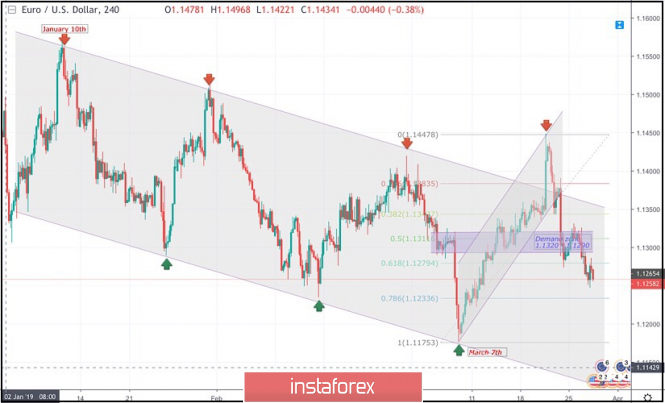
| March 27, 2019 : EUR/USD Intraday technical analysis and trade recommendations. Posted: 27 Mar 2019 06:40 AM PDT
On January 10th, the market initiated the depicted bearish channel around 1.1570. The bearish channel's upper limit managed to push price towards 1.1290 then 1.1235 before the EUR/USD pair could come again to meet the channel's upper limit around 1.1420. Shortly after, the recent bearish movement was demonstrated towards 1.1175 (channel's lower limit) where significant bullish recovery was demonstrated on March 7th. Bullish persistence above 1.1270 enhanced further bullish advancement towards 1.1290-1.1315 (the Highlighted-Zone) which failed to provide adequate bearish pressure. Last week, a bullish breakout attempt was executed above 1.1327 (the upper limit of the current demand zone). This enhanced further bullish movement towards 1.1450 demonstrating a false bullish breakout above the upper limit of the depicted movement channel. On the other hand, On Thursday, significant bearish pressure was demonstrated around 1.1380 leading to the current bearish decline towards 1.1260. The short term outlook for EURUSD pair remains bearish towards 1.1235, 1.1180 and .1140. Bearish persistence below 1.1280 is mandatory to pursue towards the next bearish targets. Otherwise, another bullish pullback would be demonstrated towards 1.1350 once more. Trade recommendations : Based on previous recommendations, for those who sold the EURUSD around 1.1385 should lower their SL to 1.1290 to secure some profits. RemainingTP levels to be located around 1.1235 and 1.1180. The material has been provided by InstaForex Company - www.instaforex.com |
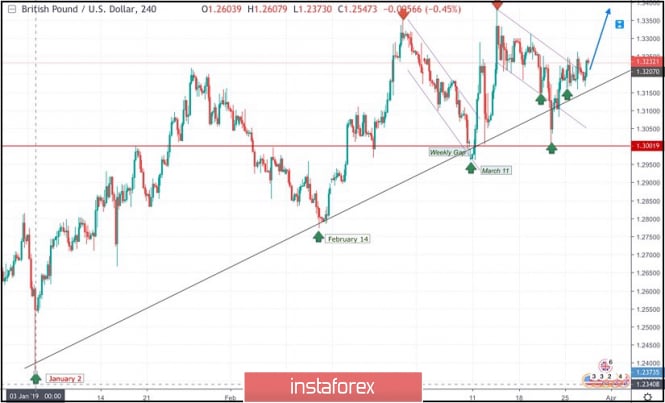
| March 27, 2019 : GBP/USD demonstrating a bullish flag pattern for Intraday traders. Posted: 27 Mar 2019 06:23 AM PDT
On January 2nd, the market initiated the depicted uptrend line around 1.2380. This uptrend line managed to push price towards 1.3200 before the GBP/USD pair came to meet the uptrend again around 1.2775 on February 14. Another bullish wave was demonstrated towards 1.3350 before the bearish pullback brought the pair towards the uptrend again on March 11. A weekly bearish gap pushed the pair slightly below the trend line (almost reaching 1.2960) before the bullish breakout above short-term bearish channel was achieved on March 11. Bullish persistence above 1.3060 allowed the GBPUSD pair to pursue the bullish momentum towards 1.3130, 1.3200 then 1.3360 where the recent bearish pullback was initiated. Bullish persistence above 1.3250 was needed for confirmation of a bullish Flag pattern. However, significant bearish pressure was demonstrated below 1.3250. Hence, the short term outlook turned to become bearish towards 1.3120 - 1.3100 where the depicted uptrend line failed to provide any immediate bullish support. Bearish breakout below 1.3100 allowed quick bearish decline towards 1.3000 where the current bullish momentum that brought the pair back above 1.3200 was initiated (False bearish breakout). Today, The price level around 1.3250 stands as an Intraday resistance/supply level that needs to be broken to the upside for confirmation of the depicted flag pattern bullish breakout. On the other hand, bearish rejection around 1.3250 may initiate bearish decline towards 1.3180 then 1.3100 thus remainin within the current consoliation range. Trade Recommendations: Intraday traders should wait for a bullish breakout above (1.3250) on H1 chart. Bullish projection levels to be located around 1.3320 then 1.3400. SL to be placed above 1.3180. The material has been provided by InstaForex Company - www.instaforex.com |
| Posted: 27 Mar 2019 04:24 AM PDT Wave counting analysis: On March 26, the GBP/USD pair rose by 15 bp, not particularly pleasing with its activity in recent days. It seems that the markets lurked in anticipation of several parliamentary votes at once that should determine which version of Brexit do most parliamentarians support. Thus, I assume that today the activity of the tool until the evening will remain low. Based on the current wave pattern, we can assume the completion of the construction of wave 2 of a new downtrend trend. However, the evening parliamentary votes may lead to an unpredictable market reaction and the current wave counting may require adjustments and additions. Purchase targets: 1.3350 - 100.0% Fibonacci 1.3454 - 127.2% Fibonacci Sales targets: 1.2961 - 0.0% Fibonacci General conclusions and trading recommendations: The wave pattern allows for the construction of an upward wave with targets located near the estimated level of 1.3454, however, I recommend returning to this option only in case of a successful attempt to break through the level of 100.0%. A more likely development of events in the present is the construction of a descending wave with targets that are below 29 figures. However, both purchases and sales of the pair today are extremely risky since no one knows how to conclude the voting in the UK Parliament. The material has been provided by InstaForex Company - www.instaforex.com |
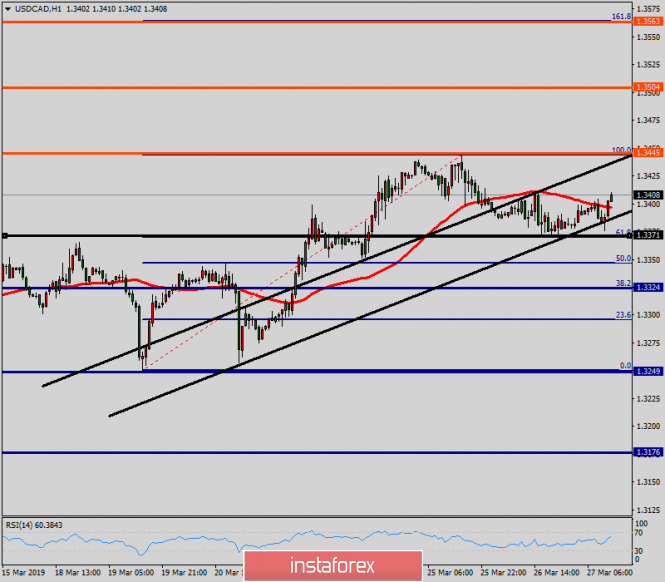
| Technical analysis of USD/CAD for March 27, 2019 Posted: 27 Mar 2019 04:23 AM PDT The USD/CAD pair continues to move upwards from the level of 1.3371. Yesterday, the pair rose from the level of 1.3371 (the level of 1.3371 coincides with a ratio of 38.2% Fibonacci retracement) to a top around 1.3401. Today, the first support level is seen at 1.3371 followed by 1.3322, while daily resistance 1 is seen at 1.3445. According to the previous events, the USD/CAD pair is still moving between the levels of 1.3371 and 1.3445; for that we expect a range of 74 pips (1.3445 - 1.3371). On the one-hour chart, immediate resistance is seen at 1.3445, which coincides withthe double top. Currently, the price is moving in a bullish channel. This is confirmed by the RSI indicator signaling that we are still in a bullish trending market. The price is still above the moving average (100), Therefore, if the trend is able to break out through the first resistance level of 1.3445, we should see the pair climbing towards the daily resistance at 1.3504 to test it. It would also be wise to consider where to place stop loss; this should be set below the second support of 1.3322. The material has been provided by InstaForex Company - www.instaforex.com |
| Posted: 27 Mar 2019 04:04 AM PDT Wave counting analysis: On Tuesday, March 26, trading for EUR/USD pair ended by 40 bp and a successful attempt to break through the level of 61.8%. Thus, the estimated wave b takes a more complex form and in the long term, the entire downward trend section may become more complicated given the entire wave picture of recent months, which will lead to a rationale for a further decline in the euro. The most interesting thing is that the negative news background is not the reason for the decline in the euro, since there was no important news on Monday and Tuesday. Given the fact that the Fed abandoned the rate hike, it would be more logical to see the construction of the rising wave. Sales targets: 1.1280 - 61.8% Fibonacci (small grid) 1.1240 - 76.4% Fibonacci (small grid) Purchase targets: 1.1448 - 0.0% Fibonacci General conclusions and trading recommendations: The pair resumed building the wave b. Now, I recommend not to trade a pair but to expect a new signal to complete the current downward wave. For example, an unsuccessful attempt to break through the level of 76.4% Fibonacci. At the same time, the breakthrough of the minimum of the supposed wave 5 will unequivocally indicate the complication of the entire downward trend section, which originated on January 10. The material has been provided by InstaForex Company - www.instaforex.com |
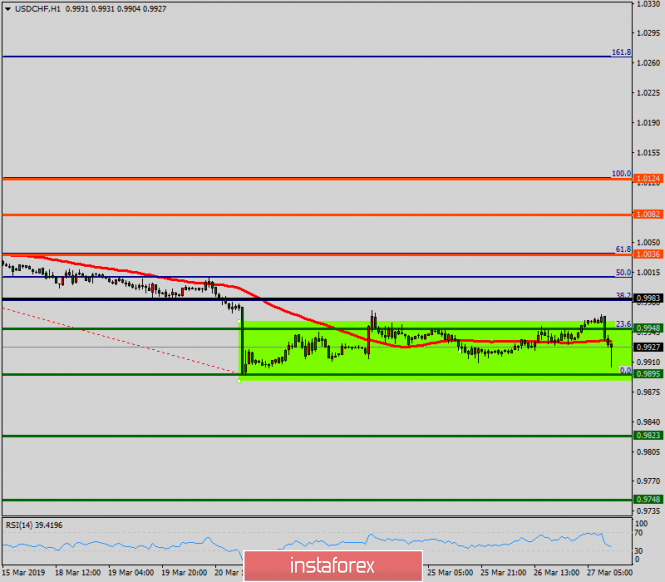
| Technical analysis of USD/CHF for March 27, 2019 Posted: 27 Mar 2019 03:48 AM PDT The USD/CHF pair continues moving in a bullish trend from the support levels of 0.9895 and 0.9948. Currently, the price is in an upward channel. This is confirmed by the RSI indicator signaling that the pair is still in a bullish trend. As the price is still above the moving average (100), immediate support is seen at 0.9948 coinciding with a golden ratio (23.6% of Fibonacci). Consequently, the first support is set at the level of 0.9948. So, the market is likely to show signs of a bullish trend around 0.9948. In other words, buy orders are recommended above the golden ratio (0.9948) with the first target at the level of 0.9983. Furthermore, if the trend is able to breakout through the first resistance level of 0.9983, we should see the pair climbing towards the double top (1.0036) to test it. It would also be wise to consider where to place a stop loss; this should be set below the second support of 0.9895. The material has been provided by InstaForex Company - www.instaforex.com |
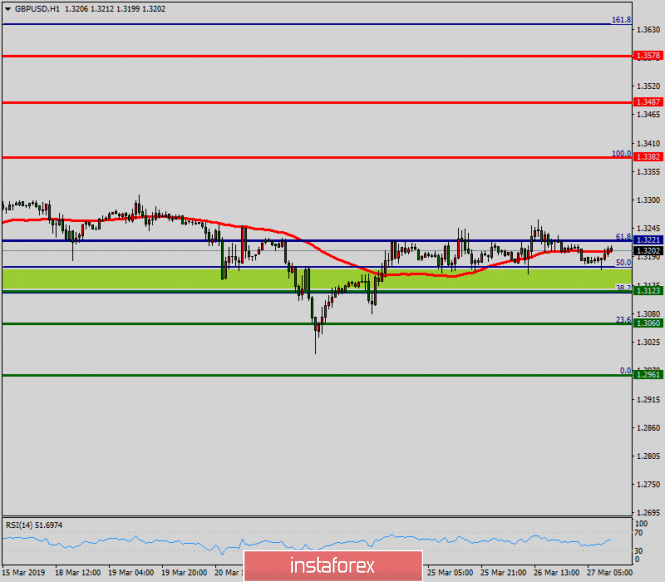
| Technical analysis of GBP/USD for March 27, 2019 Posted: 27 Mar 2019 03:43 AM PDT The GBP/USD broken resistance at 1.3221 which acts as support this this week. The pair is moving between the levels of 1.3221 and 1.3382. As the trend is still above the 100 EMA, a bullish outlook remains the same as long as the 100 EMA is headed to the upside. Consequently, the level of 1.3221 remains a key resistance zone. Therefore, there is a possibility that the GBP/USD pair will move upwards above 1.3221, which coincides with a ratio 61.8% of Fibonacci retracement. The falling structure does not look corrective. In order to indicate a bearish opportunity above 1.3221, buy above this level with the first target at 1.3382. Moreover, if the pair succeeds to pass through 1.3382, it will move upwards continuing the bullish trend development to 1.3487 in order to test the daily resistance 2. On the other hand, if a breakout happens at 1.3123, this scenario may be invalidated. The material has been provided by InstaForex Company - www.instaforex.com |
| Central Bank waiting for the beginning of the crisis Posted: 27 Mar 2019 02:56 AM PDT The decision of the RBNZ was unexpected and logical. Earlier, the currencies of the Pacific region, particularly the Australian and New Zealand dollars received support in the wake of the steady growth of the Chinese economy and the world as a whole. Last year, their positions were somewhat shaken on the wave of the commencement of trade wars inspired by Washington around the world. This was most clearly manifested in the conflict with China, the real and most powerful competitor of the United States. On this wave, he was the first to show signs of economic decline, which naturally hit exports to the PRC from Australia and New Zealand. The situation continued to remain generally positive for these countries but when it became clear that the process of slowing general global economic growth in particular Chinese, European and already American began to manifest itself with persistent consistency. First the Fed then the ECB signaled the problems and made it clear that one should not expect a tightening of monetary policies. Of course, the RBNZ could not fail to respond in this case, which was shown at the end of today's meeting by the decision not only to leave the key interest rate at the level of 1.75%. In the wake of this message, the rate of the New Zealand currency went down sharply and falls exactly on one figure in tandem with the US dollar at the time of writing this article. The RBNZ decision also exerted widespread pressure on the Australian dollar, which fell by 40 points and the reaction of market players is understandable. They expect that the RBA will not stand aside and may come to the conclusion that it is necessary to lower rates in this situation. Such a reaction of the Central Bank can be explained by the desire to get ahead of the possible process of starting to lower the Fed rates and a new round of ECB stimulus measures, which will make the New Zealand and Australian dollars attractive high and hit the export of these countries in the world market accordingly. Evaluating the emerging picture, we note that the signal from the RBNZ is significant and indicates a change in sentiment in the Central Bank of economically developed countries. In turn, it demonstrates a rise in expectations among regulators, if not a new wave of crisis in the near future, then eventually transformed into a crisis. Forecast of the day: The EUR/USD pair is holding above 1.1250. We consider it possible to sell it with a target level of 1.1215 and then 1.1175 after a decline below this mark. The AUD/USD pair remains in the short-term downtrend in the wake of fears of a continued decline in the growth of the global economy and as a result, there is a demand for commodity and commodity assets. We consider it possible to sell the pair with targets at 0.7065 and 0.7000 after its decline below the level of 0.7100. |
| Posted: 27 Mar 2019 02:19 AM PDT
The dollar continues to strengthen against the euro and such defensive currencies like the yen, as traders ignored the weaker-than-expected US statistics released a day earlier. The US dollar index today is trading near 97. The worst currency of yesterday was the euro. The pair EUR/USD slipped below 1.13, and then went to 1.1250. It is noteworthy that the weakening of the single European currency occurred in the absence of important statistics for the Eurozone, as well as against the background of the recovery of the yield of German state bonds. At the same time, the technical picture has slightly changed, and the main question now is whether the EUR/USD pair will once again break down the established range of 1.120-1.125, or, relying on the support of the Federal Reserve and the belief that the economic situation in the eurozone will not become worse, will try to develop an upward correction in the direction of the goal of 1.18? Meanwhile, the USD/JPY pair continues to recover, but the market still does not have enough energy to raise the dollar above 111 yen, since the yield of US Treasury securities remains under pressure. It is possible that if the rally continues at level 111, merchants may come into play. Today, a report on the US trade balance will be published. Last month, the negative balance reached a record high. Given that yesterday's releases could not hurt the dollar, you should not expect this from the trade data. It is assumed that in the short term, USD/JPY will be in the range close to the current one. As for the British currency, it holds its position against the dollar in anticipation of "exemplary" Brexit vote in the British parliament. Today, the deputies of the House of Commons will meet to discuss whether to abandon Brexit at all, or to hold a second referendum in the country, or agree to break with the European Union without concluding any preliminary agreements. According to experts, the GBP/USD pair seems to have stopped responding to its fundamental background altogether and is waiting for an answer to the question: will the United Kingdom leave the EU or not? "Holding early parliamentary elections and the "tough" Brexit could be "surprises" for the pound in the near term. In this case, one should expect increased volatility from the British currency," said MUFG analysts. |
| Overview of the foreign exchange market on 03/27/2019 Posted: 27 Mar 2019 02:10 AM PDT The closeness of the result of confusing history with Brexit makes everyone very nervous. So much that when it is necessary to keep silent, the people's deputies of Her Majesty's subjects cannot keep their mouths shut. . Yesterday, when it was really worth settling down and thinking about everything, and most importantly, not to frighten the market participants with their thoughts about the problem of the expansion of the universe, few supporters of Theresa May said they would support the Prime Minister's plan. That is, they will insist on the adoption of the agreement, which imposes the Fourth Reich. It does not matter that the House of Commons has rejected this agreement twice, since there is not a single word about trade and the economy. Moreover, many parliamentarians rightly consider her a threat to the territorial integrity of the United Kingdom. It is clear that on this background, the pound began to grow steadily, but no one else wanted to develop this topic , and did not support the initiatives of the ardent adherents of the "Iron Lady - 2". Apparently, most parliamentarians are smart enough to keep silent when it is needed. Therefore, the pound failed to build on its success. Moreover, the pound quickly began to decline following the single European currency, and the reason lies in the miraculous metamorphoses of American statistics. But the fact is that many investors were seriously frightened by the forecasts for the construction of new houses, the volume of which should have fallen by as much as 28.3%. That is more than a quarter. However, the actual data showed that everything is not so terrible, since the volume of construction decreased "only" by some 8.7%. So there is nothing to fear, and you can safely buy the dollar - the currency of a country that has already "become great again." On the other hand, investors exhaled and boldly began buying up portraits of the dead presidents of the United States. Today, the macroeconomic calendar is completely empty, so nothing will prevent us from enjoying the battles that will soon begin to unfold in the House of Commons. The intrigue also lies in the fact that no one has any idea what exactly they will consider there today. One gets the feeling that even the people's representatives of Her Majesty's subjects are not particularly up to date. The Cabinet, headed by Theresa May, who was elegantly pushed towards by the House of Commons, has already managed to state that any decision made by parliamentarians is not binding, and the government will not support the decision to abolish Brexit. Unless, of course, the House of Commons decides to make such a decision. So what options can parliamentarians consider today? Options one is better than the other. The House of Commons, of course, can accept the proposed "divorce agreement", and this is the best case scenario at least for the pound and the single European currency, since only in this case, they will be able to find the strength to grow. All other options promise a steady increase in the cost of portraits of dead American presidents. Parliamentarians can reject the agreement, and then the UK can quickly begin to pack their bags, since on April 12, they will need to withdraw from the European Union without the "foreplay" in the form of a transitional period. There is the option of a second referendum, but then, if her Majesty's subjects vote again to leave the European Union, Brexit is postponed indefinitely. Although, only if the European Union agrees with such a statement of this question. Well, there is another option of abandoning Brexit, which is equivalent to political suicide to all those who vote for such a decision. As you can see, the options are just great. Well, the most interesting thing is that it is simply impossible to predict what will happen in the House of Commons. It is better to act on the results. If the House of Commons nevertheless accepts the divorce agreement from the third time, the single European currency can rise to 1.1300. For any other outcomes, the single European currency is waiting for a decline to 1.1225. The pound will be able to grow to 1.3250 only if the agreement is accepted. With all the other outcomes of battles in the House of Commons, we will have to go down to 1.3075. |
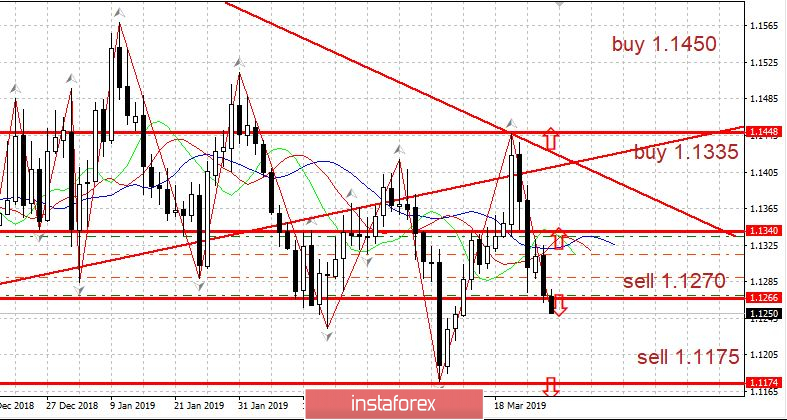
| Posted: 27 Mar 2019 01:15 AM PDT On Wednesday and Thursday, the British Parliament appointed key voting options for Brexit - control over the process is now in the hands of Parliament - and we need to determine the option that has a chance to acquire a majority. The options are very different ranging from - withdrawing from the EU without an agreement - through a new agreement with the EU in the form of preserving full trading conditions according to EU rules - and to the complete abolition of Brexit and even a new referendum. The pound and the euro, of course, are waiting for decisions. EURUSD: There is a slight downward movement, we sell from 1.1270. However, the downward trend will begin with a break downwards at 1.1175. Alternative: Buy from 1.1335 and a trend above 1.1450. |
| Trading recommendations for the GBPUSD currency pair - placement of trading orders (March 27) Posted: 27 Mar 2019 01:08 AM PDT Over the past trading day, the currency pair British pound/ US dollar showed volatility just below the daily average of 103 points, as a result of continuing the fluctuation in a given framework. From the point of view of technical analysis, we see that the quotation has clamped itself within the framework of 1.3170 / 1.3220, consistently working out the boundaries. As discussed earlier, the background information in the storm of passion Brexit. Prime Minister Theresa May was literally suspended from the Brexit deal. At the same time, the Cabinet said that the government would not withdraw article 50. Thus, we will respect the results of the 2016 referendum and will work with the parliament to approve the deal that will ensure our withdrawal from the European Union. Today, the primary event is the election in the British Parliament, where it is literally incomprehensible what will be the voting be about: adoption of an agreement; Brexit cancellation; exit without a transaction; or a new referendum. At the same time, the head of government, Theresa May, will speak at a meeting today by 20:00 Moscow time in the so-called "Committee of 1922", which unites ordinary members of the Conservative Party, where she may call her date of resignation. Further development Analyzing the current trading chart, we see that the quote continues to move within 1.3170 / 1.3220. It is likely to assume a temporary preservation of the current amplitude oscillation, but until the news about Brexit flies out. After that, we will wait for impulse moves. Traders, in turn, occupy waiting positions and focusing their attention on the breakdown of the boundaries of the 1.3170 / 1.3220 cluster. Based on the available data, it is possible to decompose a number of variations. Let's consider them: - Positions for the purchase of traders are considered in the case of a clear price fix higher than 1.3250 (not a puncture). - Positions for the selling of traders are considered in the case of a clear price fix lower than 1.3170 (not a puncture). At the same time, we should listen to the information background, which clearly tells the direction of the speculators. Indicator Analysis Analyzing the different sectors of timeframes (TF), we see that there is a downward interest against the background of convergence with the lower boundary of the cluster in the short and intraday perspective. On the other hand, the medium-term perspective has changed interest from ascending to neutral. It should be understood that the price is within the cluster, and intraday indicators on smaller TFs can vary arbitrarily. Weekly volatility / Measurement of volatility: Month; Quarter; Year Measurement of volatility reflects the average daily fluctuation, with the calculation for the Month / Quarter / Year. (March 27 was based on the time of publication of the article) The current time volatility is 48 points. The volatility of the day will directly depend on the information background. Thereby, monitoring media sources is necessary, since the volatility can be high. Key levels Zones of resistance: 1.3220 *; 1,3300 **; 1.3440; 1.3580 *; 1.3700 Support areas: 1.3000 ** (1.3000 / 1.3050); 1.2920 *; 1.2770 (1.2720 / 1.2770) **; 1.2620; 1.2500 *; 1.2350 **. * Periodic level ** Range Level The material has been provided by InstaForex Company - www.instaforex.com |


| You are subscribed to email updates from Forex analysis review. To stop receiving these emails, you may unsubscribe now. | Email delivery powered by Google |
| Google, 1600 Amphitheatre Parkway, Mountain View, CA 94043, United States | |
No comments:
Post a Comment