
Forex analysis review |
- NZD/USD approaching support, potential bounce!
- USD/CAD approaching resistance, potential drop!
- USD/CHF approaching resistance, potential drop!
- When does the pound lose its patience?
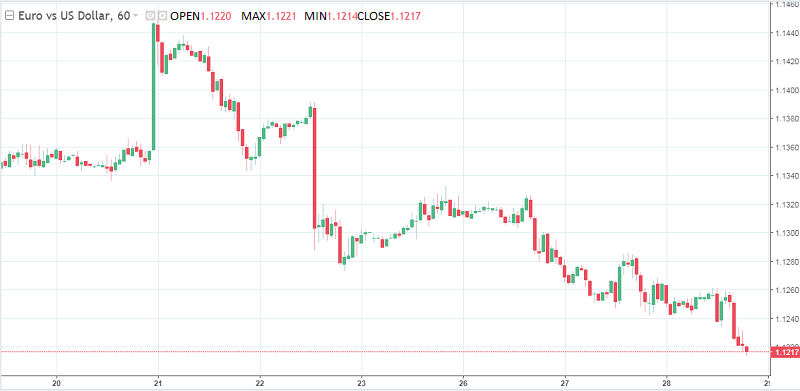
- EUR/USD. March 28. Results of the day. The euro currency fell again, weak US GDP even failed to save it
- EUR/USD: weak inflation in Germany and weak GDP growth in the US
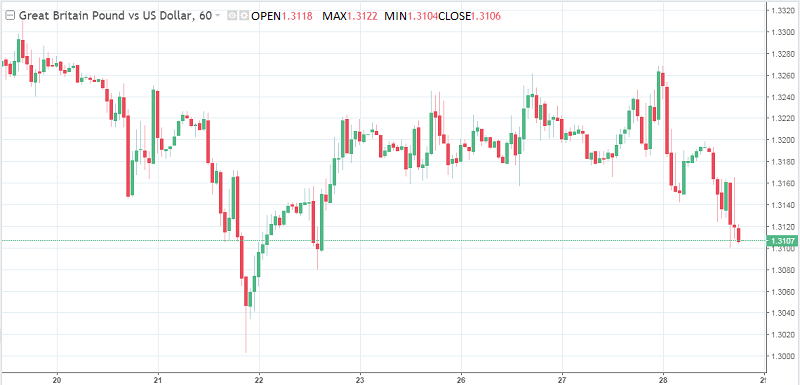
- GBP/USD. March 28. Results of the day. The pound sterling endured for a long time, but it eventually collapsed
- Bitcoin analysis for March 28, 2019
- March 28, 2019 : EUR/USD Intraday technical analysis and trade recommendations.
- EUR./USD analysis for March 28, 2019
- Analysis of Gold for March 28, 2019
- GBP / USD. March 28. Results of the month. Brexit: complete uncertainty.The pound is at a loss
- Elliott wave analysis of GBP/JPY for March 28, 2019
- EUR/USD. March 28. Results of the month. Euro – dollar: the situation is leveled
- March 28, 2019 : GBP/USD Intraday technical analysis and trade recommendations.
- Elliott wave analysis of EUR/JPY for March 28, 2019
- EURUSD: Insufficient inflation in Germany returns pressure on the euro
- The dollar keeps afloat due to the fact that it remains the best of the worst, TD bank says
- GBP / USD plan for the American session on March 28. Pound declines amid uncertainty about Brexit
- EUR / USD plan for the US session on March 28. Weak German inflation data upset euro buyers
- Trading recommendations for the EUR / USD pair - placement of trading orders on March 28
- Technical analysis of NZD/USD for March 28, 2019
- Technical analysis of EUR/USD for March 28, 2019
- US refinery does not expect a decline by the end of the year, despite the drop in prices
- Technical analysis of AUD/USD for March 28, 2019
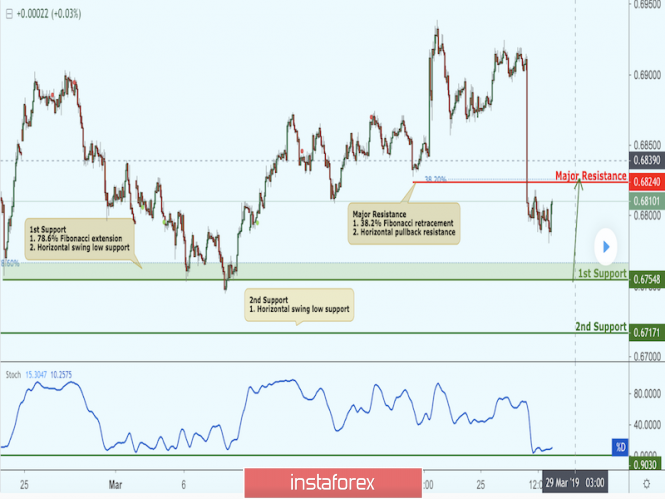
| NZD/USD approaching support, potential bounce! Posted: 28 Mar 2019 06:45 PM PDT NZDUSD is approaching our first support at 0.6754 (horizontal swing low support, 78.6% fibonacci retracement ) where a strong bounce might occur above this level pushing price up to our major resistance at 0.6826 (horizontal pullback resistance, 38.2% fibonacci retracement ). Stochastic is approaching support as well. Trading CFDs on margin carries high risk. Losses can exceed the initial investment so please ensure you fully understand the risks.
|
| USD/CAD approaching resistance, potential drop! Posted: 28 Mar 2019 06:43 PM PDT USDCAD is approaching our first resistance at 1.3471 (horizontal swing high resistance, 61.8% Fibonacci extension ) where a strong drop might occur below this level pushing price down to our major support at 1.3362 (horizontal overlap support, 50% Fibonacci retracement , 100% Fibonacci extension ). Stochastic (89,5,3) is also approaching resistance where we might see a corresponding drop in price. Trading CFDs on margin carries high risk. Losses can exceed the initial investment so please ensure you fully understand the risks.
|
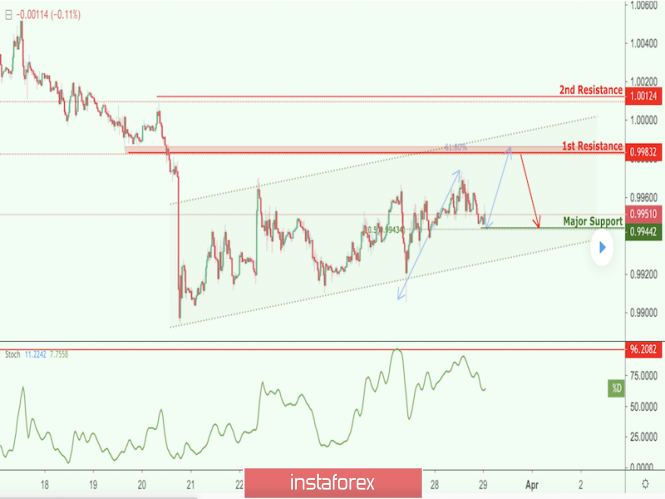
| USD/CHF approaching resistance, potential drop! Posted: 28 Mar 2019 06:37 PM PDT USDCHF is approaching our first resistance at 0.9983 (horizontal pullback resistance, ascending channel's resistance, 61.8% Fibonacci extension , 38.2% Fibonacci retracement ) where we might see a drop to our major support at 0.9944 (horizontal swing low support, 50% Fibonacci retracement ). Stochastic (89,5,3) is also approaching resistance. Trading CFDs on margin carries high risk. Losses can exceed the initial investment so please ensure you fully understand the risks.
|
| When does the pound lose its patience? Posted: 28 Mar 2019 03:42 PM PDT The situation with Brexit did not become clearer. The UK Parliament has not approved any of the 8 scenarios of the country's separation from the EU. The heavy artillery in the form of Theresa May's statement did not help either, if her version of the deal was approved. It is worth noting that at present, May's proposal is receiving more and more support from significant people of the Tory party. Politicians fear that in the end, this lack of clarity and order will lead to the rejection of Brexit. Additional votes are expected on Thursday. Markets hope that the situation will become more clear before the weekend. However, ideas with a long delay may not bring bonuses to the sterling. Nevertheless, the pound behaves with dignity amid the continuation of this drama. The range of changes in its value against the dollar since early March is in the region of $1.30-1.33. What happens to the euro? The euro is in distress, and the yield of German government bonds fell below its Japanese counterparts for the first time in three years. The euro currency owes its current downward movement to Mario Draghi. On Wednesday, he pointed out the downside risks to the regional economy and announced the regulator's readiness to deal with side effects of negative rates. Draghi seems to have hinted at the normalization of politics, but in fact you need to understand that rates will remain low for a long time, and the ECB will smooth out the losses of the banking system with the help of LTRO or other instruments. Such news cannot please the euro. The erozone follows the path of Japan, that is, it is ready to face a further slowdown in consumer prices, and it can also use the yield curve control mechanism, like the Japanese central bank. Alternatively, a variant with differentiated rates for banks is possible, allowing these financial organizations not to pay for the funds placed in the central bank. Therefore, the prospects for a rapid tightening of monetary policy should be forgotten. This makes the euro vulnerable, while the dollar rejoices at the good news from foreign trade. Its negative balance has not only gone from 10-year-old peaks, but also became better than Bloomberg's expectations - $51.15 billion compared to $57 billion. The decline in imports may indicate the effectiveness of Donald Trump's protectionist policies. However, it may signal a slowdown in domestic demand and the US economy as a whole. For the EURUSD, reducing the US trade deficit and trimming the trade surplus of Germany and the eurozone is a negative factor. At the same time, exchange rates are determined by capital flows of a more investment nature. If last year there was a jump in the repatriation of capital to US companies (up to $664.9 billion from $155.1 billion), then this year this factor is unlikely to support the "greenback". Dollar "bears" put on a disappointing report on US GDP for the fourth quarter. If the second estimate is lower than expected 2.4% q/q, euro fans will want to return above $ 1.13. |
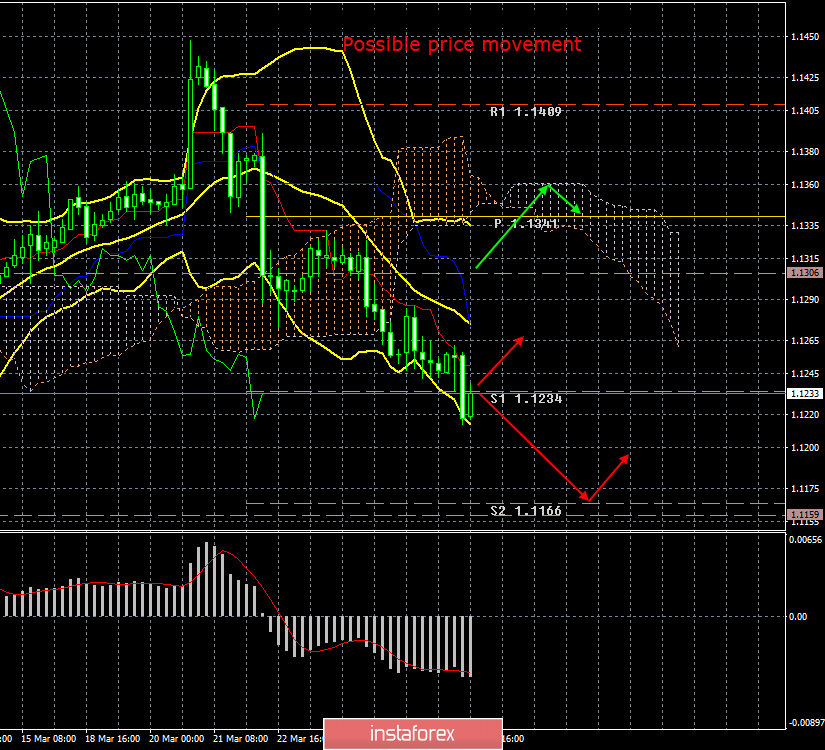
| Posted: 28 Mar 2019 03:42 PM PDT 4-hour timeframe The amplitude of the last 5 days (high-low): 95p - 118p - 43p - 63p - 44p. Average amplitude for the last 5 days: 73p (86p). On Thursday, March 28, the European currency again fell against the US dollar and came close to the lower boundary of an important support area of 1.1200 -1.270. Even a weak report on US GDP for the fourth quarter failed to save the euro. It was expected that GDP would be 2.4% y/y, but in reality the figure was only 2.2%. However, contrary to common sense and logic, the euro continued to fall. This can only mean one thing - traders have made a choice between the dollar and the euro in the medium term. Only one thing can save the euro currency now - powerful and large pending orders to buy at around 1.1200. If they do not help, the euro can overcome an important area of support and thus provoke an even stronger fall. Despite the fact that from a fundamental point of view for the euro currency, the situation slightly became better after the Fed refused to further unload its balance sheet and raise rates, it seems that this was not enough to convince traders to buy euros. Unfortunately for Donald Trump, the dollar may continue to strengthen. Therefore, market participants are encouraged to continue to follow the trend, that is, to sell the pair, especially since all technical indicators currently clearly indicate a downward movement. On the last trading day of the week, the pair could begin to adjust, which would be logical due to the desire of traders to take profits. Trading recommendations: The EUR/USD pair continues to move down and it overcame the support level of 1.1234. Therefore, short positions are currently recommended with a target of 1,1166. There are still doubts about the ability of overcoming the area around the level of 1.1200. In addition to the technical picture should also take into account the fundamental data and the time of their release. Explanation of illustration: Ichimoku Indicator: Tenkan-sen – red line. Kijun-sen – blue line. Senkou span a – light brown dotted line. Senkou span B – light purple dotted line. Chikou span – green line. Bollinger Bands Indicator: 3 yellow lines. MACD: A red line and a histogram with white bars in the indicator window. The material has been provided by InstaForex Company - www.instaforex.com |
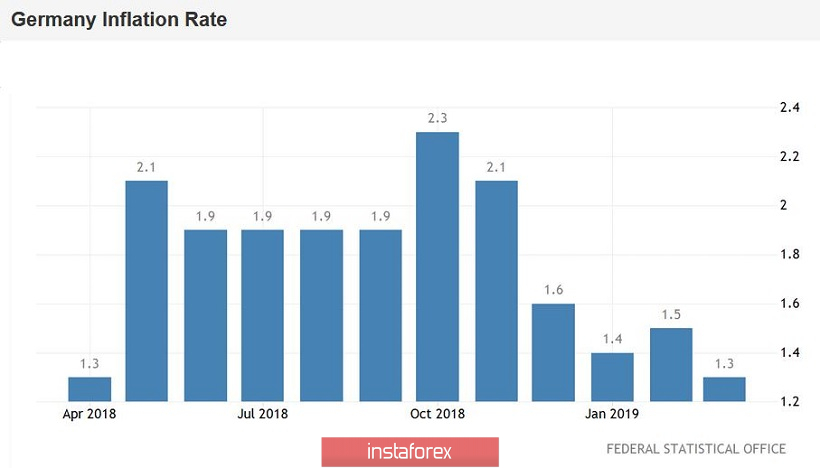
| EUR/USD: weak inflation in Germany and weak GDP growth in the US Posted: 28 Mar 2019 03:42 PM PDT Today, the euro-dollar pair came close to the support level, which is located on the bottom line of the Bollinger Bands indicator on the daily chart (and corresponds to the mark of 1.1205). But the eur/usd bears could not decide on the breakdown of this level, especially after the release of data on the growth of the US economy. Therefore, despite a rather strong downward pullback, the downward impulse did not receive its confirmation - for this, sellers need to gain a foothold in the area of the 11th figure. The catalyst for the European currency's decline was the release of the growth of German inflation. Last month, the consumer price index in Germany (in annual terms) showed a positive trend (+1.5%) after a strong decline in January. However, in March, the rate slowed again, at around 1.3%. This fact has disappointed investors, since German inflation makes a significant contribution to European growth. This is not the first disappointing report from Germany lately. Last week it became known that the German manufacturing activity index (PMI), contrary to forecasts, fell again - already the third month. Since January, this indicator is below the key 50th mark, thus demonstrating the deterioration of the situation. Experts predicted a slight increase (from 47.6 to 48.0 points), but the real numbers were much lower - at around 44.7 points. The European Central Bank has repeatedly lowered its forecasts for GDP growth and inflation in the current year - according to the latest estimates, the eurozone economy will grow by only 1.1% (the previous forecast suggested an increase to 1.7%). But given the dynamics of the German indicators, the European regulator may again revise its forecasts - naturally, in the direction of a decline. The ECB's next meeting will be held on April 10, however, in my opinion, the regulator will draw conclusions at the beginning of summer, that is, on June 6 (there will be no meetings in May). However, the market fears not so much a reduction in forecast estimates, as a reduction in interest rates. The RBNZ 's March meeting served as a "wake-up call" for many traders: for the first time, monetary policy easing was mentioned openly, and what is called in a "loud voice". Simultaneously, the central bank meetings of New Zealand and the United States sounded similar appeals. Stephen Moore, who is likely to be approved by the Congress to the Board of Governors of the Fed, called on Jerome Powell to reduce the rate immediately by 50 points. Therefore, it is only natural that weak European reports raise the likelihood of mitigating rhetoric in the ECB camp. However, for the time being, Mario Draghi is trying not to escalate the situation: he does not talk about a likely rate cut, although the market is not encouraging it. Speaking yesterday in Germany, he admitted that the eurozone faced a "steady deterioration in external demand," so the European Central Bank is ready to postpone the planned increase in interest rates "for a longer period." Given the fact that the market is now focused on the first half of 2020, a further decline will move the approximate date of the rate increase for December of the next year or even for 2021. Here we should not forget that Draghi will leave his position this fall, and the central bank's future policy will largely depend on the views of his successor. If the ECB is headed by Benoit Kurre, the dovish line of the regulator will continue, but if Erkki Liikanen (head of the central bank of Finland) wins in the backstage fight, then the number of hawks will somewhat increase. It is still too early to talk about this (the selection procedure will begin only in May), but in any case, nobody canceled the risk of a rate reduction - and the current data once again reminds us of such a probability. This factor was caused by the EUR/USD's decline in rate for today . At the beginning of the US session, the downward impulse was suspended due to unexpected news from the United States. It turned out that economic growth in the US in the final quarter of last year slowed down more than the initial estimates: indicators of consumer and government spending were revised downward, and quite significantly. Today, the final assessment of these indicators was published, and the release was in the "red zone". GDP growth was revised from 2.6% to 2.2%, and the price index of GDP - from 1.8% to 1.7%. Such dynamics put pressure on the US currency, but at the same time provoked panic in the markets. The threat of a repetition of "2008" again reminded of itself, with all the ensuing consequences. Thus, the main task of EUR/USD bulls at the moment is to keep the level of 1.1205 (the bottom line of the Bollinger Bands indicator). For the bears, the opposite task is to gain a foothold in the area of the 11th figure. If sellers do not have enough strength to reduce, then a corrective pullback to the boundaries of the 13th figure is quite likely, where the middle line of the Bollinger Bands indicator coincides with the Kijun-sen line on the daily chart. The material has been provided by InstaForex Company - www.instaforex.com |
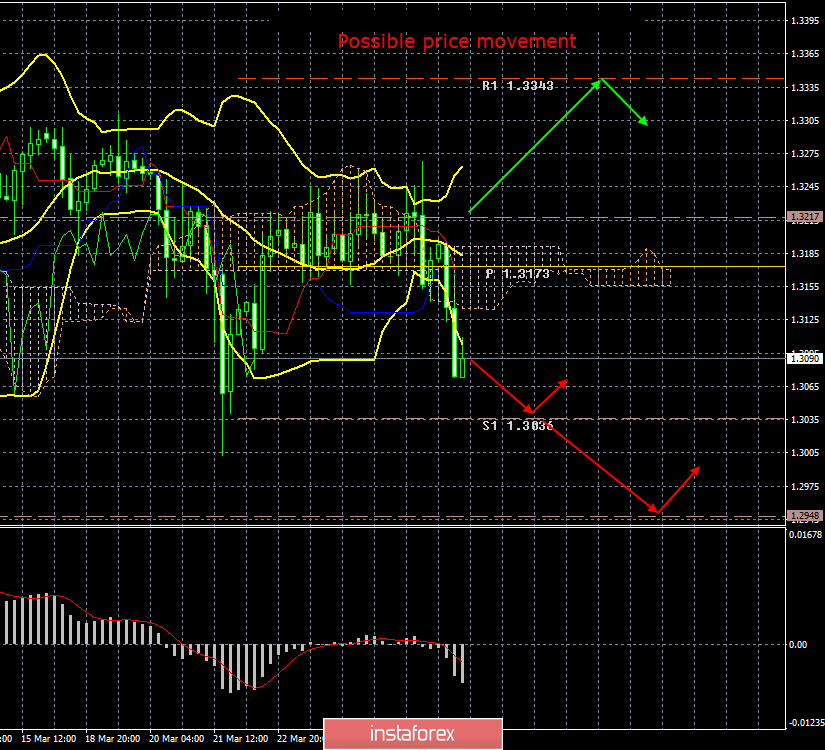
| Posted: 28 Mar 2019 03:42 PM PDT 4-hour timeframe The amplitude of the last 5 days (high-low): 223p - 143p - 86p - 104p - 115p. Average amplitude for the last 5 days: 134p (136p). The pound sterling spent several days trading in a limited price range. However, today, since there were no important news and reports from the UK, moreover, a report was released on US GDP, which frankly failed, the British currency fell down. It is illogical. Nevertheless, the pound has long been preparing for this fall. Just on the grounds that all the confusion surrounding Brexit can not support the UK currency. Now the main question is: will the pound's decline take long? Confusion in the British Parliament will continue. Until the government does not clearly articulate which version of Brexit it prefers, and does not come to a consensus with EU leaders, the pound will remain in the zone of downside risks. Tomorrow, GDP for the fourth quarter will be published in the UK. A forecast of +0.2% q/q. It is unlikely that this report will be able to help the British currency, except perhaps in the short term, and only if it turns out to be much better than the predicted value. At the moment, the pair has completed the first support level of 1.3036. Tomorrow there will be a slight pullback, since tomorrow is the final working day of the week and month. However, in general, the pound will likely continue to fall. Teresa May can only continue to insist on her proposal and offer her resignation to the Parliament as long as they support it. Will it work? Will Parliament accept her version of Brexit at its third attempt? We will likely find out soon. Trading recommendations: The GBP/USD currency pair resumed its downward movement. Therefore, it is now recommended to once again consider sell orders with targets of 1.3036 and 1.2948. The beginning of the correction is possible tomorrow, since today's strong fall requires it. In addition to the technical picture, one should also take into account the fundamental data and the time of their release. Explanation of illustration: Ichimoku Indicator: Tenkan-sen – red line. Kijun-sen – blue line. Senkou span a – light brown dotted line. Senkou span B – light purple dotted line. Chikou span – green line. Bollinger Bands Indicator: 3 yellow lines. MACD: A red line and a histogram with white bars in the indicator window. The material has been provided by InstaForex Company - www.instaforex.com |
| Bitcoin analysis for March 28, 2019 Posted: 28 Mar 2019 09:40 AM PDT
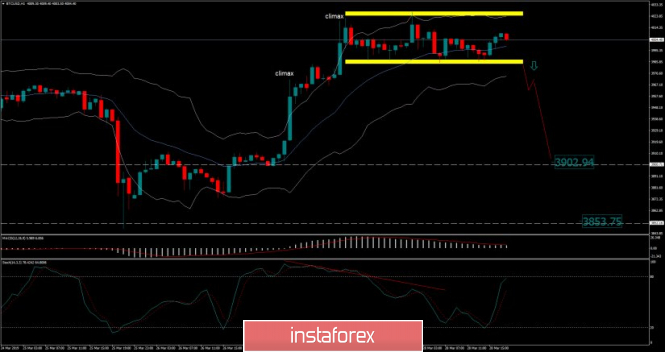
Trading recommendations: We found well defined trading range from $4.026 (resistance) and $3.986 (support). In the background, there are double climatic bars, which is indication for potential weakness. Our advice is to watch for potential breakout of the support ($3.986) to confirm further downside and potential distribution. Downward targets are seen at $3.902 and $3.853. Additionaly, there is a bearish divergence on the stochastic oscillator. With InstaForex you can earn on cryptocurrency's movements right now. Just open a deal in your MetaTrader4. The material has been provided by InstaForex Company - www.instaforex.com |
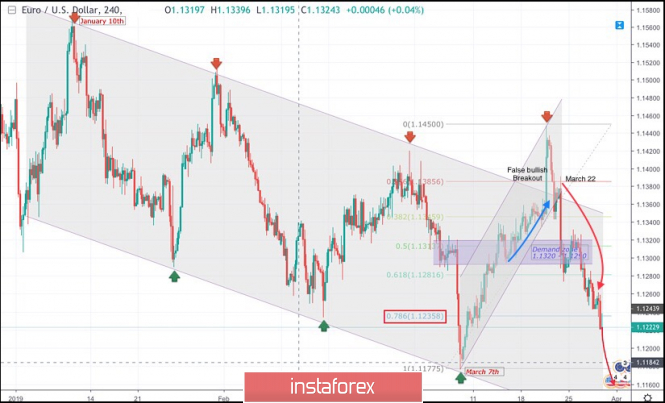
| March 28, 2019 : EUR/USD Intraday technical analysis and trade recommendations. Posted: 28 Mar 2019 09:31 AM PDT
On January 10th, the market initiated the depicted bearish channel around 1.1570. The bearish channel's upper limit managed to push price towards 1.1290 then 1.1235 before the EUR/USD pair could come again to meet the channel's upper limit around 1.1420. Shortly after, the recent bearish movement was demonstrated towards 1.1175 (channel's lower limit) where significant bullish recovery was demonstrated on March 7th. Bullish persistence above 1.1270 enhanced further bullish advancement towards 1.1290-1.1315 (the Highlighted-Zone) which failed to provide adequate bearish pressure. On March 18, a bullish breakout attempt was executed above 1.1327 (the upper limit of the Highlighted-zone). This enhanced further bullish movement towards 1.1450 demonstrating a false bullish breakout above the upper limit of the depicted movement channel. On the other hand, On March 22, significant bearish pressure was demonstrated around 1.1380 leading to the current bearish decline towards 1.1260 then 1.1220. The short term outlook for EURUSD pair remains bearish towards 1.1170 and 1.1120. Bearish persistence below 1.1235 (Fibonacci 78.6%) is mandatory to pursue towards the next mentioned bearish targets. Otherwise, another bullish pullback would be demonstrated towards 1.1280-1.1300. Trade recommendations : Based on previous recommendations, for those who sold the EURUSD around 1.1385 should lower their SL to 1.1250 to secure more profits. Remaining TP levels to be located around 1.1170 and 1.1120. The material has been provided by InstaForex Company - www.instaforex.com |
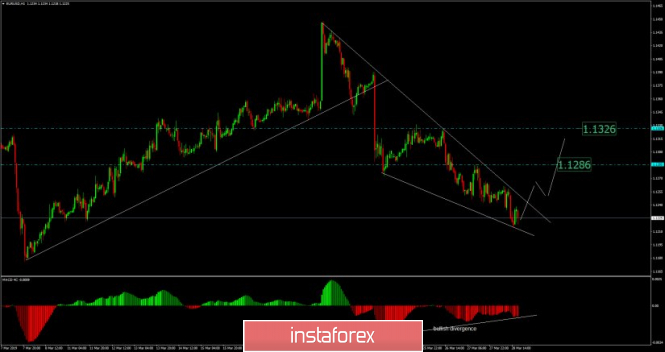
| EUR./USD analysis for March 28, 2019 Posted: 28 Mar 2019 09:31 AM PDT EUR/USD has been trading downwards. Anyway, we see potential oversold condition at the price of 1.1210 and downside looks very limited.
According to the H1 time – frame, we found potential falling wedge in creation and bullish divergence on the MACD oscillator, which is sign that we might see change in trend dynamic from bearish to bullish. Key short – term support is seen at the price of 1.1177. The potential breakout of the 1.1260 would confirm further upward movement. Resistance levels are seen at 1.1286 and 1.1326. Trading recommendation: We are long EUR from 1.1224 and with targets at 1.1286-1.1326. Protective stop is placed at 1.1175. The material has been provided by InstaForex Company - www.instaforex.com |
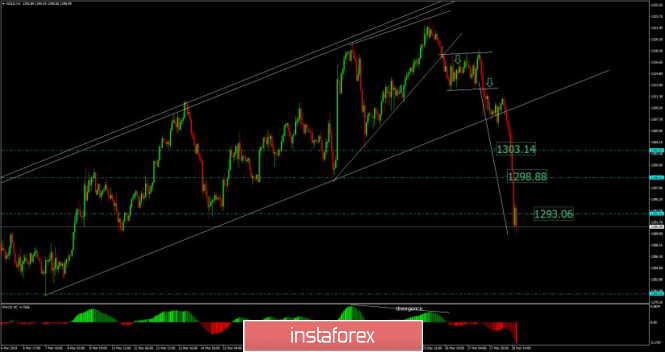
| Analysis of Gold for March 28, 2019 Posted: 28 Mar 2019 09:11 AM PDT Gold has been trading downwards as we expected. The Gold reached all three targets from yesterday. Still strong bearish momentum present but with the potential for balancing.
Our analysis from yesterday went perfectly and all three targets at $1.303.15, $1.298.90 and $1.293.00 were met. Momentum is still strong for downside but we would not advise you to sell anything at this point since we might see potential balancing or corrective rally. Also, there is the key short-term support at $1.280.50. Trading recommendation: We closed our short position on Gold at $1.293.00 with the profit of 200 pips. We are neutral now but with the view that Gold may visit $1.280.50 in the next period. The material has been provided by InstaForex Company - www.instaforex.com |
| GBP / USD. March 28. Results of the month. Brexit: complete uncertainty.The pound is at a loss Posted: 28 Mar 2019 09:10 AM PDT 24-hour timeframe The whole world has been waiting for a decision on Brexit for several months. At the end of last year, it seemed that the situation was nearing its end. March is over, and all that can be said about this is complete uncertainty. The only thing in which the British Parliament, Theresa May and the EU leaders agreed is that the Brexit should be postponed. However, there is no unity of opinion. The EU is ready to prolong the UK release dates until April 12, if the Parliament accepts the agreement, and by May 22, in the case of a "tough" scenario. None of these options are suitable for London. Thus, the parties "agreed" to move Brexit "later." And during this time, try to find new points of contact. What are these points, it is difficult to even guess. The pound sterling responds to these events very discreetly. This is amazing. By and large, no deterioration is expected yet, but the very fact that the parties cannot come to a consensus is very alarming. One gets the impression that traders are simply waiting for the first step from strong and large players, in order to later support their decision and follow the trend. If so, then the pound can wait for a strong and sharp collapse. There is only one way out of this situation – the acceptance of the agreement reached by Theresa May. But it does not suit the Parliament. However, in the absence of better options, the "deal" can still be approved by the House of Commons on the third attempt. However, first you need to organize a third vote. If it fails, it will be a complete absurdity, since London cannot even formulate what it wants, what kind of "divorce". Trading recommendations: The upward trend in the pair is not broken in the long term. However, the pair is being adjusted now, and trading in complete uncertainty is fraught with increased risks. Thus, we recommend extremely cautious trading in the coming weeks, preferably intraday. In addition to the technical picture should also take into account the fundamental data and the time of their release. Explanation of the illustration: Ichimoku indicator: Tenkan-sen - the red line. Kijun-sen - the blue line. Senkou Span A - light brown dotted line. Senkou Span B - light purple dotted line. Chinkou Span - green line. Bollinger Bands indicator: 3 yellow lines. MACD Indicator: A red line and a histogram with white bars in the indicator window. The material has been provided by InstaForex Company - www.instaforex.com |
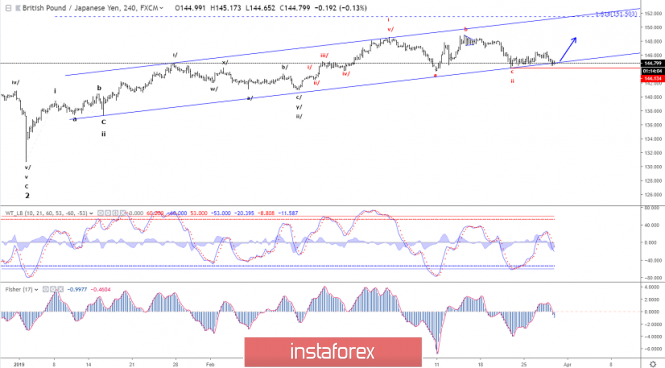
| Elliott wave analysis of GBP/JPY for March 28, 2019 Posted: 28 Mar 2019 09:04 AM PDT
It's disappointing at support at 145.00 has failed to protect the downside and it does increase the risk for more downside pressure towards 141.00 if a break below key-support at 144.13 also is seen. Minor resistance is now seen at 145.50 and only a break above here will ease the downside pressure and call for a rally to 146.50 which needs to be broken to lift the spirit for this cross. R3: 147.31 R2: 146.50 R1: 146.00 Pivot: 145.00 S1: 144.50 S2: 144.13 S3: 143.72 Trading recommendation: We will sell a break below 144.13 or buy a break above 145.50 The material has been provided by InstaForex Company - www.instaforex.com |
| EUR/USD. March 28. Results of the month. Euro – dollar: the situation is leveled Posted: 28 Mar 2019 08:58 AM PDT 24-hour timeframe The third month of 2019 for the European currency can be called negative. The European currency lost about 140 points against the US dollar, which, in principle, is not so much, if you do not to take into account all the previous losses. And so it turns out that the euro has lost another 140 points. The most interesting thing is that from a fundamental point of view, the confrontation between these currencies began to level off, although the advantage still remains with the US currency. After the Fed announced the completion of the course to raise the key rate, a clear advantage in the US monetary policy was leveled. At the same time, the economy of the States and the monetary policy of this country still remain much stronger. How about the EU? The EU still does not even think about tightening monetary policy, and the recent speech by Mario Draghi was marked by the extension of the period of ultra-low rates to at least the end of 2019. Further, the risks, according to Mario Draghi, remain downward, the ECB has launched a new TLTRO program to support the banking and financial systems. The index of business activity in the European Union is falling and the IDA of industrial production is already below 50, which means a potential inhibition of the economy. Moreover, if the States begin to put more pressure on the EU in trade negotiations (according to Trump, the EU also "unfairly treats the US"), it is the EU economy that will be the first to suffer. About Brexit, it is not even worth talking about. The very fact that it is not clear when and how it will end is not in favor of the European currency. In general, there is no frank signal to the new fall of the euro, but this may well happen. Around the current levels a reversal may occur, since the support area of 1.1200 - 1.1270 is extremely strong, but it cannot hold the pair above itself forever. Recommendation to traders: The trend for the pair is again changing to a downward one, but the further downward movement raises some doubts now. In the current price area, you can expect a reversal upward. However, a strong growth of the Euro is not expected, given the lack of fundamental support. Thus, the long-term flat may continue. In addition to the technical picture should also take into account the fundamental data and the time of their release. Explanation of the illustration: Ichimoku indicator: Tenkan-sen - the red line. Kijun-sen - the blue line. Senkou Span A - light brown dotted line. Senkou Span B - light purple dotted line. Chinkou Span - green line. Bollinger Bands indicator: 3 yellow lines. MACD Indicator: A red line and a histogram with white bars in the indicator window. The material has been provided by InstaForex Company - www.instaforex.com |
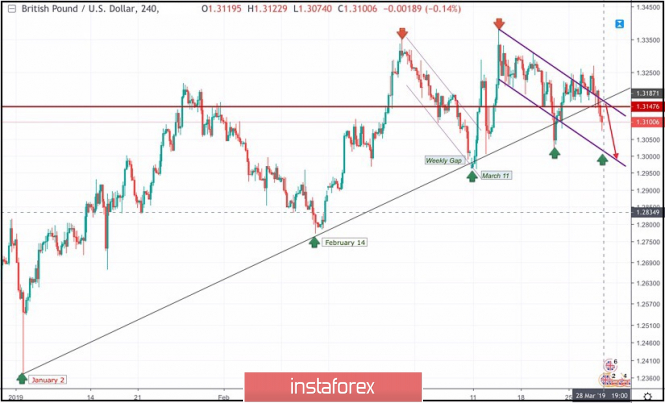
| March 28, 2019 : GBP/USD Intraday technical analysis and trade recommendations. Posted: 28 Mar 2019 08:56 AM PDT
On January 2nd, the market initiated the depicted uptrend line around 1.2380. This uptrend line managed to push price towards 1.3200 before the GBP/USD pair came to meet the uptrend again around 1.2775 on February 14. Another bullish wave was demonstrated towards 1.3350 before the bearish pullback brought the pair towards the uptrend again on March 11. A weekly bearish gap pushed the pair slightly below the trend line (almost reaching 1.2960) before the bullish breakout above short-term bearish channel was achieved on March 11. Bullish persistence above 1.3060 allowed the GBPUSD pair to pursue the bullish momentum towards 1.3130, 1.3200 then 1.3360 where the recent bearish pullback was initiated. Bullish persistence above 1.3250 was needed for confirmation of a bullish Flag pattern. However, significant bearish pressure was demonstrated below 1.3250 demonstrating a false bullish breakout above 1.3200 (the upper limit of the depicted bearish channel). Hence, the short term outlook turned to become bearish towards 1.3150 - 1.3120 where the depicted uptrend line failed to provide any immediate bullish support. Currently, further bearish decline should be expected towards 1.3020-1.3000 where the lower limit ofthe depicted movement channel is located. On the other hand, The price level around 1.3150 (backside of the broken trendline) stands as an Intraday resistance/supply level where a valid SELL entry can be taken upon any bullish pullback. Trade Recommendations: Intraday traders should wait for a bullish pullback towards 1.3150 for a valid SELL entry. SL to be located above 1.3190. TP levels to be located around 1.3100, 1.3050 and 1.3015. The material has been provided by InstaForex Company - www.instaforex.com |
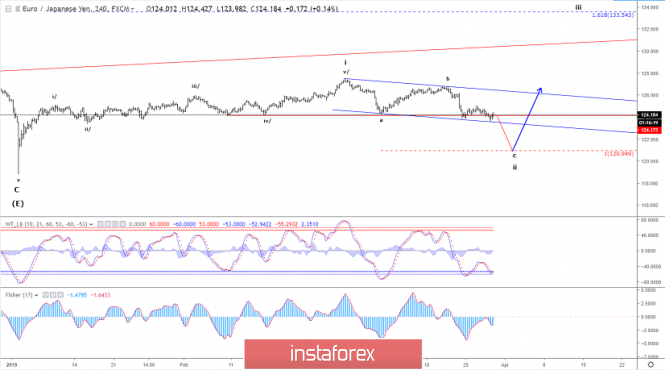
| Elliott wave analysis of EUR/JPY for March 28, 2019 Posted: 28 Mar 2019 08:55 AM PDT
We have seen the expected break below support at 124.20 indicating more downside pressure towards 123.37 and 122. 62 on the way towards the 120.95 where a bottom is expected. Short-term resistance is seen at 124.42 with back-up resistance at 124.74. On a break above the later, will ease the immediate downside pressure and call for a move closer to 125.27 before lower again. R3: 125.27 R2: 125.00 R1: 124.75 Pivot: 124.42 S1: 123.75 S2: 123.37 S3: 122.62 Trading recommendation: We are short EUR from 124.25 with our stop placed at 126.20. The material has been provided by InstaForex Company - www.instaforex.com |
| EURUSD: Insufficient inflation in Germany returns pressure on the euro Posted: 28 Mar 2019 08:17 AM PDT The euro continued to decline against the dollar after an unsuccessful growth attempt in the first half of the day amid good data on bank lending to eurozone companies, which increased. However, closer to the beginning of the North American session, the demand for the dollar returned again after a disappointing report on inflation in Germany, whose growth continued to slow down. According to the European Central Bank, lending to non-financial companies in February of this year grew immediately by 3.7% on an annualized basis. In January, the same indicator showed an increase of only 3.4%. Let me remind you that the eurozone economy is dependent on the availability of financing, and changes in this indicator can significantly affect the forecasts of economists regarding GDP growth rates. As for household lending, it also increased. As indicated in the report, lending in this sector in February of the current year grew by 3.3% on an annualized basis, after rising by 3.2% in January. The M3 monetary aggregate rose 4.3% in February after rising 3.8% in January. Economists had expected the indicator to grow by 3.9%. Weak data on the sentiment index in the eurozone economy has disappointed investors, once again signaling an impending recession, which the European Central Bank has so far denied in every way. According to the report of the European Commission, the sentiment index in the eurozone economy in March 2019 was 105.5 points against 106.2 points in February. Economists had expected the index to be 105.9 points in March. The main pressure on the euro was formed after the release of the report, indicating that inflation in the flagship economy of the eurozone slowed down in March. According to the German Federal Bureau of statistics, Germany's harmonized consumer price index (HCPI) in March of this year grew by only 1.5% compared to the same period of the previous year after rising by 1.7% in February, which fully coincided with the forecast of economists. Although the data are preliminary, a slower rise in food prices could have a significant impact on the final calculation. In March, compared to February of the same year, the preliminary CPI rose only by 0.4%, while it was expected to grow by 0.6%. The main support is provided by energy prices, which in Germany rose by 4.5% in March, while the rise in food prices slowed to 0.7% from 1.4% in February. As for the technical picture of the EURUSD pair, the further downward trend will slow down in the area of new lows, which are now visible in the 1.1200 and 1.1170 areas. However, the main goal of sellers of risky assets will be the 1.1150 support test. Under the scenario of the upward correction of the euro, sellers will not take long to wait in the area of major resistance 1.1270 and 1.1295. The material has been provided by InstaForex Company - www.instaforex.com |
| The dollar keeps afloat due to the fact that it remains the best of the worst, TD bank says Posted: 28 Mar 2019 07:15 AM PDT Experts of Toronto-Dominion Bank (TD) believe that the US currency may still strengthen in the short term. However on the long-term, the risks noticeably weakening, including in relation to the euro. "Given the unsustainable growth of global GDP, and the fact that monetary authorities around the world are rejecting hawkish views, it's not surprising that investors began laying in quotes the likelihood of lower interest rates from leading central banks," representatives of the financial institution said. "For us, it looks like a race to the bottom," they added. Mitigation of the rhetoric of the Federal Reserve System (FRS) of the United States seems to be due to fears that the country's economy will no longer be able to achieve such results as before. "With the support of short-term factors, greenback can still be strengthened. In particular, this will be observed if trade tensions move to Europe. However, long-term prospects speak in favor of the weakening of the American currency. And this should already be clearly manifested by the end of this year, "experts say. The bank expects the dollar index to be 92.5 points at the end of 2019 and 88.2 at the end of next year . "The "American" keeps afloat largely due to the fact that it remains the best of the worst among the G10 currencies," TD currency strategists noted. It is assumed that the difference in interest rates in the US and the Eurozone will play in favor of a strong dollar. Meanwhile, market participants are rapidly lining up in expectations of a cut in interest rates from the Fed this year. It is possible that the first such step may be followed in September. It can push upward the EUR/USD pair. According to the TD forecast, the euro against the dollar will reach $1.19 by the end of 2019, and $ 1.25 by the end of 2020. The material has been provided by InstaForex Company - www.instaforex.com |
| GBP / USD plan for the American session on March 28. Pound declines amid uncertainty about Brexit Posted: 28 Mar 2019 07:03 AM PDT To open long positions on the GBP / USD pair, you need: Just yesterday it became known that the situation with Brexit became even more complicated after the failed vote in the British Parliament for various scenarios on Brexit. Buyers have missed several levels of support and the entire emphasis on long positions is currently shifted to the lows of 1.3083 and 1.3045, from where you can buy a pound when a false breakdown forms. The main task of the bulls in the afternoon will be the return of GBP/USD pair to the intermediate resistance of 1.3122, which will lead to an upward correction in the region of the maximum of 1.3162. To open short positions on the GBP / USD pair, you need: Bears are actively selling the pound and while the trade moves below the resistance of 1.3122, we can expect a renewal of the minimum in the area of 1.3083 and 1.3045, where I recommend fixing the profit. In clarifying the situation for Brexit, the demand for the pound may return, which will lead to an increase in the pair above the resistance of 1.3122. In such a scenario, it is best to open short positions after testing the maximum of 1.3162 or for a rebound from a larger resistance at 1.3212. More in the video forecast for March 28 Indicator signals: Moving averages Trade is conducted below the 30- and 50-medium moving, which indicates the bearish tone of the market. Bollinger bands In the case of an upward correction, the average border of the Bollinger Bands indicator in the area of 1.3170 will act as resistance. Description of indicators MA (moving average) 50 days - yellow MA (moving average) 30 days - green MACD: fast EMA 12, slow EMA 26, SMA 9 Bollinger Bands 20 The material has been provided by InstaForex Company - www.instaforex.com |
| EUR / USD plan for the US session on March 28. Weak German inflation data upset euro buyers Posted: 28 Mar 2019 06:54 AM PDT To open long positions on EUR / USD pair, you need: If in the first half of the day, buyers of the European currency manages to keep above the support of 1.1240 and even attempted to resume an upward correction, then a weak inflation report led to a breakdown of this level. At the moment, it is best to consider long positions in the euro after updating the support of 1.1208 or buy on a rebound from a new low of 1.1176. The main task will be to return and consolidation above the resistance of 1.1240 from where we can expect growth in the area of 1.1269. To open short positions on EUR / USD pair, you need: Traders ignored the weak report on US GDP for the 4th quarter, as it did not become news to anyone. While the trade is conducted below the range of 1.1240, the pressure on the euro will continue and the purpose of the bears will be a around the minimum levels of 1.1208 and 1.1176, where I recommend taking profits. When the scenario of the EUR/USD pair returns to the resistance level of 1.1240 in the second half of the day, it is best to consider short positions on a rebound from the maximum of 1.1269 and 1.1294. More in the video forecast for March 28 Indicator signals: Moving averages Trade is conducted below the 30- and 50-medium moving, which indicates the preservation of the bearish nature of the market. Bollinger bands In the case of an upward correction, the upper limit of the Bollinger Bands indicator in the area of 1.1269 will act as resistance. Description of indicators MA (moving average) 50 days - yellow MA (moving average) 30 days - green MACD: fast EMA 12, slow EMA 26, SMA 9 Bollinger Bands 20 The material has been provided by InstaForex Company - www.instaforex.com |
| Trading recommendations for the EUR / USD pair - placement of trading orders on March 28 Posted: 28 Mar 2019 06:42 AM PDT The Euro/Dollar currency pair showed low volatility of 43 points for the past trading day, as a result of continuing downward movement. From the point of view of technical analysis, we have a further downward movement, where the quotation closely approached the periodic level of 1.1230, on the area where clusters were repeatedly noted. Information and news background developed at the controversial long-playing Brexit. Yesterday, the British Parliament once again held a vote and there were eight votes on alternative options for the secession of the country from the EU. The only thing that was agreed upon was the consolidation of new dates for leaving the European Union in legislation is either without a deal on April 12 or on May 22. A complete dead end, otherwise, it is impossible to identify it. In turn, Prime Minister Theresa May said that it will once again put to the vote all the same agreement for consideration by the House of Commons on March 29. I note that on Friday, March 29, is the last day for making a decision. Otherwise, it's hard Brexit. In terms of today's economic calendar, we have the final data on the United States GDP for the fourth quarter, where a significant slowdown in economic growth from 3.4% to 2.4% is expected. Further development: Analyzing the current trading schedule, we can see forming versatile candles, such as doji, within the level of 1.1230. It is likely to assume that the descending interest will continue against the general background, but today, bad statistics are coming out of the States as mentioned above. Moreover, it can play in favor of strengthening the euro, forming a rollback and level testing. Based on the available data, it is possible to deduct a number of variations, let's consider them: - We consider buying positions in the case of price fixing higher than 1.1270 with the target at 1.1290-1.1300. - We consider selling positions in the case of price fixing lower than 1.1230 with the target at 1.1180. Indicator Analysis Analyzing a different sector of timeframes (TF), we can see that in the short term there is an upward interest against the background of stagnation and attempts to refine the level. Intraday and mid-term outlook preserve the downward interest against the general background of the market. Weekly volatility / Measurement of volatility: Month; Quarter; Year Measurement of volatility reflects the average daily fluctuation, with the calculation for the Month / Quarter / Year. (March 28 was based on the time of publication of the article) The current time volatility is 27 points. It is likely that we will still see an increase in volatility by the end of the working day due to the news background. Key levels Zones of resistance: 1.1300 **; 1.1440; 1.1550; 1.1650 *; 1.1720 **; 1.1850 **; 1.2100 Support areas: 1.1230 *; 1.1180; 1.1000 * Periodic level ** Range Level The material has been provided by InstaForex Company - www.instaforex.com |
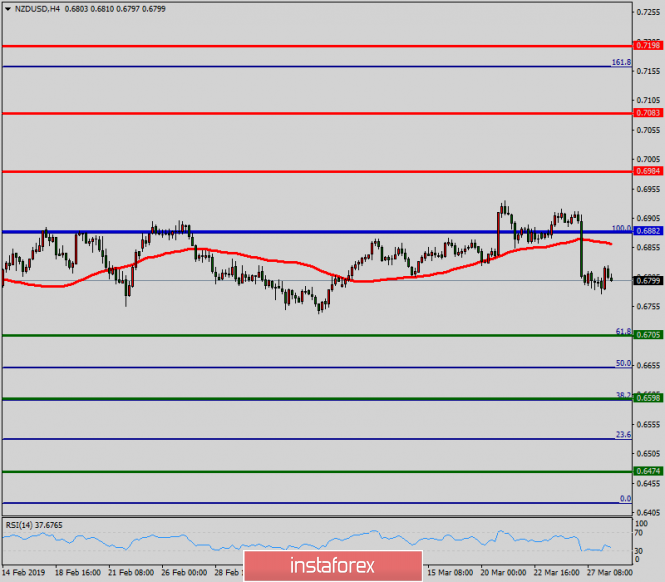
| Technical analysis of NZD/USD for March 28, 2019 Posted: 28 Mar 2019 06:01 AM PDT The NZD/USD pair breached resistance which had turned into strong support at the level of 0.6705. The pair is still moving around the daily pivot point of 0.6882. The level of 0.6705 coincides with a golden ratio, which is expected to act as major support today. The RSI is considered to be overbought, because it is above 70. The RSI is still signaling that the trend is upward as it is still strong above the moving average (100). Besides, note that the pivot point is seen at 0.6882. This suggests that the pair will probably go up in the coming hours. Accordingly, the market is likely to show signs of a bullish trend. In other words, buy orders are recommended to be placed above 0.6800 with the first target at the level of 0.6882. From this point, the pair is likely to begin an ascending movement to 0.6882 and further to 0.6984. The level of 0.6984 will act as strong resistance. On the other hand, if there is a breakout at the support level of 0.6705, this scenario may become invalidated. The material has been provided by InstaForex Company - www.instaforex.com |
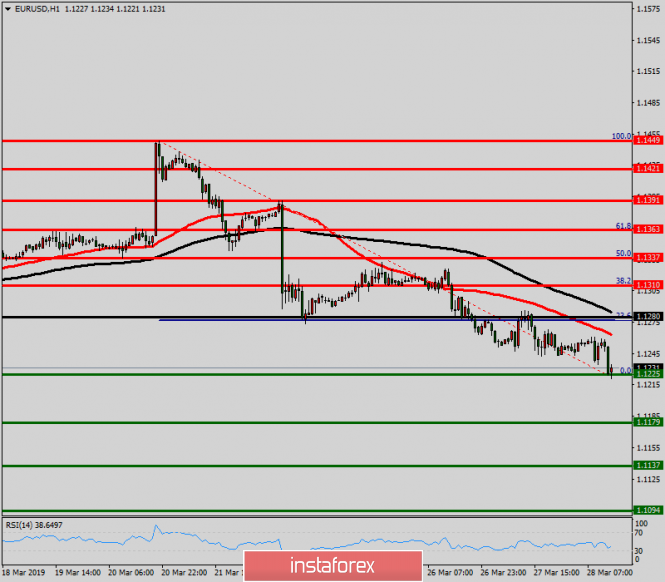
| Technical analysis of EUR/USD for March 28, 2019 Posted: 28 Mar 2019 05:58 AM PDT As expected; the EUR/USD pair continues to move downwards from the level of 1.1280. Yesterday, the pair dropped from the level of 1.1280 to the bottom around 1.1225. Today, the first resistance level is seen at 1.1280 followed by 1.1310, while daily support 1 is seen at 1.1179. According to the previous events, the EUR/USD pair is still moving between the levels of 1.1280 and 1.1179; for that we expect a range of 101 pips (1.1280 - 1.1179). If the EUR/USD pair fails to break through the resistance level of 1.1280, the market will decline further to 1.1179. This would suggest a bearish market because the RSI indicator is still in a positive area and does not show any trend-reversal signs. The pair is expected to drop lower towards at least 1.1137 with a view to test the second support. On the contrary, if a breakout takes place at the resistance level of 1.1280 (the double top), then this scenario may become invalidated. The material has been provided by InstaForex Company - www.instaforex.com |
| US refinery does not expect a decline by the end of the year, despite the drop in prices Posted: 28 Mar 2019 05:13 AM PDT Following the bidding on Wednesday, March 27, oil quotes became significantly cheaper. Nevertheless, experts are optimistic but they are not expecting a further price cut by the oil industry in the United States by the end of 2019. The sentiment of market participants was negatively affected by a report from the US Department of Energy. They mentioned that the country's black gold reserves increased by 2.8 million barrels over the week, which exceeded analysts' expectations. The growth of reserves was partly due to the closure of the pipeline in Houston, which negatively affected the volume of US exports. Oil prices also reacted to the fall in the US stock market, which is usually accompanied by an increase in demand for treasury bonds. Investors also do not discount the risks associated with a possible slowdown in the global economy. The current situation is shaping the increase in demand for "safe haven" assets, experts sum up. On Wednesday evening, the dollar appreciated in the currency market. According to analysts, this reduces the financial attractiveness of commodities traded in US dollars, including oil. According to forecasts of a number of experts, the cost of WTI light oil will remain at around $60.19 per barrel at the end of this year, which is close in value to current quotes. |
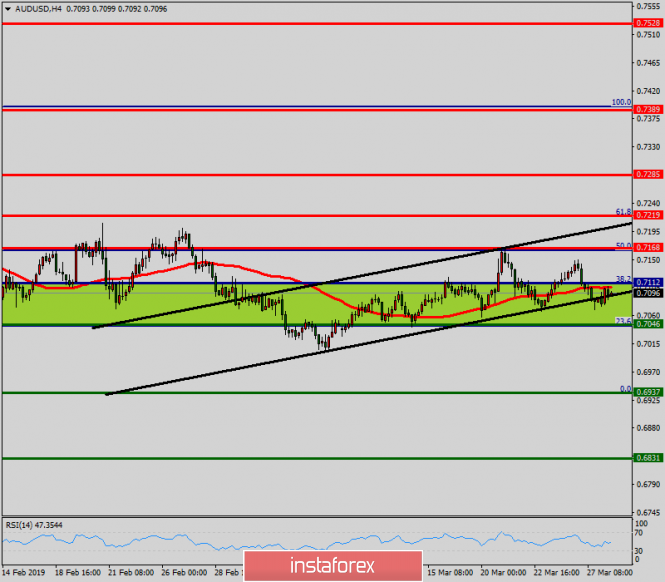
| Technical analysis of AUD/USD for March 28, 2019 Posted: 28 Mar 2019 03:39 AM PDT Overview: Pivot: 0.7112. The AUD/USD pair is set above strong support at the level of 0.7046 which coincides with the 23.6% Fibonacci retracement level and 0.7168. This support has been rejected four times confirming the uptrend. Hence, the major support is seen at the level of 0.7046, because the trend is still showing strength above it. Accordingly, the pair is still in the uptrend in the area of 0.7046 and 0.7168. The AUD/USD pair is trading in the bullish trend from the last support line of 0.7112 towards thae first resistance level of 0.7168 in order to test it. This is confirmed by the RSI indicator signaling that we are still in the bullish trending market. Now, the pair is likely to begin an ascending movement to the point of 0.7168 and further to the level of 0.7290. The level of 0.7389 will act as the major resistance and the double top is already set at the point of 0.7389. At the same time, if there is a breakout at the support levels of 0.7112 and 0.7046, this scenario may be invalidated. Overall, however, we still prefer the bullish scenario. The material has been provided by InstaForex Company - www.instaforex.com |


| You are subscribed to email updates from Forex analysis review. To stop receiving these emails, you may unsubscribe now. | Email delivery powered by Google |
| Google, 1600 Amphitheatre Parkway, Mountain View, CA 94043, United States | |
No comments:
Post a Comment