
Forex analysis review |
- The global debt market is reeling
- Bitcoin analysis for March 29, 2019
- BITCOIN Analysis for March 29, 2019
- Analysis of Gold for March 29, 2019
- EUR and GBP: Euro buyers are trying to take the lead. Pound falls further while waiting for the results of the vote
- GBP/USD analysis for March 29, 2019
- March 29, 2019 : GBP/USD Intraday technical analysis and trade recommendations.
- Expert opinions diverged: What determines the EUR / USD rate now?
- GBP / USD plan for the US session on March 29. The pound partially recovered after the update of major support level at 1.3000
- The dollar made a comeback
- EUR/USD: plan for the US session on March 29. Euro buyers return to the market
- Day X for Britain: will the European Union lose one "star"
- Wave analysis for EUR / USD pair on March 29. Another complication in the downward trend?
- GBP/USD. March 29. The trading system. "Regression Channels". Theresa May's last chance
- EUR/USD. March 29. The trading system. "Regression Channels". Hopes of the euro only on the strength level of 1.1200
- Brexit: The third "circle of hell" for the UK Parliament
- Analysis of EUR/USD divergence for March 29. The pair is ready to roll back up
- Analysis of GBP/USD divergence for March 29. The pound is also ready to roll back due to bullish divergence
- Trading Plan 03/29/2019
- EUR/USD: technical review 29.03.2019
- Technical analysis of USD/CAD for March 29, 2019
- Technical analysis of USD/CHF for March 29, 2019
- AUDJPY consolidates as both economies struggle
- Technical analysis of GBP/USD for March 29, 2019
- Fundamental analysis of NZD/USD for March 29, 2019
| The global debt market is reeling Posted: 29 Mar 2019 08:53 AM PDT At the moment, experts assess the state of the global debt market as unstable, calling this phenomenon Japanization, "flight to quality" and an attempt to adapt to the new standards proposed by the Fed. Analysts believe that in the near future, the world economy will face a fall in growth rates and slide into deflation. The Japanization of the global economy is growing, and the debt market demonstrates this. This term implies the development of the economy according to the Japanese scenario. Note that in the Land of the Rising Sun, there has been no growth over the past twenty years. The state is constantly struggling with deflation, although the Bank of Japan uses all possible tools to stimulate price growth. The reason for this is partly the policy of the Japanese regulator. A few years ago, the Central Bank of Japan first started printing money, which in the short term proved very effective. However, this later led to negative consequences. Nevertheless, the launch of QE was decided by major players in the world market – the Fed and the ECB, and now they have to find a way out of the impasse. Currently, the yield of indicative US Treasury securities is at a minimum, and the rates on Germany's public debt were in the red. At the same time, according to Bloomberg, century-old bonds, associated with the risk of changes in interest rates, suddenly became one of the market leaders. Surprisingly, investors ignore the inevitable uncertainty associated with attempts to bet a hundred years ahead. Over the past three weeks, the capitalization of bonds with an investment grade rating and high-yield bonds of the world soared almost $ 1.6 trillion, reaching $ 55 trillion, Bloomberg noted. Investors have a new appetite for risk, and they expect that central banks will fuel their profits before the end of the credit cycle. Thirty-year Bundes, whose yield is only 0.54%, went up by 7.7%, ahead of the "junk" bonds and bonds of emerging markets. Currently, corporate debt markets are also involved in the pursuit of profitability. However, in the event of a slowdown in economic growth, the balance sheets of companies will suffer, because they will not be able to service a high debt burden. In the debt market of Europe, the situation also leaves much to be desired. The yields of ten-year German bonds fell below the yields of similar bonds in Japan. Experts consider this a wake-up call for the global economy. They believe that Europe may face a recession at a time when rates will still be negative. At the same time, the ECB can do little to help, since it does not have the tools to stimulate economic growth. The material has been provided by InstaForex Company - www.instaforex.com |
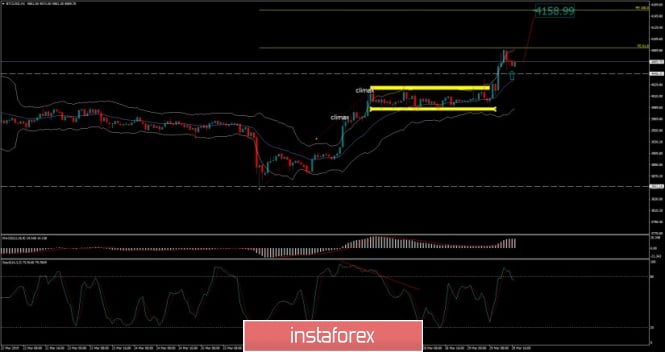
| Bitcoin analysis for March 29, 2019 Posted: 29 Mar 2019 08:49 AM PDT We found the upside breakout of the well-defined trading range in the background, which is sign that buyers are in control. The short-term trend is bullish and the Keltner channel is going upwards, which are all signs of the strength. Resistance levels are found at $4.158 and $4.270. Support level is found at the price of $4.020.
Trading recommendation: We are long BTC from $4.070 with target at 4.158. Protective stop is placed at $3.983. The material has been provided by InstaForex Company - www.instaforex.com |
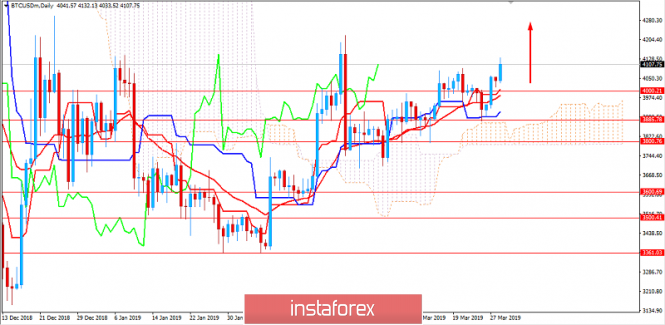
| BITCOIN Analysis for March 29, 2019 Posted: 29 Mar 2019 08:45 AM PDT Bitcoin managed to sustain the bullish momentum above $4,000. The level has been recently retested. The price is going on with a rally. The price is currently trading above $4,100. BTC is likely to extend its climb towards $4,250 and later towards $4,500 area in the coming days. The price is currently being supported by the dynamic level of 20 EMA, Tenkan, Kijun, and Kumo Cloud. Such support is expected to carry the price further upward. The price formation currently is breaking above the corrective volatile range. On the other hand, breaking above $4,250 will help the price to get impulsive momentum, so the price could extend a rally towards $4,500 and later towards $5,000 in the short term as there is no obstacle which could put pressure on bullish momentum. As the price remains above $4,000, the price will acculumate the impulsive bullish pressure.
|
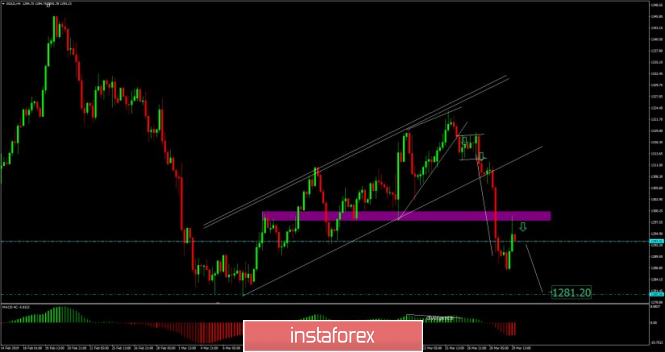
| Analysis of Gold for March 29, 2019 Posted: 29 Mar 2019 08:35 AM PDT Gold has been trading sideways in past 24-hours but the supply is still present. We still expect more downside on the Gold.
According to the H4 time – frame, we found rejection from the strong resistance cluster at the price of 1.300.00, which is sign that buying looks very risky and that more downside is expected. The 4h candle closed in the middle, suggesting that underlying weakness. Our advice is to watch for selling opportunities. Support is seen at the price of $1.281.00. As long as the resistance cluster (purple rectangle) at $1.300.00 is holding, we remain bearish. Trading recommendation: We are short with small position from $1.293.00 and target at 41.281.20. The material has been provided by InstaForex Company - www.instaforex.com |
| Posted: 29 Mar 2019 08:32 AM PDT The good data on the German labor market was not enough for buyers of risky assets to return to the market in the first half of the day. Weak reports on the French economy led to the resumption of the downtrend. According to the report, the unemployment rate in Germanyin March reached a new minimum this year, which happened because of the high demand in the labor market. As noted in the Federal Employment Agency, the unemployment rate in Germany was 4.9% in March against 5% in February. The number of applications for unemployment benefits fell by 7,000 compared with February, while economists had forecast a decline of 10,000. The total number of unemployed in Germany was 2.301 million in March, whereas the previous figure was at around 2.373 million in February. As I noted above, a weak report on the French economy affected the euro quotes. First of all, traders were worried about the report on the consumer price index, which showed a weaker growth than expected for the month of March this year in France. According to the report, consumer prices rose by 0.8% in March compared to 1.1% per annum in February. Economists had forecast a consumer price index in France at 1.0% and 1.3%, respectively. As for the index harmonized according to EU standards, it added 1.3% in March against 1.6% per annum in February. The sharp decline in consumer spending in France will have a negative impact on the future on already slowing economic growth rates. According to the data, expenses fell by 0.4% in February of this year and by 1.8% compared to February 2018. Expenditures were projected to increase by 0.2% compared in February and a decline by 1.3% against last year. On the contrary, the state budget deficit of France rose to 36.9 billion euros at the end of February against 28.5 billion euros at the end of February 2018 due to more than a sharp decline in income and an increase in expenditure. As for the technical picture of the EUR/USD pair, it remained unchanged. The further downward trend will continue with the minima in the region of 1.1200 and 1.1170. However, the main goal of sellers of risky assets is to test the support level of 1.1150. Under the scenario of the upward correction of the euro, sellers will not take long to wait in the area of major resistance at 1.1270 and 1.1295. Great Britain The British pound fell against the US dollar and continued its downtrend pending a vote in the British Parliament on the Brexit issue. There was pressure on the pound in the first half of the day amid a weak report on the investments of British companies, which decreased again in the 4th quarter of 2018 for the fourth time in a row. According to the data of the National Bureau of Statistics of the United Kingdom, capital investments of companies decreased by 0.9% compared with the previous quarter in the 4th quarter of 2018. The weak growth of the UK economy at the end of last year also did not make traders happy. According to the GDP data in the 4th quarter, it grew by only 0.2% compared with the previous quarter. In comparison to the growth in the same period of the previous year, it was revised upward to 1.4% from 1.3%. The current account deficit of the balance of payments amounted to 23.7 billion pounds in the 4th quarter against 23 billion pounds in the 3rd quarter. The material has been provided by InstaForex Company - www.instaforex.com |
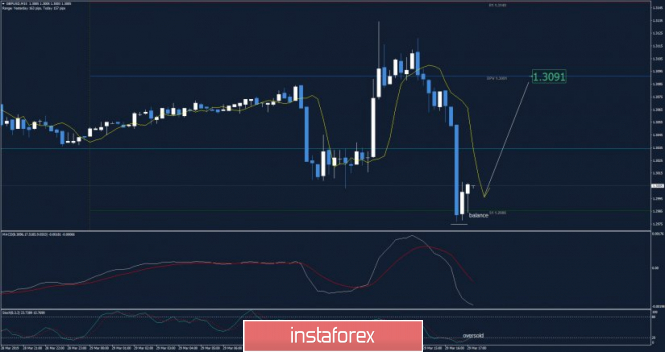
| GBP/USD analysis for March 29, 2019 Posted: 29 Mar 2019 08:24 AM PDT GBP/USD has been trading downwards. The price tested the level of 1.2977. Anyway, potential oversold condition is found.
According to the M15 time – frame, we found rejection from the support 1 at the price of 1.2986, which is sign that selling looks very risky. Also, stochastic oscillator is in oversold condition, which adds more potential strength on the GBP. Resistance levels are seen at the price of 1.3090 (pivot) and at 1.3149 (RR1). Trading recommendation: We are long GBP from 1.3022 and targets at 1.3090 and 1.3150. The material has been provided by InstaForex Company - www.instaforex.com |
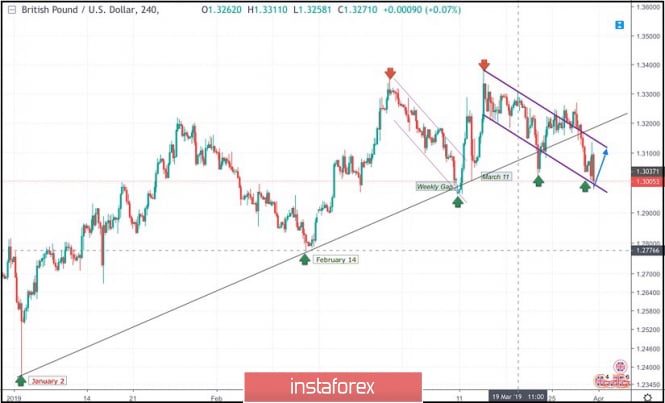
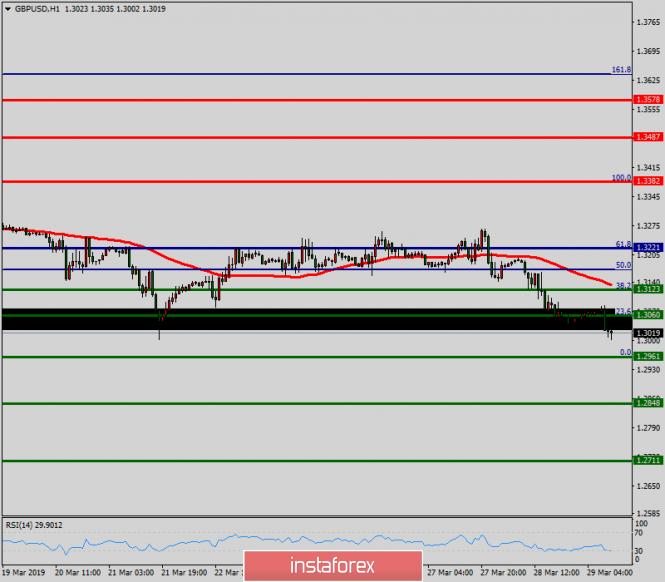
| March 29, 2019 : GBP/USD Intraday technical analysis and trade recommendations. Posted: 29 Mar 2019 08:23 AM PDT
On January 2nd, the market initiated the depicted uptrend line around 1.2380. This uptrend line managed to push price towards 1.3200 before the GBP/USD pair came to meet the uptrend again around 1.2775 on February 14. Another bullish wave was demonstrated towards 1.3350 before the bearish pullback brought the pair towards the uptrend again on March 11. A weekly bearish gap pushed the pair slightly below the trend line (almost reaching 1.2960) before the bullish breakout above short-term bearish channel was achieved on March 11. Bullish persistence above 1.3060 allowed the GBPUSD pair to pursue the bullish momentum towards 1.3130, 1.3200 then 1.3360 where the recent bearish pullback was initiated. Bullish persistence above 1.3250 was needed for confirmation of a bullish Flag pattern. However, significant bearish pressure was demonstrated below 1.3250 demonstrating a false bullish breakout above 1.3200 (the upper limit of the depicted bearish channel). Hence, the short term outlook turned to become bearish towards 1.3150 - 1.3120 where the depicted uptrend line failed to provide any immediate bullish support. Currently, the price levels of 1.3020-1.3000 (the lower limit of the depicted movement channel) is being challenged where bullish rejection is expected to be found. Next bullish target is located around 1.3140 where the upper limit of the depicted movement channel is located. Trade Recommendations: Intraday traders can have a valid BUY entry around the lower limit of the movement channel (1.3000-1.3020). SL to be located below 1.2970. TP levels to be located around 1.3100 and 1.3140 The material has been provided by InstaForex Company - www.instaforex.com |
| Expert opinions diverged: What determines the EUR / USD rate now? Posted: 29 Mar 2019 08:21 AM PDT According to some experts, the difference in interest rates of the ECB and the Fed is no longer the decisive factor in the change in the value of the euro against the dollar. "In order to predict the dynamics of the euro against the dollar, traders must now monitor the flow and outflow of capital in the stock market," said Mark McCormick, currency strategist at TD Securities. McCormick said that the euro may strengthen if the outflow of funds from European stocks slows down. According to Bloomberg, European funds traded on US exchanges (ETFs) experienced an outflow of capital from the eurozone in the amount of $ 859 million in 2019. The euro also suffered losses this year as it plunged by almost 2.1% against the dollar. "The slowdown in the global economy is putting pressure on stock prices. Here, we should also add the weakness of the Chinese economy, as well as trade disputes between Washington and Beijing", said McCormick. In early March, the Asian empire promised to adopt a wide package of incentives aimed at overcoming economic weakness. At the same time, the euro area will receive the biggest fiscal stimulus in a decade. In addition, if the United States and the PRC ultimately conclude a trade agreement, firstly, this will weaken investors' concerns about a slowdown in global growth, and secondly, it will contribute to the restoration of such major sectors of the European economy as banking and automobiles. "The eurozone is now in the process of stabilization. It may take two to three months of positive statistical data to change the psychology of the market. Most likely, this will happen in the third quarter", said McCormick. Meanwhile, an analyst at Jefferies Group, Brad Bechtel, believes that the difference in interest rates between the ECB and the Fed is still not to be written off. Although at the moment, a combination of threats related to Brexit serves as a factor in determining the direction of the EUR/USD pair and common European political fears. He expects that in the summer, the weakening of the dollar will begin to gain momentum and the euro will rise to $ 1.16 in value. The material has been provided by InstaForex Company - www.instaforex.com |
| Posted: 29 Mar 2019 08:08 AM PDT To open long positions on the GBP / USD pair, you need: The buyers coped with the task for the first half of the day and managed to work out the divergence from the support level of 1.3000, to which I paid attention. At the moment, the goal is to break through and consolidate above the resistance of 1.3099, which will lead to a new wave of growth in the pound and update highs around 1.3162 and 1.3212, where I recommend taking profits. In the case of a downward correction in the second half of the day, it is best to return to long positions on testing the support at 1.3051 or to rebound from a minimum of 1.3000. To open short positions on the GBP / USD pair, you need: The bears also coped with the morning task and managed once again to test at least at the level of 1.3000. A further downward movement will depend on the results of voting in the UK Parliament, which will be held tonight. In the case of growth above the level of 1.3099, you can consider short positions on the rebound from the maximum of 1.3162 and 1.3212. The main goal of the bears is to return to the support of 1.3051, which will lead to a new sale of GBP/USD pair already with a breakdown of 1.3000 and a test of new lows of 1.2909 and 1.2855. More in the video forecast for March 29 Indicator signals: Moving averages Trade is conducted below the 30- and 50-medium moving, which indicates the bearish nature of the market. Bollinger bands A break of the middle border of the Bollinger Bands indicator near 1.3051 may lead to a new sale of the pound. Description of indicators MA (moving average) 50 days - yellow MA (moving average) 30 days - green MACD: fast EMA 12, slow EMA 26, SMA 9 Bollinger Bands 20 The material has been provided by InstaForex Company - www.instaforex.com |
| Posted: 29 Mar 2019 07:00 AM PDT The US dollar in late March made the seemingly impossible possible. It grew despite an increase in the probability of weakening the Fed's monetary policy easing in 2019 to 75%, despite disappointing data on US GDP for the fourth quarter (+ 2.2%), despite progress in the negotiations between Washington and Beijing, about which Finance Minister Steven Mnuchin spoke. Neither the economic slowdown nor the "pigeon" rhetoric of FOMC representatives could stop the "bears" on EUR/USD, which managed to storm the lower limit of the medium-term consolidation range of 1.125-1.15. In early March, in a similar situation, the case ended with a false breakdown. Will the be a double "two" now? After the Central Bank lowered its forecast for US GDP in March from 2.3% to 2.1% in March and stopped expecting a rate hike in the current year, the dollar theoretically had to come under pressure. Indeed, if the normalization cycle is complete, and the inversion of the yield curve signals a recession with a time lag of 12-18 months, it would be nice to get rid of the toxic currency. Moreover, the derivatives market, which is counting on tightening monetary policy in December, openly spoke about monetary expansion in March. Dynamics of Fed rate forecasts A prolonged pause in the process of normalization or its completion with growing risks of a rate reduction led to a fall in the yield on 10-year Treasury bonds to a 16-month bottom. The attractiveness of US-issued securities is declining, which theoretically should lead to capital outflows and a weaker US dollar. In practice, before you get rid of the currency, it needs to be replaced by something in the investment portfolio. A couple of weeks ago, the euro featured as the best option. Indeed, the end of trade wars is a positive signal for the export-oriented economy of the eurozone. Its V-shaped recovery was supposed to help the "bulls" on EUR/USD to find the bottom and go to the counterattack. Alas, disappointing statistics on the economic confidence of the eurozone, German inflation, and business activity suggest that Germany is still far from rising from its knees. Mario Draghi and his colleagues are concerned about the reluctance of GDP to gr ow by more than 0.2% q / q and core inflation - to go far from the level of 1%. They are scared to look at the negative effects of using negative interest rates for the banking system and are ready to use LTRO and other tools to throw a lifeline to financial institutions of the currency bloc. Rumors about the introduction of differentiated interest rates into practice, which allow commercial banks not to pay for the resources placed on the accounts of the regulator, have dealt another blow to the bulls positions on EUR / USD. Technically for the euro buyers, nothing is lost. If they manage to cling to support at $ 1.125 and at $ 1.1185 (61.8% from the last long-term uptrend) and continue consolidation, the risks of restoring the bull trend and realizing the "Wolfe Wave" pattern will remain. And only a confident breakthrough of $ 1.118-1.1185 will allow the bears to count on the continuation of the southern campaign. The material has been provided by InstaForex Company - www.instaforex.com |
| EUR/USD: plan for the US session on March 29. Euro buyers return to the market Posted: 29 Mar 2019 06:53 AM PDT To open long positions on EURUSD you need: If in the first half of the day, the buyers of the European currency failed to get above the resistance of 1.1240 against the background of diverse fundamental statistics for the eurozone countries, then the bulls were able to hold the support level of 1.1208. At the moment, it is best to look at long positions in the euro after breaking through and consolidation above the resistance of 1.1240, where you can expect growth to the maximum area of 1.1269 and 1.1294, where I recommend taking profits. In the case of a repeated wave of EUR/USD decline in the afternoon, new purchases can be considered from the same support level of 1.1208 and a rebound from the new minimum of 1.1176. To open short positions on EURUSD you need: Weak inflation reports in France and Germany put pressure on the euro in the first half of the day, which led to a decline in the support area of 1.1208, which I paid attention to in the morning review. At the moment, while trading is below the 1.1240 range, the pressure on the euro will continue, and the bearish target will again be at least around 1.1208, a breakthrough of which will lead to a larger EUR/USD sale to the support area of 1.1176, where I recommend taking profits. When scenarios return EUR/USD to the resistance level of 1.1240 in the second half of the day, it is best to consider short positions on a rebound from the maximum of 1.1269 and 1.1294. Indicator signals: Moving Averages Trade is conducted below the 30-day and 50-medium moving, which indicates the preservation of the bearish nature of the market. However, a breakout of the slide could lead to a sharp rise in the euro. Bollinger bands An upward correction on the euro will be formed in case of a break of the upper border of the Bollinger Bands indicator in the 1.1240 area. Description of indicators
|
| Day X for Britain: will the European Union lose one "star" Posted: 29 Mar 2019 06:44 AM PDT At the beginning of this week, the GBP/USD pair consolidated in a narrow range of 1.31-1.32. On Wednesday, it attempted to break through its upper border but then left the range and rolled back in the direction of the 1.30 mark. "The market is now more than ever concerned about the fact of uncertainty regarding the UK's withdrawal from the European Union. From this point of view, the weakening of the pound looks more than logical. The situation on Brexit remains at a standstill. The British Parliament clearly indicates what it does not want but it's not clear what it really wants, "said Lee Hardman, currency strategist at Bank of Tokyo-Mitsubishi UFJ. Today in the House of Commons should be another vote on the draft "divorce" agreement proposed by British Prime Minister Theresa May. It is assumed that only the conditions for leaving the country from the EU without a political declaration will be put to the vote. This formally meets the requirement of the speaker of the House of Commons, John Bercow, to the government to make a modified version of the transaction. "It is extremely important that we do everything to approve the agreement this week. If we don't want to find ourselves in a situation, in which, we again need to ask for Brussels to grant Brexit a postponement and then also to participate in European elections," said Andrea Leadsome, leader of the House of Commons, a deputy from the Conservative Party. "This week in the British Parliament held eight votes" against "now you need only one vote" in favor "to move on", said by the official representative of the European Parliament, Margaritis Schinas. If the House of Commons approves the deal, the UK will leave the EU on May 22. Meanwhile, the fact that there is no positive parliamentary decision on the deal will not necessarily be negative for the pound sterling. On Wednesday, lawmakers rejected all eight alternative voting scenarios related to Brexit. However, two options scored the most votes. One of them is to maintain membership in the European Union, and the second is to hold a second referendum. That is, there is an option, in which to ensure compliance with the requirement, "it is impossible to leave the EU without an agreement", the Brexit itself will have to be canceled. If the likelihood of a repeated referendum increases, the GBP/USD pair will go upward. Will Theresa May finally be able to carry out his agreement through parliament and will she resign after that? Perhaps, we will find out today. The material has been provided by InstaForex Company - www.instaforex.com |
| Wave analysis for EUR / USD pair on March 29. Another complication in the downward trend? Posted: 29 Mar 2019 06:14 AM PDT Wave counting analysis: On Thursday, March 28, trading of EUR/USD ended with another 25 bp loss. Thus, the assumed wave b continues its formation, taking a pronounced three-wave form. The attempt to break the Fibonacci level of 76.4% was successful, hence, the chances that the current upward trend segment remains less and less. It seems that the tool will simply complicate the downward trend. All the waves of the last months are approximately the same in size that makes all wave structures not look like classical impulse or corrective. The news background remains neutral for the pair and it was completely in favor of the euro yesterday since it turned out to be weak from US GDP but this did not help the Euro currency. Sales targets: 1.1177 - 100.0% Fibonacci Purchase targets: 1.1448 - 0.0% Fibonacci General conclusions and trading recommendations: The pair is supposedly close to completing wave b. Now, I recommend waiting for a new signal to complete the current downward wave. However, it should be recognized that a strong decrease in the instrument significantly reduces the chances of building an uptrend trend. Nevertheless, in any case, the rising wave will be built, which will most likely be commensurate with all previous waves. The material has been provided by InstaForex Company - www.instaforex.com |
| GBP/USD. March 29. The trading system. "Regression Channels". Theresa May's last chance Posted: 29 Mar 2019 05:29 AM PDT 4-hour timeframe Technical details: The upper linear regression channel: direction - up. The lower linear regression channel: direction - up. Moving average (20; smoothed) - down. CCI: -172.9326 The GBP/USD currency pair abruptly resumed the downward movement yesterday after several days of stomping in one place. Yesterday evening, there was information that today will be the third vote on the draft "deal" by Theresa May with the EU. As stated by the Speaker of the British Parliament, the only chance to postpone Brexit is the adoption of an agreement reached by Theresa May. Thus, either today the Parliament accepts the "deal" with Brussels and then Brexit will be held on May 22, or rejects it and then the UK will withdraw from the EU on April 12 according to the "hard" scenario. Today is becoming the next day X for the UK and the British pound. Whatever the decision of the parliament, it will be taken late in the evening, so the markets simply will not have time to react to it. Thus, trading on Monday can be very volatile, and the pair can open to either side with a large gap. This point should be taken into account when opening any positions today and holding them for the weekend. Also today in the UK, a report on GDP for the fourth quarter will be published. Experts predict an increase of 1.3% y / y and 0.2% q / q. Any value below forecasts will create additional pressure on the British pound. Nearest support levels: S1 - 1.3062 S2 - 1.3000 S3 - 1.2939 Nearest resistance levels: R1 - 1.3123 R2 - 1.3184 R3 - 1.3245 Trading recommendations: The pair GBP/USD sharply resumed its downward movement. Since today another vote for the "deal" on Brexit will take place in Parliament, today and on Monday the volatility can be high, and the predictability of movements is extremely low. Therefore, we once again recommend extremely cautious trading during the day without transferring deals to Monday. In addition to the technical picture should also take into account the fundamental data and the time of their release. Explanations for illustrations: The upper linear regression channel is the blue lines of the unidirectional movement. The lower linear channel is the purple lines of the unidirectional movement. CCI is the blue line in the indicator regression window. The moving average (20; smoothed) is the blue line on the price chart. Murray levels - multi-colored horizontal stripes. Heikin Ashi is an indicator that colors bars in blue or purple. The material has been provided by InstaForex Company - www.instaforex.com |
| Posted: 29 Mar 2019 05:29 AM PDT 4-hour timeframe Technical details: The upper linear regression channel: direction - down. The lower linear regression channel: direction - down. Moving average (20; smoothed) - down. CCI: -112.7171 On Friday, March 29, the EUR/USD currency pair continues to move down as if nothing had happened. Yesterday, there were high hopes that the US GDP report for the fourth quarter would support the euro. The report was indeed weaker than the forecast values, but instead of the expected growth of the euro, we saw another fall. This concerns not only the euro, but also, for example, the pound sterling. Thus, it can be assumed that traders ignored the report on GDP because they have already outlined a long-term trading strategy, and it implies the sale of the euro. Therefore, on the last trading day of the week and months, we can see a small rollback up, but then there will definitely be attempts to continue moving down. Embarrassing, while the area of support 1.1200 - 1.1270 is still relevant that the bears failed to break with approximately seven attempts. However, this cannot continue all the time, and sooner or later it will not stand. Moreover, traders still do not see significant fundamental reasons for at least medium-term purchases of the European currency. Today, there will be no important macroeconomic publications in the eurozone, and information about changes in personal incomes and expenditures of the population will come from the States. Nearest support levels: S1 - 1.1200 S2 - 1.1169 Nearest resistance levels: R1 - 1.1230 R2 - 1.1261 R3 - 1.1292 Trading recommendations: The currency pair EUR/USD continues to move down. Thus, now it is still recommended to consider sell orders with targets at 1.1200 and 1.1169. The reversal of the Heikin Ashi indicator to the top will indicate the start of an upward correction Buy positions are recommended to be considered no earlier than fixing the pair back above the moving average line with targets at 1.1322 and 1.1353, but at the moment, this option is unlikely. In addition to the technical picture should also take into account the fundamental data and the time of their release. Explanations for illustrations: The upper linear regression channel is the blue lines of the unidirectional movement. The lower linear regression channel is the purple lines of the unidirectional movement. CCI - blue line in the indicator window. The moving average (20; smoothed) is the blue line on the price chart. Murray levels - multi-colored horizontal stripes. Heikin Ashi is an indicator that colors bars in blue or purple. The material has been provided by InstaForex Company - www.instaforex.com |
| Brexit: The third "circle of hell" for the UK Parliament Posted: 29 Mar 2019 05:29 AM PDT Today, all attention will again be focused on the British pound and on the next vote, already the third in a row, under the Brexit agreement proposed by Prime Minister Theresa May. According to experts, the new agreement will differ from previous versions in that it will not include the political declaration that was previously included in the package. If the Parliament supports May's proposal, the UK will withdraw from the EU on May 22. If the vote fails, and, most likely, it will, the term for the provision of an alternative version of the agreement in the UK will be until April 12 this year. The British pound is responding to all this news with a decline, and, most likely, the pressure will continue. Yesterday, a number of reports were published on the American economy, which generally failed to provide the necessary support for the US dollar. According to the US Department of Labor, the number of initial applications for unemployment benefits for the week from March 17 to 23 decreased by 5,000 and amounted to 211,000. Economists had expected that the number of applications would be 220,000. The number of secondary applications for the week from March 10 to 16 increased by 13,000 to 1,756,000. A weak GDP report limited the upward potential of the dollar. Not surprisingly, the US economy grew at a slower pace than expected in the 4th quarter. This happened due to lower profits of US companies. According to the US Department of Commerce, the gross domestic product in the 4th quarter of 2018 grew by 2.2% per annum, whereas previously it was reported that GDP growth was 2.6% per annum. Economists had expected GDP growth to be 2.2%. The number of signed contracts for the sale of housing in February decreased compared with the previous month. According to the National Association of Realtors, the index of signed contracts for the sale of housing in February fell by 1.0% compared with the previous month and amounted to 101.9. Economists had expected the index to show an increase of 0.7%. Compared to the same period of the previous year, the index fell by 4.9% in February. Production activity in the area of responsibility of the Federal Reserve Bank of Kansas City in March increased. The report indicates that the composite production index in March was 10 points against 1 in February. This week, a series of speeches by the Fed. Richard Clarida, vice chairman of the US Federal Reserve, did not miss this opportunity, saying that the Fed should pay even more attention to the risks of global economic growth. In his opinion, moderate inflationary pressure justifies a patient approach to the issue of interest rate adjustments in the future. Clarida is also concerned that the US economy has become more vulnerable to external shocks than in previous years. As for the technical picture of the EURUSD pair, the further downward trend will slow down in the area of new lows, which are now visible in the 1.1200 and 1.1170 areas. However, the main goal of sellers of risky assets will be the 1.1150 support test. Under the scenario of the upward correction of the euro, sellers will not take long to wait in the area of major resistance 1.1270 and 1.1295. The material has been provided by InstaForex Company - www.instaforex.com |
| Analysis of EUR/USD divergence for March 29. The pair is ready to roll back up Posted: 29 Mar 2019 05:29 AM PDT 4h As seen on the 4-hour chart, the EUR/USD pair continues the process of falling in the direction of the retracement level of 0.0% (1.1177). The bullish divergence in the CCI indicator allows traders to expect the pair to reverse in favor of the euro currency and some growth in the direction of the retracement level of 23.6% (1.1269). Fixing the pair's rate above the Fibo level of 23.6% will increase the likelihood of continued growth of quotations in the direction of the next retracement level of 38.2% (1.1328). The Fibo grid is based on the grounds of the extremums from January 10, 2019, and March 7, 2019. Daily As seen on the 24-hour chart, the pair settled below the Fibo level of 127.2% (1.1285). However, on the 4-hour chart, bullish divergence allows some growth to be expected. Thus, the fall in quotations can be continued in the direction of the retracement level of 161.8% (1.0941) after working off or canceling the bullish divergence. The closing of quotations on March 29 above the Fibo level of 127.2% will work in favor of the EU currency and the start of growth in the direction of the retracement level of 100.0% (1.1553). The Fibo grid is built on the basis of extremums from November 7, 2017, and February 16, 2018. Trading recommendations: Buy deals on EUR/USD pair can be opened with the target at 1.1269 and a stop-loss order under the current bullish divergence low. Sell deals on EUR/USD pair can be opened with the target at 1.1177 if the pair completes the last low divergence. The material has been provided by InstaForex Company - www.instaforex.com |
| Posted: 29 Mar 2019 05:29 AM PDT 4h As seen on the 4-hour chart, the GBP/USD pair resumed the process of falling and closed under the retracement level of 76.4% (1.3094). However, the formation of a bullish divergence in the CCI indicator allows traders to expect a reversal in favor of the pound sterling and some growth of quotations. The close of the pair above the Fibo level of 76.4% will similarly work in favor of the currency of England and the beginning of growth in the direction of the retracement level of 100.0% (1.3300). The passage of the pair of low divergence will increase the chances of a further fall in the direction of the Fibo level of 61.8% (1.2969). The Fibo grid is built on extremes of September 20, 2018, and January 3, 2019. 1h As seen on the hourly chart, the pair made a strong fall, but then followed a reversal in favor of the British pound and a close above the retracement level of 76.4% (1.3061). As a result, on March 29, the growth of the pair may be continued in the direction of the next retracement level of 61.8% (1.3121). There is no indicator of the emerging divergences today. The closing of quotations below the Fibo level of 76.4% will again work in favor of the American currency and the resumption of the fall in the direction of the retracement level of 100.0% (1.2961). The Fibo grid is built on extremes of March 11, 2019, and March 13, 2019. Trading advice: Buy deals on GBP/USD pair can be opened with a target at 1.3121 and a stop-loss order below the level of 76.4%, as the pair completed closing above the level of 1.3061 (hourly chart). Sell deals on GBP/USD pair can be opened with the target at 1.2961 and a stop-loss order above the level of 76.4% if the pair closes below the retracement level of 1.3061 (hourly chart). The material has been provided by InstaForex Company - www.instaforex.com |
| Posted: 29 Mar 2019 04:52 AM PDT The big picture: The market is waiting for the decision of Britain on Brexit. On Friday evening, there will be another decisive vote on Brexit in the British Parliament. This is at least the third decisive vote but at least some should come to an end. Judging by the behavior of the market, the decision on Brexit can induce a strong move on both the pound and euro. In addition, an important inflation report for February will be released in the United States at 12.30 London time. We are ready to sell the euro at a breakout of 1.1175. We are ready to buy the euro at a breakout of 1.1335. |
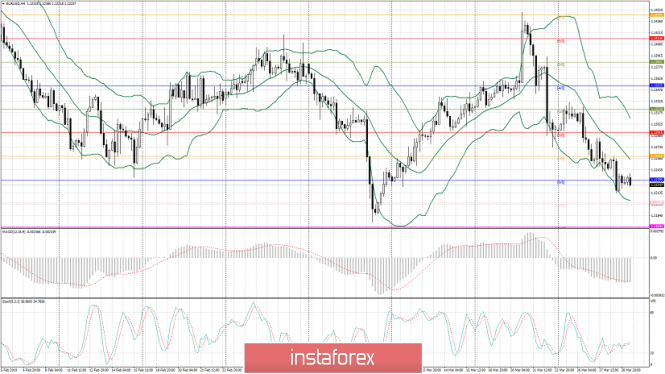
| EUR/USD: technical review 29.03.2019 Posted: 29 Mar 2019 02:55 AM PDT Current dynamic On the 4-hour chart, EURUSD pair is showing a negative dynamic. Now the pair is trying to consolidate below the level of 1.1230 (Murray [0/8]), which is the key level for the sellers in the short-term period. Assuming the pair's ability to cross down 1.1213 mark (3-week low), the levels of 1.1200 (Murray [-1/8])-1.1169 (Murray [-2/8]) can be targeted if holding short positions. There is a high chance of an upward rebound around the area of 1.1169 level, while its breakdown would allow the price fall to the level of 1.1118. Alternatively, pullback above 1.1261 level which coincided with the middle line of Bollinger Bands, could lead EUR/USD to the levels of 1.1291 (Murray [2/8])-1.1322 (Murray [3/8]). Technical indicators reflect the maintenance of the downward potential, but the upward correction is possible in the short term. Bollinger Bands are pointed downwards. Stochastic lines are pointed upwards. MACD histogram is in the negative zone keeping a signal for the opening of sell positions.
Support and resistance: Support levels: 1.1213, 1.1200, 1.1169, 1.1118. Resistance levels: 1.1261, 1.1291, 1.1322, 1.1352. Trading scenarios: Short positions can be opened below the level of 1.1200 with the target at around 1.1169-1.1118 and stop-loss 1.1226. Long positions can be opened above the level of 1.1261 with the target at around 1.1291-1.1322 and stop-loss 1.1240. The material has been provided by InstaForex Company - www.instaforex.com |
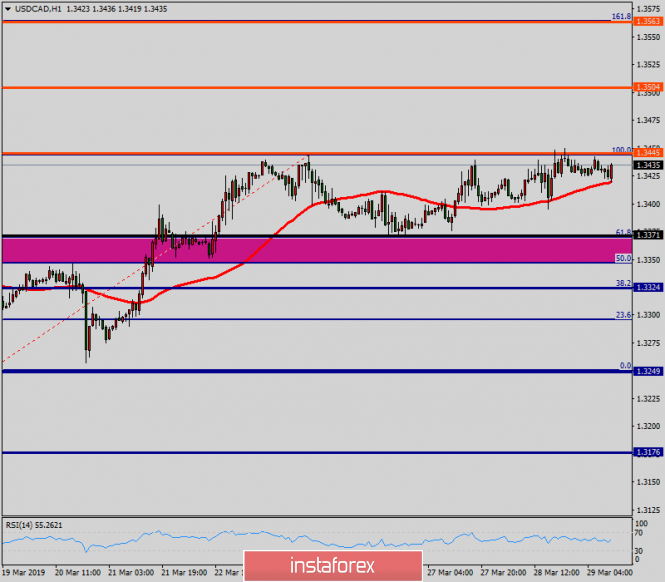
| Technical analysis of USD/CAD for March 29, 2019 Posted: 29 Mar 2019 02:52 AM PDT |
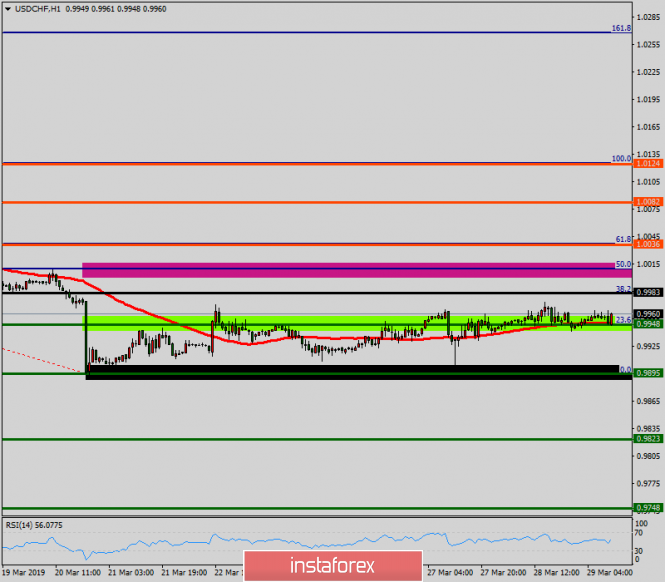
| Technical analysis of USD/CHF for March 29, 2019 Posted: 29 Mar 2019 02:50 AM PDT Overview: The USD/CHF pair continues moving in a bullish trend from the support levels of 0.9895 and 0.9948. Currently, the price is in an upward channel. This is confirmed by the RSI indicator signaling that the pair is still in a bullish trend. As the price is still above the moving average (100), immediate support is seen at 0.9948 coinciding with a golden ratio (23.6% of Fibonacci). |
| AUDJPY consolidates as both economies struggle Posted: 29 Mar 2019 02:48 AM PDT The Australian economy is experiencing a decline in the housing sector, while mixed employment data helped the currency to sustain its gains against EUR. Australia's jobless rate fell to its eight-year low in February, but the employment change showed significant downturn to 4.6k from the previous figure of 38.3k. Currently, RBA is concerned with the fall in housing sector. Bank's Assistant Governor Ellis spoke about the impact it had on other sectors of the economy. However, she stated that such a natural disaster as drought also affected the country's economy. Despite these factors, the Australian economy is doing quite well. Besides, the Bank kept its Cash Rate unchanged at 1.75%. Meanwhile, the household consumption and the income growth were quite volatile. Today's Private Sector Credit report from Australia showed an increase by 0.3%, while it was expected to remain at 0.2%. Such positive data did help the currency to gain certain momentum. However, it was not enough for a bullish trend. On the other hand, the Tokyo Core CPI published today stayed at 1.1% as it was expected, the unemployment rate slid to 2.3%, while experts anticipated it to remain 2.5%, the preliminary industrial production data met the expectations of 1.4% from the previous negative value of -3.4%. The retail sales decreased to 0.4% from the previous value of 0.6%, while it was anticipated to advance to 0.9%. In the meantime, export and import challenges lead to some weakening of Japan's economy, while the Bank of Japan is trying to reach its 2% inflation target. Besides, Japan has to rely on imports for its energy requirements, the core consumer price index is affected as it depends on the oil price. The overall exports of Japan were also influenced by the US-China trade war. As of the current scenario, volatility of this pair is expected to increase. Comparing the overall economic situations in the countries, JPY seems to have a better support from the statistical data and is likely to firm in the coming days. The material has been provided by InstaForex Company - www.instaforex.com |
| Technical analysis of GBP/USD for March 29, 2019 Posted: 29 Mar 2019 02:45 AM PDT Weekly Pivot: 1.3221. The GBP/USD broken resistance at 1.3221 which acts as support this this week. The pair is moving between the levels of 1.3221 and 1.3382. As the trend is still above the 100 EMA, a bullish outlook remains the same as long as the 100 EMA is headed to the upside. Consequently, the level of 1.3221 remains a key resistance zone. Therefore, there is a possibility that the GBP/USD pair will move upwards above 1.3221, which coincides with a ratio 61.8% of Fibonacci retracement. The falling structure does not look corrective. In order to indicate a bearish opportunity above 1.3221, buy above this level with the first target at 1.3382. Moreover, if the pair succeeds to pass through 1.3382, it will move upwards continuing the bullish trend development to 1.3487 in order to test the daily resistance 2. On the other hand, if a breakout happens at 1.3123, this scenario may be invalidated. The material has been provided by InstaForex Company - www.instaforex.com |
| Fundamental analysis of NZD/USD for March 29, 2019 Posted: 29 Mar 2019 02:31 AM PDT USD managed to gain impulsive momentum against NZD recently. The NZD/USD pair is trading inside the resistance area of 0.6900-50. Summarizing the policy update of the Reserve Bank of New Zealand, the board kept the official cash rate steady and expressed the dovish rhetoric. Following the policy statement, NZD lost ground. Despite worse-than-expected GDP report, USD managed to sustain the momentum over NZD. Earlier in March, USD lost favor with investors due to Fed's cautious approach to monetary policy. Recently, several Fed's officials have made comments on interest rates. They share the common viewpoint that the US Federal Reserve is not going to raise interest rate this year and even by 2020. Moerover, analysts assume the scenario of even a rate cut next year. Last week the Fed kept the interest rate unchanged at 2.50%. Earlier in the year, the central bank considered at least 1 rate hikes, but the agenda was revised to no rate hikes in 2019. Such a soft change in Fed's tone took the shine off USD. The regulator explains the decision by a global economic slowdown and political uncertainties like BREXIT and the US - China trade war. On the whole, the Fed confirmed its intention to adopt a patient approach to monetary tightening in the long run. According to Fed's policymakers, the US economy is still on a sound footing. The likelihood of recession in 2019 and 2020 is slim. The US economic growth is easing to more sustainable long-term levels. The US - China trade war is going to affect the US economy. Thus, investors pin hopes on a successful trade deal between the two largest global economies.
Yesterday the US Commerce Department posted revised GDP report. The US economy eased a pace of growth to 2.2% in Q4 2018 from 2.6% in the previous quarter, undershooting the forecast for a 2.4% increase. The downbeat figure undermined USD momentum over NZD but did not lead to any strong counter-move. Today US Personal Spending report is going to be published which is expected to increase to 0.3% from the previous value of -0.5% and Personal Income is also expected to increase to 0.3% from the previous value of -0.1%. Moreover, today FOMC member Quarles is going to speak about future monetary policy decision. His speech will hardly make an impact on USD gains. Meanwhile, USD is expected to sustain momentum over NZD, though the pair is set to trade with corrections and volatility. Though NZD is the weaker currency in the pair, NZD could assert strength versus USD for a while. The material has been provided by InstaForex Company - www.instaforex.com |


| You are subscribed to email updates from Forex analysis review. To stop receiving these emails, you may unsubscribe now. | Email delivery powered by Google |
| Google, 1600 Amphitheatre Parkway, Mountain View, CA 94043, United States | |
No comments:
Post a Comment