
Forex analysis review |
- Fractal analysis of major currency pairs on April 11
- XAU/USD approaching resistance, potential drop!
- NIKKEI approaching resistance, potential drop!
- AUD/USD approaching resistance, potential drop!
- GBP/USD. April 10th. Results of the day. The pound sterling reacted very weakly to GDP in Britain and US inflation
- EUR/USD. April 10th. Results of the day. Mario Draghi's rhetoric was predictable, and US inflation accelerated
- Chinese oil threat: China focuses on shale oil
- Brexit: to leave or stay? After all, I do not want to say goodbye!
- The ECB keeps its policy unchanged amid the global recession
- EUR/USD. US inflation and the ECB could not push the pair out of the range
- April 10, 2019 : GBP/USD Intraday technical analysis and trade recommendations.
- April 10, 2019 : EUR/USD Intraday technical analysis and trade recommendations.
- Elliott wave analysis of GBP/JPY for April 10, 2019
- Elliott wave analysis of EUR/JPY for April 10, 2019
- Bitcoin analysis for April 10, 2019
- EUR./USD analysis for April 10, 2019
- EUR and GBP: the ECB left the policy unchanged, while data on the UK economy temporarily supported the pound
- Analysis of Gold for April 10, 2019
- Technical analysis of USD/CHF for April 10, 2019
- GBP / USD plan for the American session on April 10. The pound rose on GDP data but the potential is limited by the situation
- Technical analysis of AUD/USD for April 10, 2019
- EUR / USD plan for the US session on April 10. ECB left rates unchanged while traders are waiting for speeches by Mario
- Simplified wave analysis of the main currency pairs on April 10
- Trading recommendations for the EURUSD currency pair - placement of trading orders (April 10)
- The Fed will look for new policy instruments at low rates. The results of the ECB meeting will return the pressure on the
| Fractal analysis of major currency pairs on April 11 Posted: 10 Apr 2019 07:18 PM PDT Analytical review of H1-scale currency pairs:
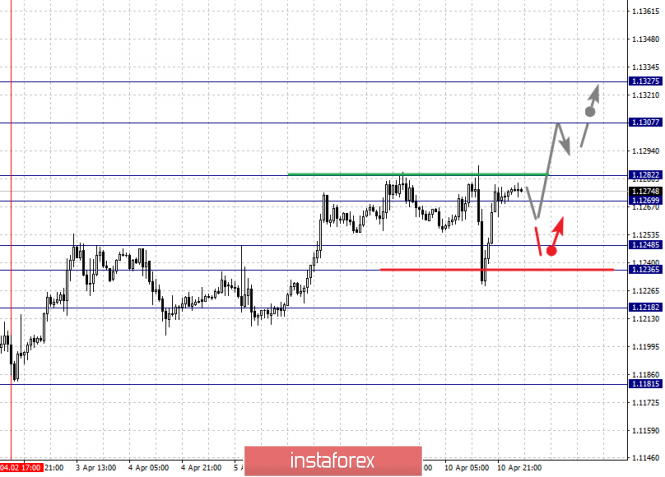
For the euro / dollar pair, the key levels on the H1 scale are: 1.1327, 1.1307, 1.1282, 1.1269, 1.1248, 1.1236 and 1.1218. Here, we continue to monitor the formation of the ascending structure of April 2. Short-term upward movement is expected in the corridor 1.1269 - 1.1282. The breakdown of the latter value will allow us to expect to move to the level 1.1307. For the potential value to the top, we consider the level of 1.1327. After reaching which, we expect a rollback to the bottom. Short-term downward movement is possible in the corridor 1.1248 - 1.1236. Breaking the last value will lead to a prolonged correction. Here, the goal is 1.1218. This level is a key support for the top. The main trend is the ascending structure of April 2. Trading recommendations: Buy 1.1284 Take profit: 1.1305 Buy 1.1309 Take profit: 1.1325 Sell: 1.1248 Take profit: 1.1237 Sell: 1.1234 Take profit: 1.1220
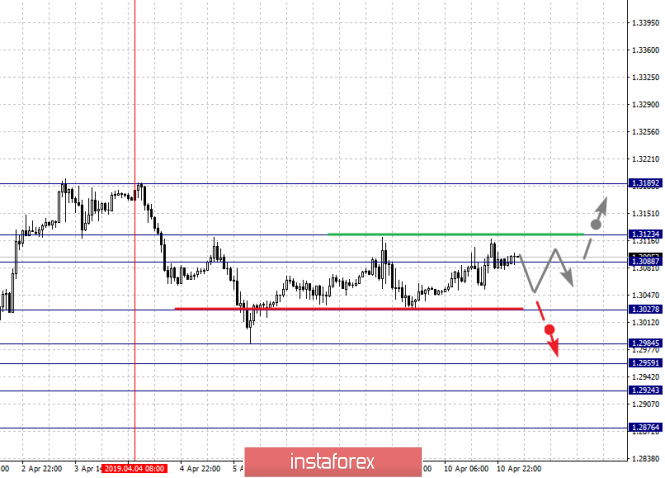
For the pound / dollar pair, the key levels on the H1 scale are: 1.3189, 1.3123, 1.3088, 1.3027, 1.2984, 1.2959, 1.2924 and 1.2876. Here, the price has entered an equilibrium state. Continuation to the bottom is possible after breakdown of 1.3027. In this case, the first target is 1.2984. Short-term downward movement is expected in the corridor 1.2984 - 1.2959. The breakdown of the latter value will lead to the movement to the level of 1.2924. We expect consolidation near this value. For the potential value at the bottom, we consider the level of 1.2876, and from which, we expect the departure of a correction. Short-term upward movement is possible in the corridor 1.3088 - 1.3123. The breakdown of the latter value will have to develop an upward trend. Here, the first potential target is 1.3189. The main trend is the equilibrium situation. Trading recommendations: Buy: 1.3090 Take profit: 1.3120 Buy: 1.3124 Take profit: 1.3187 Sell: 1.3025 Take profit: 1.2987 Sell: 1.2984 Take profit: 1.2960
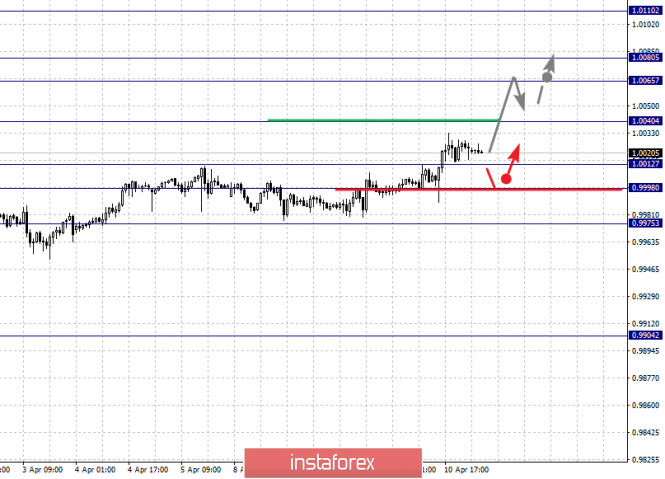
For the dollar / franc pair, the key levels on the H1 scale are: 1.0110, 1.0080, 1.0065, 1.0040, 1.0012, 0.9998 and 0.9975. Here, we continue to follow the development of the ascending cycle of March 27. Continuation of the movement to the top is expected after the breakdown 1.0040. In this case, the goal is 1.0065. Short-term upward movement is in the corridor 1.0065 - 1.0080, as well as consolidation. We consider the level of 1.0110 as a potential value to the top. Upon reaching this level, we expect a rollback to the bottom. Short-term downward movement is possible in the corridor 1.0012 - 0.9998. The breakdown of the last value will lead to a prolonged correction. Here, the target is 0.9975. This level is a key support for the top. The main trend - the rising structure of March 27. Trading recommendations: Buy: 1.0040 Take profit: 1.0065 Buy: 1.0066 Take profit: 1.0080 Sell: 1.0012 Take profit: 0.9998 Sell: 0.9996 Take profit: 0.9975
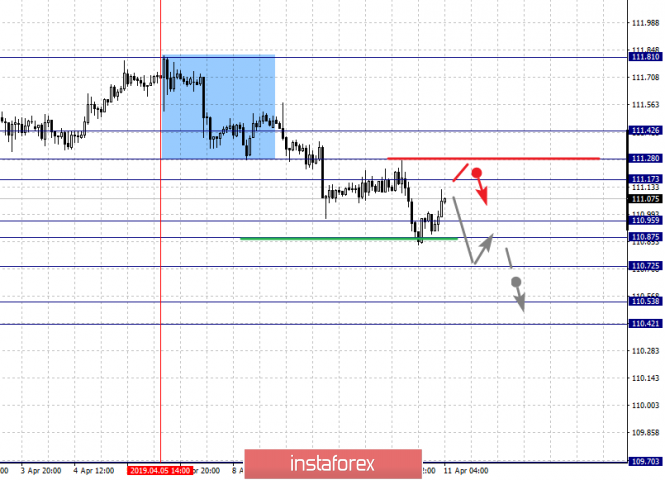
For the dollar / yen pair, the key levels on the H1 scale are : 111.42, 111.28, 111.17, 110.95, 110.87, 110.72, 110.53 and 110.42. Here, we are following the development of the downward structure from April 5th. Continuation of the movement to the bottom is expected after the price passes the noise range 110.95 - 110.87. In this case, the goal is 110.72. Price consolidation is shown near this level. For the potential value at the bottom, we consider the level of 110.42. After reaching which, we expect a consolidated movement in the corridor 110.42 - 110.53, as well as a rollback to the correction. Short-term upward movement is possible in the corridor 111.17 - 111.28. The breakdown of the latter value will lead to a prolonged correction. Here, the goal is 111.42. This level is a key support for the downward structure. The main trend: the downward structure of April 5. Trading recommendations: Buy: 111.17 Take profit: 111.28 Buy: 111.30 Take profit: 111.40 Sell: 110.87 Take profit: 110.74 Sell: 110.70 Take profit: 110.55
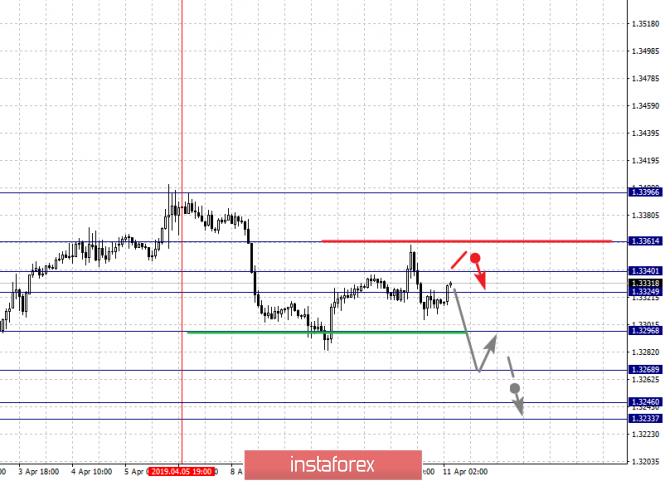
For the Canadian dollar / dollar pair, the key levels on the H1 scale are: 1.3361, 1.3340, 1.3324, 1.3296, 1.3268, 1.3246 and 1.3233. Here, we are following the formation of the downward structure of April 5. At the moment, the price is in the zone of initial conditions. Continuation of the movement to the bottom is expected after the breakdown of 1.3296. In this case, the goal is 1.3268. Consolidation is near this level. For a potential value at the bottom, we consider the level of 1.3233. After reaching which, we expect consolidation in the corridor 1.3246 - 1.3233, as well as a departure to the correction. Consolidated movement is possible in the range of 1.3324 - 1.3340. The breakdown of the latter value will lead to the development of a prolonged correction. Here, the target is 1.3360. This level is a key support for the downward structure. The main trend - the formation of the downward potential of April 5. Trading recommendations: Buy: 1.3342 Take profit: 1.3360 Buy: 1.3363 Take profit: 1.3394 Sell: 1.3294 Take profit: 1.3268 Sell: 1.3266 Take profit: 1.3246
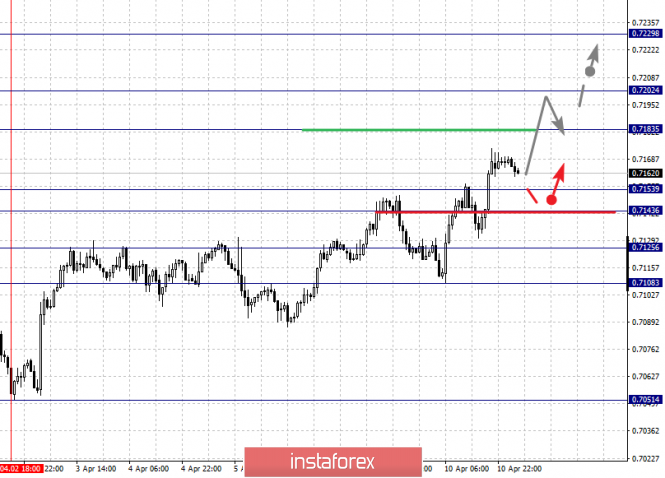
For the Australian dollar / dollar key a levels on the H1 scale are : 0.7229, 0.7202, 0.7183, 0.7153, 0.7143, 0.7125 and 0.7108. Here, we continue to follow the development of the ascending structure from April 2. Continuation of the movement to the top is expected after the breakdown 0.7183. In this case, the goal is 0.7202. Consolidation is near this level. The breakdown of the level of 0.7202 will lead to the movement to the potential target - 0.7229, upon reaching this value, we expect to go into a correction. Short-term downward movement is possible in the range of 0.7153 - 0.7143. The breakdown of the latter value will lead to a prolonged correction. Here, the target is 0.7125. This level is a key support to the top. Its breakdown will have to form the initial conditions for the downward cycle. In this case, the target is 0.7108. The main trend is the ascending cycle of April 2. Trading recommendations: Buy: 0.7183 Take profit: 0.7200 Buy: 0.7204 Take profit: 0.7225 Sell: 0.7153 Take profit: 0.7144 Sell: 0.7141 Take profit: 0.7127
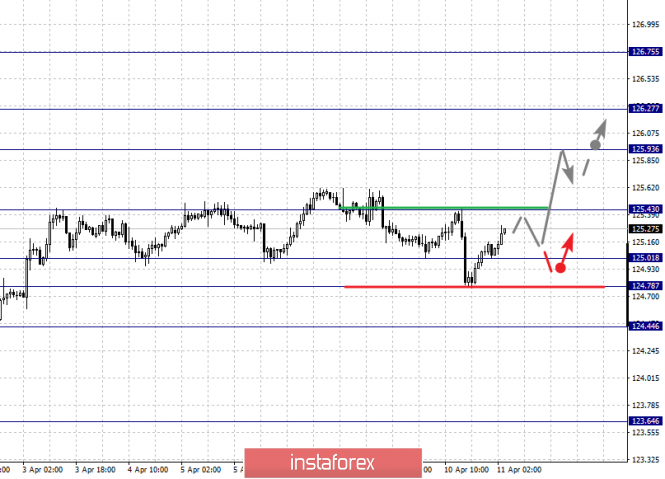
For the euro / yen pair, the key levels on the H1 scale are: 126.75, 126.27, 125.93, 125.43, 125.01, 124.78 and 124.44. Here, we are following the development of the March 28 upward cycle. For the continuation of the movement to the top, we expect 125.45 after the breakdown. In this case, the target is 125.93. Short-term upward movement is in the corridor 125.93 - 126.27, as well as consolidation. For the potential value for the top, we consider the level of 126.75. After reaching which, we expect a rollback to the bottom. Short-term downward movement is possible in the corridor 125.01 - 124.78. The breakdown of the latter value will lead to a prolonged correction. In this case, the target is 124.44. This level is a key support for the top. The main trend is the upward cycle of March 28, the stage of correction. Trading recommendations: Buy: 125.45 Take profit: 125.90 Buy: 125.95 Take profit: 126.20 Sell: 125.00 Take profit: 124.80 Sell: 124.75 Take profit: 124.50
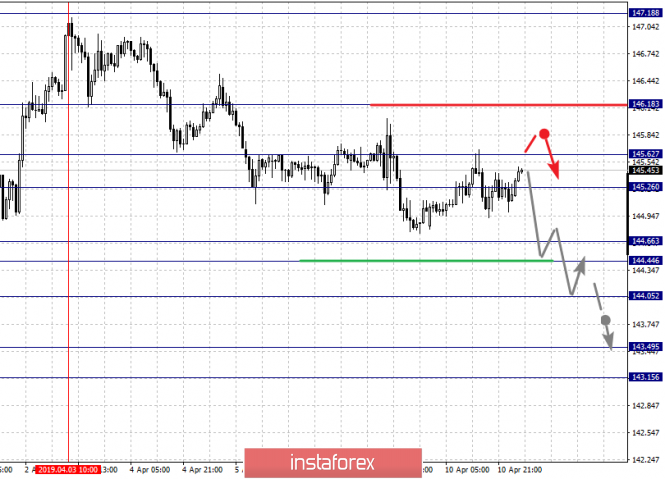
For the pound / yen pair, the key levels on the H1 scale are : 146.18, 145.62, 145.26, 144.66, 144.44, 144.05, 143.49 and 143.15. Here, we are following the development of the downward cycle of April 3. Continuation of the movement to the bottom is expected after the price passes the noise range 144.66 - 144.44. In this case, the goal is 144.05. Consolidation is near this level. Breakdown of 144.05 should be accompanied by a pronounced downward movement to the level of 143.49. For the potential value at the bottom, we consider the level of 143.15. After reaching which, we expect consolidation, as well as rollback to the top. Short-term upward movement is possible in the corridor 145.26 - 145.62. The breakdown of the latter value will lead to a prolonged correction. Here, the target is 146.18. This level, is a key support for the top. The main trend is the downward cycle of April 3rd. Trading recommendations: Buy: 145.26 Take profit: 145.60 Buy: 145.70 Take profit: 146.15 Sell: 144.44 Take profit: 144.10 Sell: 144.00 Take profit: 143.55 The material has been provided by InstaForex Company - www.instaforex.com |
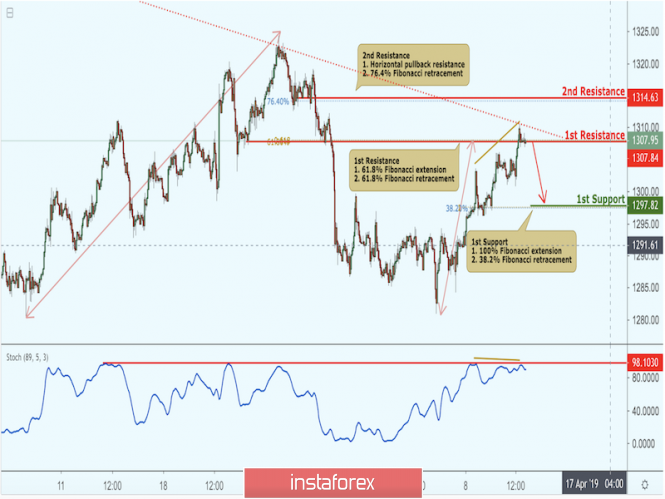
| XAU/USD approaching resistance, potential drop! Posted: 10 Apr 2019 06:48 PM PDT XAUUSD is approaching our first resistance at 1307.84 (61.8% Fibonacci retracement , 61.8% Fibonacci extension ) where a strong drop might occur below this level pushing price down to our major support at 1297.82 (38.2% Fibonacci retracement , 100% Fibonacci extension ). Stochastic (89,5,3) is also approaching resistance and seeing a bearish divergence where we might see a corresponding drop in price. Trading CFDs on margin carries high risk. Losses can exceed the initial investment so please ensure you fully understand the risks.
|
| NIKKEI approaching resistance, potential drop! Posted: 10 Apr 2019 06:46 PM PDT Nikkei is approaching our first resistance at 22320.0 (61.8% Fibonacci retracement , 61.8% Fibonacci extension , horizontal overlap resistance where a strong drop might occur below this level pushing price down to our major support at 20303.4 (61.8% Fibonacci retracement , Horizontal swing low support) Stochastic is also approaching resistance where we might see a corresponding drop in price. Trading CFDs on margin carries high risk. Losses can exceed the initial investment so please ensure you fully understand the risks. 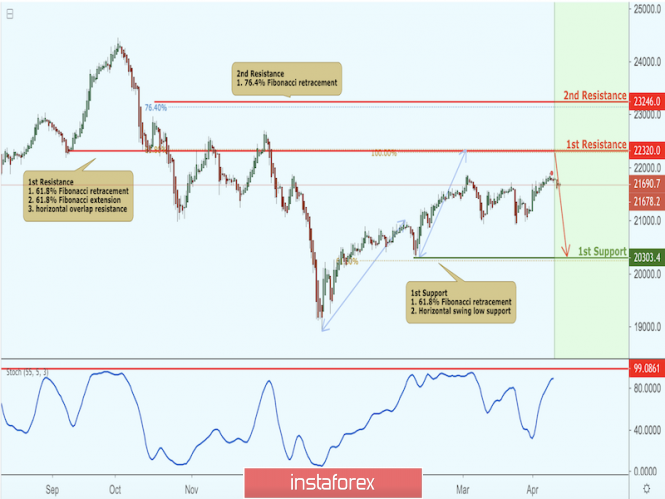 |
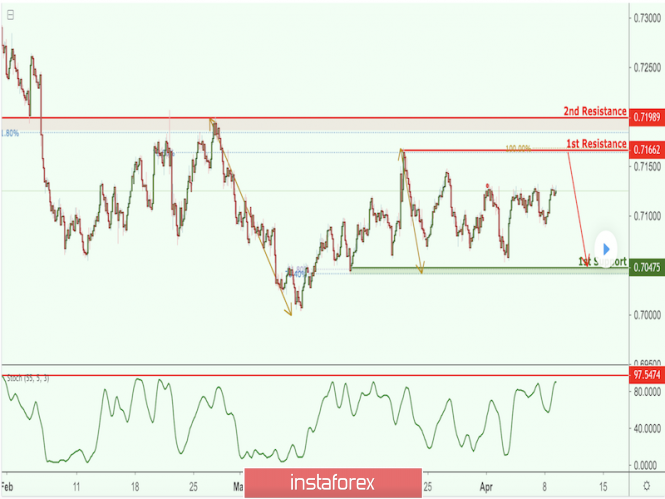
| AUD/USD approaching resistance, potential drop! Posted: 10 Apr 2019 06:44 PM PDT AUDUSD is approaching our resistance at 0.7166 (horizontal swing high resistance, 78.6% Fibonacci retracement , 100% Fibonacci extension ) where a strong drop might occur below this level pushing price down to our major support at 0.7047 (61.8% Fibonacci retracement , horizontal swing low support, 76.4% Fibonacci retracement ). Stochastic (55,5,3) is also approaching resistance where we might see a corresponding drop in price. Trading CFDs on margin carries high risk. Losses can exceed the initial investment so please ensure you fully understand the risks.
|
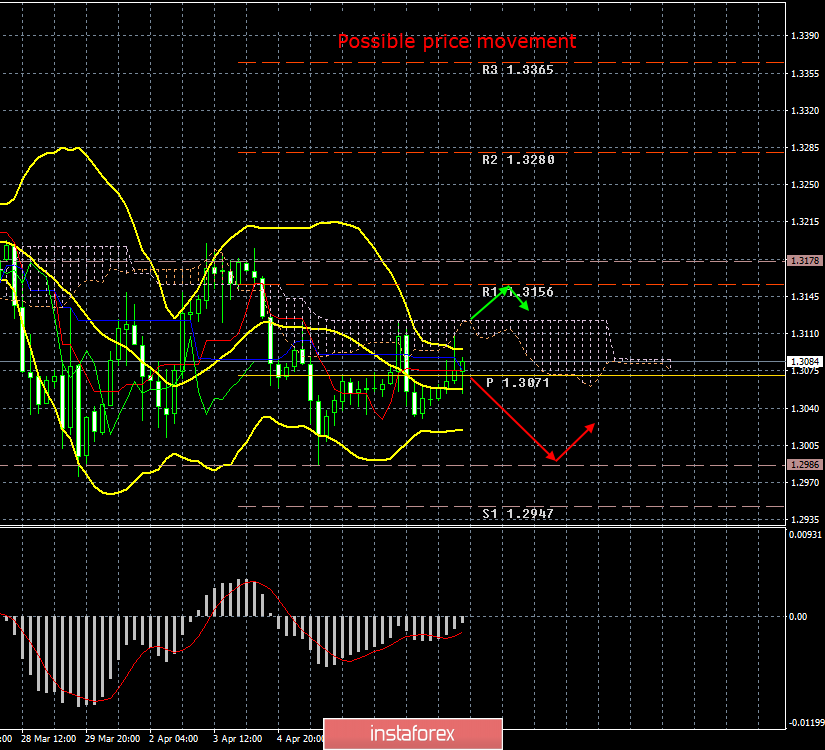
| Posted: 10 Apr 2019 04:48 PM PDT 4-hour timeframe The amplitude of the last 5 days (high-low): 75p - 131p - 135p - 49p - 91p. Average amplitude for the last 5 days: 96p (105p). On Wednesday, April 10, the British pound sterling is trading in a narrow price range with a low upward slope. The pair did not have a significant reaction on the report on inflation in the United States, as well as on the UK GDP and industrial production. We can only talk about the minimal support of the British pound, due to the high relative GDP value of forecasts (+0.2% according to the Office of National Statistics and +0.4% according to the NIESR version) and the high growth of industrial production in March. Thus, traders seem to be much more focused on the results of the EU summit, within which a decision should be made regarding Brexit's postponement. Since there is a low probability of an option under which the UK will not be provided with a delay, everyone is interested in the time by which the UK's exit date from the EU will be moved. It cannot be said that the announcement of this verdict will have a strong impact on the pair, since, by and large, this delay does not provide anything except time. During this time, a decision must be made on what scenario London will come out of Brussels' jurisdiction and on what terms. Taking into account all previous Parliamentary votes on this issue, it can be concluded that the government itself does not know which option will be the best. There is no unity in Parliament regarding this issue. Thus, it cannot be said that a delay is a positive factor for the pound. This is just extra time. The minutes of the Fed meeting are also unlikely to greatly affect the pair's movement, unless a fundamentally new information on monetary policy is announced within its framework. Trading recommendations: The GBP/USD currency pair is trying to resume a downward trend, but has again adjusted. The expected surge in volatility has not yet occurred, and the MACD indicator is directed upward. Thus, shorts with the target of 1.2986 can be opened if the pair rebounds from a critical line. It is recommended to open buy orders if the bulls manage to return the pair above the critical line and the Senkou span B line, with targets of 1,3156 and 1,3178. In addition to the technical picture should also take into account the fundamental data and the time of their release. Explanation of illustration: Ichimoku Indicator: Tenkan-sen – red line. Kijun-sen – blue line. Senkou span a – light brown dotted line. Senkou span B – light purple dotted line. Chikou span – green line. Bollinger Bands Indicator: 3 yellow lines. MACD: A red line and a histogram with white bars in the indicator window. The material has been provided by InstaForex Company - www.instaforex.com |
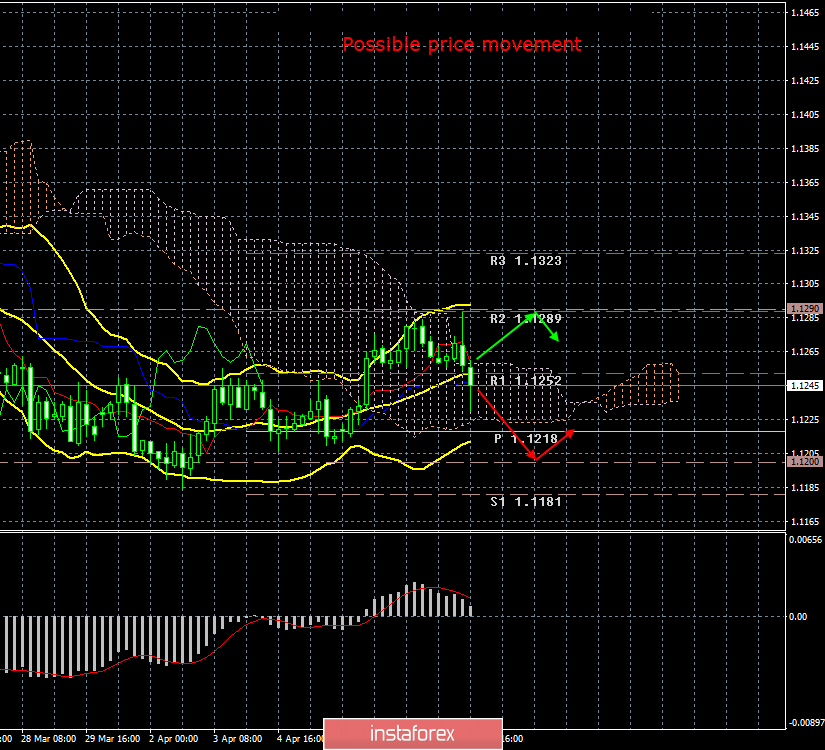
| Posted: 10 Apr 2019 04:34 PM PDT 4-hour timeframe The amplitude of the last 5 days (high-low): 55p - 42p - 38p - 62p - 29p. Average amplitude for the last 5 days: 45p (46p). The EUR/USD currency pair began to decline following the results of the ECB meeting and Mario Draghi's speech. As expected, monetary policy remained unchanged, and the ECB head's speech was extremely restrained. For example, not a word was said about the LTRO program. However, Draghi still reported that downside risks to the economy will persist, although some negative factors have weakened their influence. The period of low interest rates will remain at least until the end of 2019, and the proceeds from the redeemed bonds purchased under QE will be reinvested. Regarding inflation, Draghi said that in the near future it could slow down even more. Now the markets are waiting for the minutes of the last Fed meeting, which will be released in the evening, although it is unlikely that there will be radically new information on monetary policy. In the United States, the report on inflation has already come out, which, quite expectedly, turned out to be better than the forecast values. US inflation in March amounted to 1.9% y/y, while in monthly terms it accelerated to 0.4%. This is also a factor that will play into the hands of the US currency. However, we also note the fact that the euro's decline and the dollar's rise after all this news cannot be called strong or even significant. Thus, it seems that, despite the information, which is interpreted unequivocally in favor of the US dollar, market participants are still afraid to sell the pair at such low price values. This means that the level of 1.1200 still holds back the European currency from new falls. Trading recommendations: The EUR/USD pair has started to adjust against the weak uptrend. Thus, orders for buying small lots with a target of 1.1289 are now relevant, but after the completion of the current round of correction. Sell positions are also recommended to be considered in very small lots with a target of 1.1181, if the pair consolidates below the Kijun-Sen line. We remind you that the support level of 1.1200 is very strong and the tool may not fall below it. In addition to the technical picture, one should also take into account the fundamental data and the time of their release. Explanation of illustration: Ichimoku Indicator: Tenkan-sen – red line. Kijun-sen – blue line. Senkou span a – light brown dotted line. Senkou span B – light purple dotted line. Chikou span – green line. Bollinger Bands Indicator: 3 yellow lines. MACD: A red line and a histogram with white bars in the indicator window. The material has been provided by InstaForex Company - www.instaforex.com |
| Chinese oil threat: China focuses on shale oil Posted: 10 Apr 2019 04:04 PM PDT According to experts, the efforts of the Chinese authorities to further develop the vast shale deposits in the country could lead to a significant drop in oil prices on the world market. Royal Dutch Shell has found its niche in the Chinese shale oil sector by signing an agreement with the state-owned company Sinopec to explore fields in East China. At the moment, China is at the initial stage of developing its large-scale shale gas deposits. Last year, gas production amounted to only 6% of the total gas production. The production of shale oil in China is almost at a zero stage due to the complex geology and huge development costs, experts emphasize. According to Angus Roger, director of research at Wood Mackenzie in the Asia-Pacific region, after many years of development, shale oil accounts for less than 1% of the PRC oil production. According to the representative of the Ministry of Natural Resources of China (MNR), Chinese shale oil has too low permeability, because of which the production volumes are low. As a result, economic efficiency decreases, experts emphasize. Recall that at the end of February 2019 it became known that huge reserves of shale oil were discovered in China in the municipality of Tianjin. According to experts, thanks to these reserves, this can enhance the energy security and economic development of the country. According to estimates by the EIA energy agency under the US Department of Energy, China ranks third in the world in terms of recoverable shale oil reserves, behind Russia and America. According to analysts, the lion's share of China's shale oil is located in the eastern regions of the country, such as the Sunliao and Bohai Rome basins. Experts say that the North China basins of Ordos and Junggar also have large reserves of black gold. In 2013, the American energy company Hess Corp. entered into an agreement on the sharing of raw materials with PetroChina, a division of the Chinese national oil and gas corporation CNPC. This was the first deal the Chinese authorities aimed at developing shale oil deposits. The strategy of the Chinese government, led by leader, Xi Jinping, is to maximize the national oil and gas production. However, this task is rather complicated due to the aging of deposits, and the expansion of production volumes on them becomes expensive. According to experts of the major bank Morgan Stanley, at the moment, the discovery of shale deposits in western China can lead to unpredictable consequences, such as provoking a shale revolution in the country. Experts draw attention to the impressive commercial potential of the newly discovered Dzhimsar field, which in March of this year produced a record amount of oil - 100 tons. According to analysts, the shale boom in China could have an impact on the American shale revolution. However, this impact will not be too significant. Morgan Stanley expects that by 2025 shale oil production in China will reach 100-200 thousand barrels per day. According to experts, this is a very small amount compared to the millions of barrels extracted in the US daily. In the long term, China can significantly reduce its dependence on imports of hydrocarbons, analysts emphasize. However, if such a scenario is implemented, this will negatively affect the export volumes from foreign suppliers. The material has been provided by InstaForex Company - www.instaforex.com |
| Brexit: to leave or stay? After all, I do not want to say goodbye! Posted: 10 Apr 2019 04:04 PM PDT Only a few days remain until the current Brexit date, and this becomes an exciting moment for traders of the pound sterling. The issue of extending the term of Article 50 of the Lisbon Treaty is currently on the agenda. British Prime Minister Theresa May insists on a short respite for Brexit, and the EU for a long delay. If Brussels does not satisfy London's request, then the United Kingdom will withdraw from the bloc without a deal this Friday. "I believe that Brexit should be postponed to a later date. One of the possible options is an extension with an open date for a period of not more than one year," said European Council President Donald Tusk. According to him, the "flexible" term will allow the UK to freely leave when it is ready, and the European Union will be able to avoid repeated Brexit summits. An emergency meeting of European leaders will take place in Brussels today, where a final decision on the terms of the "divorce" will be made. It is assumed that if the EU and London agree to extend Brexit, then further developments will depend on the United Kingdom. Currently, the British government is trying to negotiate with the opposition regarding the question of ratifying the "divorce" agreement. If they succeed, the document will go to the House of Commons for consideration. However, if negotiations between representatives of the Conservative and Labour parties fail, then the British Parliament will have to choose between possible Brexit options, including a repeated referendum and refusal to leave the EU. "It is not in the interests of Brussels and London to allow the implementation of the "hard" scenario. First, this option will lead to undesirable difficulties for European companies, especially given the fact that the deteriorating conditions in the world do not bode well for the eurozone economy. Of course, the United Kingdom will suffer more serious damage in this case. However, this is an unnecessary risk for the EU, while it, without much success, is trying to resolve trade issues with the United States. Secondly, Ireland will suffer the most - both politically and economically - from a disordered Brexit compared to all of the other EU countries. The issue of the Irish border has been discussed for two years, and EU leaders have promised to support Dublin. "Hard" Brexit will become a mockery of these promises. Thirdly, it is necessary to take into account the possible political consequences of a hasty and indiscriminate exit of Great Britain from the EU. Much of the blame will undoubtedly lie on London. But a failure in a process designed to demonstrate professionalism, political maturity and unity of the EU will not benefit anyone except the European skeptics, right-wing nationalists and populists who hope to succeed in the elections to the European Parliament next month," according to a report from The Financial Times. It is expected that, if the EU still maintains its position, and the Brexit delay is long, then the GBP/USD pair will begin a vigorous growth on expectations that the UK's withdrawal from the EU may not occur at all. If European leaders choose to comply with T. May's request and provide the UK with another short delay, the British currency may also strengthen against the US dollar in response. However, uncertainty will remain, which will limit the pound sterling's growth. In case a "hard" scenario is implemented, if at least one EU member says "no" to the postponement, the GBP/USD pair will enter a free fall mode. According to the most pessimistic estimates, the pound sterling may fall to its lowest level in 30 years in the region below 1.15. The material has been provided by InstaForex Company - www.instaforex.com |
| The ECB keeps its policy unchanged amid the global recession Posted: 10 Apr 2019 04:02 PM PDT The ECB policy remains unchanged. The regulator will continue to pursue an ultra-light monetary policy, providing recent stimulus measures with an opportunity to gain a foothold in the economy and counteract the spread of the global recession. The head of the ECB, Mario Draghi, confirmed his willingness to continue implementing measures to mitigate the impact on banks, including negative deposit rates, as well as new low-cost loans for banks, but he did not set deadlines. "We need additional information that will come to us in the period until June," said Draghi. The ECB has abandoned plans for tightening policies because the main reasons for the recession in the region — weak demand from abroad and political uncertainty — are largely beyond its influence. During the press conference, Draghi almost did not announce any further planned stimulus measures, but he emphasized the additional risks associated with the tension in world trade, and said that the expected probability of a recession remains low. For its part, the ECB has already taken emergency measures and has promised to keep interest rates at a record low for at least this year. The ECB rate remains at -0.40 percent, while the main refinancing rate is 0.00 percent. The material has been provided by InstaForex Company - www.instaforex.com |
| EUR/USD. US inflation and the ECB could not push the pair out of the range Posted: 10 Apr 2019 04:02 PM PDT Today, the euro-dollar pair could not break through the flat range, although the price fluctuations were quite wide. Having risen to the level of 1.1290, in a few minutes, the price literally fell to the bottom of the 12th figure. But the downward impulse quickly faded away, after which the pair returned to the usual "autopilot" mode. Coincidentally, today, Mario Draghi's press conference began almost simultaneously with the release of data on the growth of US inflation. Such a layering of the most important fundamental factors happens infrequently, so traders were somewhat puzzled: this was indicated by abrupt price movements. Initially, the EUR/USD reaction was in favor of the euro. Ambiguous figures of US inflation put pressure on the dollar, after which the pair updated its daily high. On the one hand, the consumer price index showed a positive trend - both in annual and monthly terms. The indicators exceeded the forecasted levels and reached 0.4% (m/m) and 1.9% (g/g). On the other hand, core inflation disappointed. The core index excluding prices for food and energy fell more than expected. On an annualized basis, the indicator showed the weakest growth since February last year, rising by only two percent. In monthly terms, the index came out at the level of the previous month (0.1%), although experts predicted a more substantial growth. The slowdown in core inflation is an alarming sign, especially against the background of a slowdown in wage growth. Let me remind you that the inflation component of nonfarm also disappointed the market, being in the "red zone". Now the negative picture was supplemented with today's release. However, the price surge did not last long - a few minutes after the release of US data, the market switched to Mario Draghi's rhetoric. The head of the ECB again voiced a soft rhetoric, confirming the "dovish" stance of the European regulator. First, he stated the slowdown in eurozone growth in general and inflation in particular. According to him, inflation indicators will decline for a few more months and hit their lowest in approximately early autumn. Secondly, Draghi again remembered the protectionism of Donald Trump - in his words, the White House policy "undermines the overall level of trust." We are talking about recent claims from Washington: according to the US, some European countries (namely, France, Italy, Spain and Germany) illegally subsidize the European aircraft manufacturer Airbus, causing the US state an annual damage worth $11 billion. In response, the United States introduced additional duties that will be imposed on helicopters, motorcycles, airplanes, food and alcohol products from the above-mentioned European countries. Although Mario Draghi did not mention this particular trade conflict, the hint was very transparent. The head of the ECB also referred Brexit among other potential risks. He stressed that at the moment it is not clear when and under what conditions Britain will leave the European Union, and this factor, in turn, reduces the level of business confidence and affects the investment climate. By and large, Mario Draghi did not say anything new today: he only structured those theses that he had previously voiced in various forums, conferences and other relevant events. Therefore, the market was not shocked or too surprised by his "dovish" rhetoric. Moreover, the head of the ECB tried to demonstrate a certain optimism - for example, he said that the negative impact of "certain internal factors" on the eurozone economy is starting to weaken. He did not specify what factors exactly were being discussed, but he said that inflation in Europe should "come to life" in the second half of the year. However, Draghi could not sweeten the pill - the overall impression from the ECB meeting remained negative. But in my opinion, the European currency has passed its position for another reason. Let me remind you that there were rumors being spread among traders that the ECB may consider introducing a differential rate on deposits. But Draghi denied these rumors, saying that this issue requires further analysis and, in general, it is "too early" to talk about it. Also, the head of the ECB did not talk about the conditions of the new round of TLTRO. He made it clear that this topic is still under discussion, and much will depend on the further dynamics of key macroeconomic indicators in the eurozone. Therefore, the April meeting of the ECB and the release of data on the growth of US inflation could not "push out" the EUR/USD pair from the range of 1.1160-1.1280, despite significant price fluctuations. At the end of the day, the price remained almost at the same level as at the opening. This means that now the market will focus on global fundamental factors - first of all, we are talking about the prospects of Brexit and the trade war between the United States and China. The material has been provided by InstaForex Company - www.instaforex.com |
| April 10, 2019 : GBP/USD Intraday technical analysis and trade recommendations. Posted: 10 Apr 2019 09:58 AM PDT
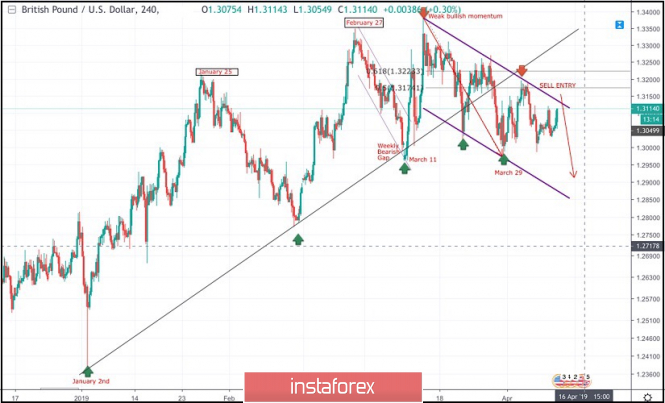
On January 2nd, the market initiated the depicted uptrend line around 1.2380. This uptrend managed to initiate two successive bullish waves towards 1.3200 (Jan. 25) then 1.3350 (Feb. 27) before the bearish pullback brought the GBPUSD pair towards the uptrend on March 8th. A weekly bearish gap pushed the pair below the uptrend line (almost reaching 1.2960) before the bullish breakout above short-term bearish channel was achieved on March 11. Shortly after, the GBPUSD pair demonstrated weak bullish momentum towards 1.3200 then 1.3360 where the GBPUSD failed to achieve a higher high above the previous top achieved on February 27. Instead, the depicted bearish channel was established. Significant bearish pressure was demonstrated towards 1.3150 - 1.3120 where the depicted uptrend line failed to provide any bullish support leading to obvious bearish breakdown. On March 29, the price levels of 1.2980 (the lower limit of the depicted movement channel) demonstrated significant bullish rejection. This brought the GBPUSD pair again towards the price zone of (1.3160-1.3180) where the upper limit of the depicted bearish channel as well as the backside of the depicted uptrend line were located. Bearish rejection was anticipated around these price levels (1.3160-1.3180). Further bearish decline is expected towards 1.2950-1.2920 where the lower limit of the depicted channel is located. Trade Recommendations: Any bullish pullback towards 1.3160 should be considered for another SELL entry. TP levels to be located around 1.3020 then 1.2950 - 1.2920. S/L to be located above 1.3200 The material has been provided by InstaForex Company - www.instaforex.com |
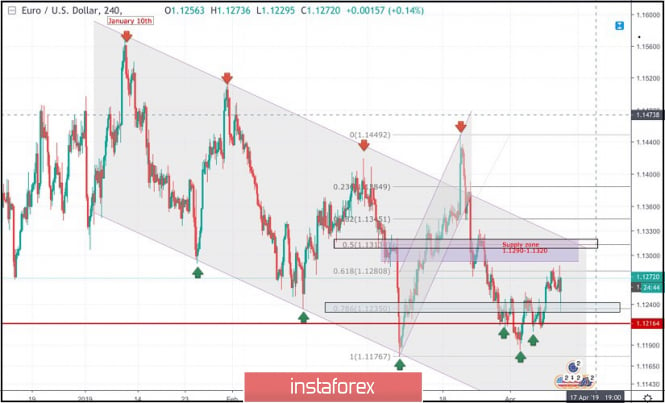
| April 10, 2019 : EUR/USD Intraday technical analysis and trade recommendations. Posted: 10 Apr 2019 09:44 AM PDT
On January 10th, the market initiated the depicted bearish channel around 1.1570. The bearish channel's upper limit managed to push price towards 1.1290 then 1.1235 before the EUR/USD pair could come again to meet the channel's upper limit around 1.1420. Shortly after, the recent bearish movement was demonstrated towards 1.1175 (channel's lower limit) where significant bullish recovery was demonstrated on March 7th. Bullish persistence above 1.1270 enhanced further bullish advancement towards 1.1290-1.1315 (the Highlighted-Zone) which failed to provide adequate bearish pressure. On March 18, a significant bullish attempt was executed above 1.1380 (the upper limit of the Highlighted-channel) demonstrating a false/temporary bullish breakout. On March 22, significant bearish pressure was demonstrated towards 1.1280 then 1.1220. By the end of last week, a bullish Head and Shoulders reversal pattern was demonstrated around 1.1200. This will probably enhance further bullish advancement towards 1.1300-1.1315 where a low-risk SELL entry can be offered. For Intraday traders, the price zone around 1.1235 now stands as a significant demand-zone to be watched for BUY entries if any bearish pullback occurs. Short-term outlook remains bullish towards 1.1300 - 1.1320unless bearish breakdown below 1.1250 is achieved on H4 chart. Trade recommendations : Conservative traders were suggested to have a valid BUY entry around 1.1235. This positions is already running in profits. TP levels to be located around 1.1280, 1.1320. SL to be located below 1.1200. The material has been provided by InstaForex Company - www.instaforex.com |
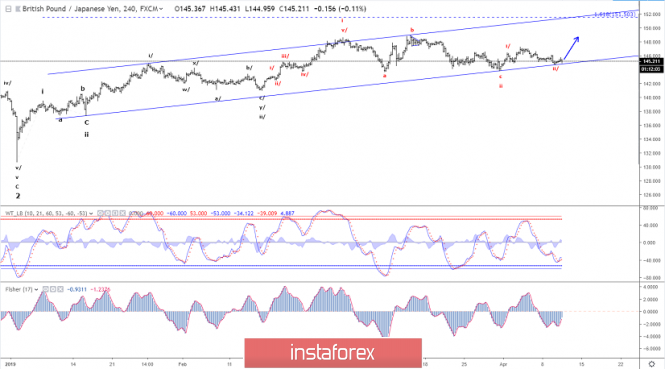
| Elliott wave analysis of GBP/JPY for April 10, 2019 Posted: 10 Apr 2019 08:58 AM PDT
We continue to look for a break above minor resistance at 145.77 and more importantly a break above resistance at 146.00 that confirms more upside pressure towards 148.50 on the way towards 151.50. To shift the bias towards the downside a break below 144.90 is needed. Such a break will call for a decline to 143.79 and ultimately closer to 141.00 before the correction from 148.50 completes. R3: 146.50 R2: 146.00 R1: 145.77 Pivot: 145.42 S1: 145.15 S2: 144.90 S3: 144.62 The material has been provided by InstaForex Company - www.instaforex.com |
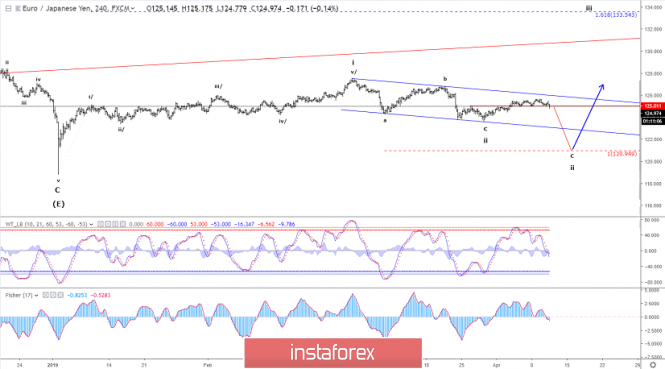
| Elliott wave analysis of EUR/JPY for April 10, 2019 Posted: 10 Apr 2019 08:54 AM PDT
EUR/JPY is finally breaking out of the narrow trading-rang and as we suspected, it breaks to the downside. A clear break below support at 124.94 will confirm a continuation lower to 123.65 and ultimately we will be looking for a decline to 120.95. Only an unexpected break back above 125.45 will shift the bias towards the upside and a rally towards 127.50 and above. R3: 126.18 R2: 125.75 R1: 125.45 Pivot: 125.10 S1: 124.94 S2: 124.17 S3: 123.65 Trading recommendation: We are short EUR from 124.25 and we will move our stop lower to 125.50 The material has been provided by InstaForex Company - www.instaforex.com |
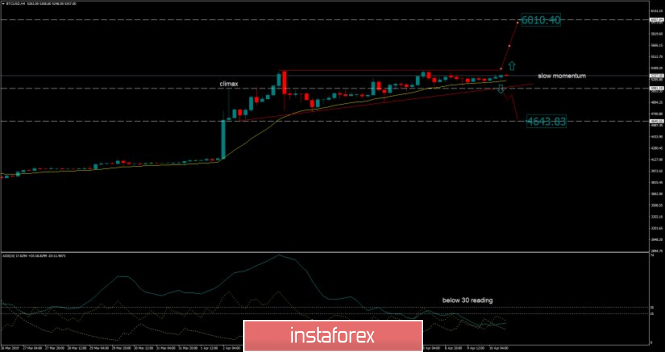
| Bitcoin analysis for April 10, 2019 Posted: 10 Apr 2019 06:32 AM PDT BTC has been trading continues to trade sideways at the price of $5.260 and with very slow momentum. BTC is in indecision zone and we would need further confirmation before the next direction.
Our analysis from yesterday is still active. According to the H1 time-frame, we found that ADX reading is below 30 and, which is sign that short-term trend is weak and sideways price action is present. We found potential for ascending triangle in creation but the price would need to break the resistance at $5.326 and then successfully test it before we start to buy again. If the resistance at the price of $5.326 holds, sell off will be possible. The breakout of the support at $5.000 may confirm downward scenario and potential test of $4.636. Trading recommendation: We are neutral but we are closely observing potential breakout of the support or resistance to confirm further direction. The material has been provided by InstaForex Company - www.instaforex.com |
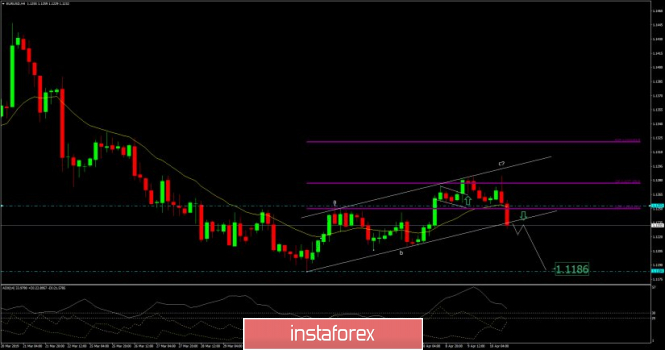
| EUR./USD analysis for April 10, 2019 Posted: 10 Apr 2019 06:24 AM PDT EUR/USD has been trading sideways at the price of 1.1257. The 2-day trend got broken and the trend shifted from bullish to bearish. We see EUR/USD lower in the next few days.
According to the H4 time-frame, we found that potential bearish flag is completed (ABC zig-zag bullish correction) and 20day downward trend may resume. The key resistance level is seen at the price of 1.1285. Support levels are seen at the price of 1.1205 and 1. 1185. Trading recommendation: We sold EUR from 1.1235 with target at 1.1185. Protective stop is placed above the 1.1285. The material has been provided by InstaForex Company - www.instaforex.com |
| Posted: 10 Apr 2019 06:05 AM PDT The European currency has ignored the ECB's decision to leave rates unchanged and even slightly strengthened in pair with the US dollar, but much will envy of what ECB President Mario Draghi will talk about during his speech. According to the data, today the European Central Bank has left the refinancing rate unchanged at the level of 0.0%. The deposit rate was also kept at the same negative level of -0.40%. The regulator said that the rates will remain at current levels at least until the end of 2019, while many experts expected a change in the rate in the fall at the beginning of the year. The ECB also noted that it will fully reinvest the profits from quantitative easing for a long period after the first rate hike. Today in the first half of the day, data were also published, according to which industrial production in France in February of this year showed an increase of 0.4% compared with January. Economists had expected industrial production in France to drop by 0.5% in February. The data for January was revised down slightly to 1.2% versus 1.3% earlier. As for the technical picture of the EURUSD pair, it remained unchanged. Pressure on the euro may return after the speech of the President of the European Central Bank, Mario Draghi. The breakthrough of important support levels around 1.1250 and 1.1220 will resume the downward trend in risky assets, which will lead to the renewal of already monthly lows around 1.1180 and 1.1120. In case of going beyond the resistance level of 1.1290, the demand for the euro will lead to the renewal of local highs in the area of 1.1320 and 1.1380. The British pound rose in the first half of the day amid good data on economic growth, as well as due to a decrease in the probability of a hard Brexit. Most experts agree that the UK will almost certainly get another postponement following the meeting, which will be held this Friday. On the other hand, what kind of postponement is still unknown. If London receives an annual delay with the right to leave the EU ahead of schedule, it will weaken the position of British Prime Minister Theresa May, which will threaten her political career. This will be a negative signal for the British pound, as the uncertainty associated with the prospects for economic growth will only increase. On the other hand, if the EU votes for the postponement until June 30, as the Prime Minister requested, the chances of developing the agreement necessary for parliament will remain quite high, which will be a positive signal for pound buyers. As for today's report, despite the slow growth, good rates of activity in the service sector remain and a recovery in demand for goods produced in the UK is noted. According to the National Bureau of Statistics, between December and February 2019, UK GDP grew by 0.3%, showing a similar increase in the period from November to January. The material has been provided by InstaForex Company - www.instaforex.com |
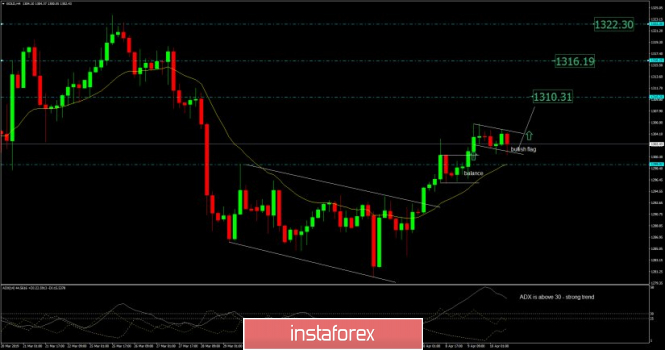
| Analysis of Gold for April 10, 2019 Posted: 10 Apr 2019 05:53 AM PDT Gold has been trading sideways at the price of $1.302.15. We are still expecting upward price and bullish continuation.
Nothing has specially changed since our previous analysis. The ADX reading is above 30 level, which is sign of the strong bullish trend-momentum. In the background, we found the bullish flag pattern in creation, which even adds more upside potential. Support levels are seen at the price of $1.293.00 and $1.284.00. Resistance levels are seen at the price of $1.310.00, $1.316.10 and $1.322.10. Trading recommendation: We are still holding our long position the Gold from $1.300.00 and with targets at $1.310.55 and $1.316.00. Protective stop is placed at $1.292.00. The material has been provided by InstaForex Company - www.instaforex.com |
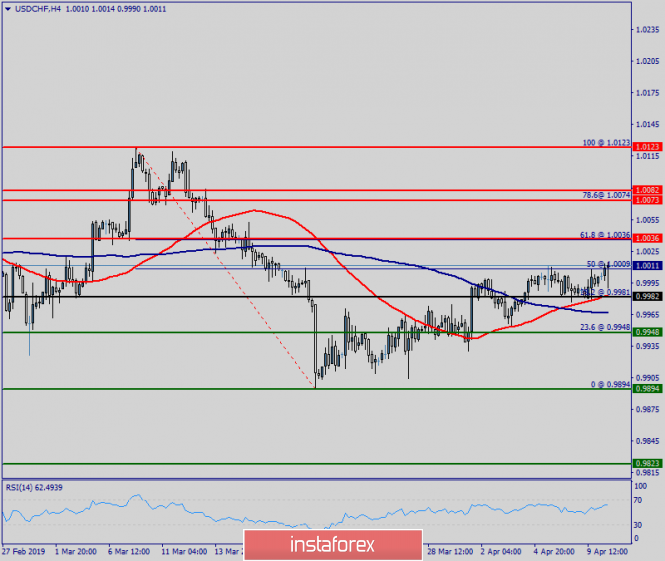
| Technical analysis of USD/CHF for April 10, 2019 Posted: 10 Apr 2019 05:49 AM PDT The USD/CHF pair continues moving in a bullish trend from the support levels of 0.9895 and 0.9948. Currently, the price is in an upward channel. This is confirmed by the RSI indicator signaling that the pair is still in a bullish trend. As the price is still above the moving average (100), immediate support is seen at 0.9948 coinciding with a golden ratio (23.6% of Fibonacci). Consequently, the first support is set at the level of 0.9948. So, the market is likely to show signs of a bullish trend around 0.9948. In other words, buy orders are recommended above the golden ratio (0.9948) with the first target at the level of 0.9983. Furthermore, if the trend is able to breakout through the first resistance level of 0.9983, we should see the pair climbing towards the double top (1.0036) to test it. It would also be wise to consider where to place a stop loss; this should be set below the second support of 0.9895. The material has been provided by InstaForex Company - www.instaforex.com |
| Posted: 10 Apr 2019 05:47 AM PDT To open long positions on the GBP / USD pair, you need: Pound buyers managed to return the pair to the resistance level of 1.3079. while the trade is conducted above this range, you can count on the continuation of the upward correction with a test of highs around 1.1319 and 1.1360, where I recommend fixing the profit. In case that the pair return under the support of 1.3079 or the appearance of bad news on Brexit, it is best to return to long positions on a false breakdown around the lower boundary of the side channel 1.3032 or on a rebound from the monthly minimum of 1.2988. To open short positions on the GBP / USD pair, you need: Given the uncertainty with Brexit and the likelihood of exit without an agreement, although small it is still existing, bears can return to the market after reducing to the support level of 1.3079. This will automatically result in closing long positions of buyers, recruited after good data on GDP. Moreover, it will lead to a decrease in GBP/USD to the area of the minimum at 1.3032 and 1.2988, where I recommend taking profits. Under the scenario of further growth of the pound, one can consider sales from the upper border of the side channel at 1.3119 or immediately on a rebound from the new resistance of 1.3160. More in the video forecast for April 10 Indicator signals: Moving averages Trade is conducted in the region of 30 and 50 moving averages, which indicates the lateral nature of the market. Bollinger bands Under the scenario of a decline in the pound, support will be provided by the average Bollinger Bands indicator around 1.3065 and the lower border in the area 1.3030. Description of indicators MA (moving average) 50 days - yellow MA (moving average) 30 days - green MACD: fast EMA 12, slow EMA 26, SMA 9 Bollinger Bands 20 The material has been provided by InstaForex Company - www.instaforex.com |
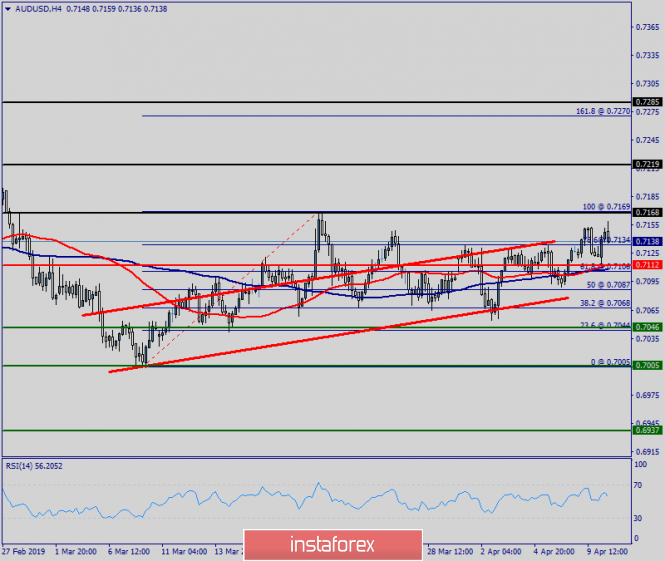
| Technical analysis of AUD/USD for April 10, 2019 Posted: 10 Apr 2019 05:46 AM PDT The AUD/USD pair is set above strong support at the levels of 0.7046 and 0.7168. This support has been rejected four times confirming the uptrend. Hence, the major support is seen at the level of 0.7046, because the trend is still showing strength above it. Accordingly, the pair is still in the uptrend in the area of 0.7046 and 0.7168. The AUD/USD pair is trading in the bullish trend from the last support line of 0.7112 towards thae first resistance level of 0.7168 in order to test it. This is confirmed by the RSI indicator signaling that we are still in the bullish trending market. Now, the pair is likely to begin an ascending movement to the point of 0.7168 and further to the level of 0.7290. The level of 0.7389 will act as the major resistance and the double top is already set at the point of 0.7389. At the same time, if there is a breakout at the support levels of 0.7112 and 0.7046, this scenario may be invalidated. Overall, however, we still prefer the bullish scenario. The material has been provided by InstaForex Company - www.instaforex.com |
| Posted: 10 Apr 2019 05:42 AM PDT To open long positions on EUR / USD pair, you need: While trading of the EUR/USD pair is above the support level of 1.1254, traders are preparing for a speech by the President of the European Central Bank, which may shed light on the future direction of the pair. The main goal of the bulls in the afternoon will be a breakthrough and consolidation above the resistance of 1.1284, which will lead to an update of the maximum near 1.1324 and 1.1358, where I recommend taking profits. In the case of the EUR / USD decline scenario in the second half of the day, it is best to look at long positions on a false breakdown around 1.1254 or buy directly on the rebound from a minimum of 1.1223. To open short positions on EUR / USD pair, you need: Bears will manifest themselves only after the formation of a false breakdown in the area of resistance 1.1284, which will lead to renewed pressure on the euro and a decrease in the area of support of 1.1254. However, the main task of the sellers after the speech of the ECB President Mario Draghi will be a breakthrough of the level of 1.1254 and a test of the minimum in the area of 1.1223 and 1.1183, where I recommend taking profits. In case that the EUR / USD growth scenario is above 1.1284 in the second half of the day, it is best to consider short positions on a rebound from the maximum and 1.1324. More in the video forecast for April 10 Indicator signals: Moving averages Trade is conducted in the region of 30 and 50 moving averages, which indicates the preservation of the lateral nature of the market. Bollinger bands In the event of a decline, support will be provided by the lower limit of the Bollinger Bands indicator in the area of 1.1255. Description of indicators MA (moving average) 50 days - yellow MA (moving average) 30 days - green MACD: fast EMA 12, slow EMA 26, SMA 9 Bollinger Bands 20 The material has been provided by InstaForex Company - www.instaforex.com |
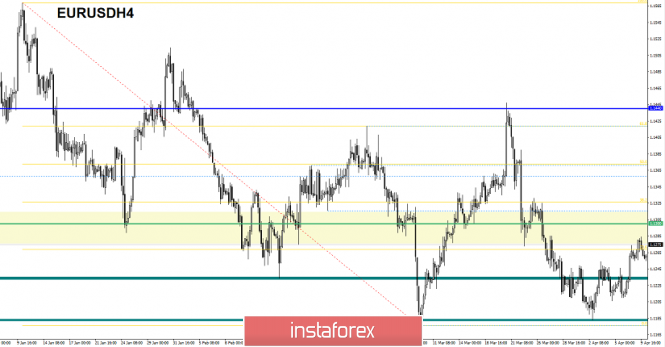
| Simplified wave analysis of the main currency pairs on April 10 Posted: 10 Apr 2019 03:36 AM PDT EUR/USD The market of the major euro pair is dominated by a downtrend. All counter movements are corrosive. The last short-term wave structure was launched on March 3. In the larger model, it began to form the final part (C). From March 20, the middle part of the wave develops, which is still unfinished. Forecast: Over the next trading sessions, a moderate price increase is expected to the limits of the calculated resistance. A break in the upper boundary of the zone is unlikely. Next, we should wait for the formation of a turn and the beginning of a decline. Recommendations: Purchases within the day have little potential and can only be used for scalping. It is more promising to wait for the signals of the exchange rate change and look for the signals to sell the instrument. The preliminary downward potential is limited by the support zone. Resistance zone: - 1.1300 / 1.1330 Support zone: - 1.1210 / 1.1180 GBP/USD The large-scale charts of the British pound have a stable bearish trend. Since the end of last year, a correctional wave has been developing upwards, the potential of which has almost been exhausted. An unfinished wave of the scale H1 is starting from March 13. The wave is bearish, the middle part is being formed in it (B). The preliminary target lift zone is in the area of the resistance zone. Forecast: At the next sessions, a flat mood with an upward vector is expected. Since all traffic goes up against the course of the main trend, the magnitude of stroke is likely minimal. The beginning of the downward movement is expected at the end of the day. Recommendations: Buying a pair in the next few hours has little potential, while it is more reasonable to reduce the lot. Lots for sale will have a great prospect. It is better to look for reversal signals in the area of the calculated resistance. Resistance zone: - 1.3120 / 1.3150 Support zone: - 1.3000 / 1.2970 USD/JPY Since the beginning of this year, the Japanese price movement course is ascending. Considering that in a larger wave model this section completes the design, the nature of the price movement is close to impulse. The last short-term wave started on March 25th. In recent days, the correctional part (B) of the wrong kind has been completed there. The settlement zone is located in the support area. Forecast: The downward movement can be completed in the next sessions. The price may briefly push the lower support line, but the probability of this is small. The beginning of price growth is likely at the end of the day or tomorrow. Recommendations: Selling the pair is quite risky. It is recommended to monitor the instrument purchase signals in the support area. Resistance zone: - 111.75 / 112.05 Support zone: - 110.95 / 110.65 AUD/USD The main direction of the short-term movement of the bullish wave of the Aussie goes against the main trend and has little potential. The current short-term wave construction is ascending on March 8th. Its structure completed the first 2 parts (A+B). The final part (C) started on April 2. Forecast: At the beginning of the bullish price movement, the nearest target zone is in the area of the lowest possible extension of the wave upwards. In the case of a breakthrough of the upper boundary of the zone, the price may rise to the region where the 74th price figure has begun. Recommendations: In the coming days, the emphasis in the trade should be made on the purchases of the pair. When generating opposite signals in the area of resistance, the direction vector of transactions should be changed to descending. Resistance zone: - 0.7220 / 0.7250 Support zone: - 0.7100 / 0.7070 Explanations for the figures: Waves in the simplified wave analysis consist of 3 parts (A – B – C). The last unfinished wave is analyzed. Zones show areas with the highest probability of reversal. The arrows indicate the wave marking according to the method used by the author, the solid background - the formed structure, the dotted ones - the expected movements. Note: The wave algorithm does not take into account the duration of the instrument movements in time. The material has been provided by InstaForex Company - www.instaforex.com |
| Trading recommendations for the EURUSD currency pair - placement of trading orders (April 10) Posted: 10 Apr 2019 03:20 AM PDT The currency pair Euro / Dollar for the last trading day showed an extremely low volatility of 29 points, as a result with almost one point remaining. From the point of view of technical analysis, we see that the correctional phase from the level of 1.1180 led us to the value of 1.1284, where the quote slowed down, forming a narrow range of 20 points. The news and news background is immediately under a flurry of two events: the first is, of course, an emergency summit of the countries of the European Union, where Brexit's fate will be decided, and the second - no less important event - the meeting of the Unified Central Bank. The upcoming EU summit today has been worrying investors for a week already. It will decide the fate of Brexit, and in particular, the possible delay that Britain persistently solicits. Earlier, the head of the European Council, Donald Tusk, had repeatedly spoken out on this topic, who said that he had invited the leaders of 27 countries in the European Union to discuss at the summit the request of British Prime Minister Theresa May on the postponement. It is difficult to say whether the opportunity for Britain will be given as a result, since the EU has repeatedly responded against such actions, without any guarantees. In theory, a postponement is possible, but for her sake England must demonstrate to Brussels firm steps towards agreeing on a Brexit agreement. On Wednesday, the Belgian Prime Minister Charles Michel has already managed to declare that there will be no new negotiations on Britain's withdrawal from the European Union. The second key event of the day, as mentioned earlier, was the meeting of the Unified Central Bank, where, even earlier this week, the media caught up with rumors that the regulator was allegedly disappointed in the policy of negative interest rates. Naturally, you should not think that at the current meeting of the ECB will change the rate. Everything will remain at the same level. However, Mario Draghi will speak at a press conference, happening at 15:30 Moscow time. There may appear explanations of earlier rumors wherein traders might be interested in.
As you already understood, today is too full of events, and even in terms of the economic calendar, we have data on inflation in the United States, where they expect growth from 1.5% to 1.8%. Thus, market volatility is provided to us. Further development Analyzing the current trading schedule, we see that there is a characteristic stagnation in the market. On the eve of the very stratum of information and news background, investors, naturally, are trying to sit out on the fence, and speculators are considering possible risky entries to ride on the waves noise.
To enter the market is up to you , of course. However, if your positions are purely speculative, then traders are now analyzing the current stagnation of 1.1250 / 1.1285, including the fixation points when placing trading orders. Indicator Analysis Analyzing a different sector of timeframes (TF ), we see that in the short and intraday perspective, a variable upward interest has appeared against the background of correction and stagnation. The medium-term perspective maintains a downward interest in the market. Weekly volatility / Measurement of volatility: Month; Quarter; Year Measurement of volatility reflects the average daily fluctuation , based on monthly / quarterly / year. (April 10, was based on the time of publication of the article) The current time volatility is 19 points. Due to the dense information and news background, the volatility of the current day is likely to be high. Key levels Zones of resistance: 1.1300 **; 1.1440; 1.1550; 1.1650 *; 1.1720 **; 1.1850 **; 1.2100 Support areas: 1.1180; 1.1000 * Periodic level ** Range Level The material has been provided by InstaForex Company - www.instaforex.com |
| Posted: 10 Apr 2019 03:19 AM PDT The euro is gradually strengthening its position ahead of an important meeting of the European Central Bank, at which the interest rate is expected to remain unchanged. At today's meeting, the leadership of the European Central Bank will discuss issues relating to the future prospects of credit policy, but it is unlikely that any changes will be made. All emphasis will be shifted to the rhetoric in the speech of the ECB President Mario Draghi. If there are concerns about downside risks to inflation, the pressure on the euro will increase. Also, investors will closely monitor the answer to questions related to the differential system of interest rates on deposits, as well as the details of the third stage of TLTRO. Most likely, after the meeting, the pressure on the euro will return, and the breakthrough of important support levels in areas of 1.1250 and 1.1220 will resume the downward trend in risky assets, which will lead to the renewal of the monthly minimums in the areas of 1.1180 and 1.1120. Italy's report on GDP growth forecast in 2019 did not please investors, as well as the fact that the IMF revised its vision of global economic growth. The report indicates that Italy lowered its forecast for GDP growth in 2019 to 0.1% versus 1% earlier. The budget deficit forecast was also raised to 2.5% of the gross domestic product. Let me remind you that last year a struggle began between Rome and Brussels on the issue of an acceptable level of fiscal easing. Both sides agreed on a budget deficit level of 2.04% of GDP. The International Monetary Fund in its report pointed out that the world economy in early 2019 is weaker than expected. According to IMF forecasts, the world economy in 2019 will grow only by 3.3% against the forecast of 3.5% in January and 3.7% in October 2018. This is due to a slowdown in almost all advanced countries, including the United States. The IMF also drew attention to the persistence of tension in trade relations, as well as the introduction and increase of duties on the part of the United States and China. Last night, the US Treasury Secretary and the Fed made a speech. Mnuchin raised the topic of US public debt and noted that US President Donald Trump wants the debt ceiling raised as soon as possible. In his opinion, a default on public debt would be rather disastrous for the American economy. Fed spokesman Richard Clarida gave an interview yesterday in which he said that the Central Bank is analyzing monetary policy, during which the possibility inflation growth above 2% during economic upswings will be examined to compensate for lower inflation during recessions. During the analysis, the Fed will also try to find new policy instruments for periods when the rates are very low. The material has been provided by InstaForex Company - www.instaforex.com |


| You are subscribed to email updates from Forex analysis review. To stop receiving these emails, you may unsubscribe now. | Email delivery powered by Google |
| Google, 1600 Amphitheatre Parkway, Mountain View, CA 94043, United States | |
No comments:
Post a Comment