
Forex analysis review |
- April 12, 2019 : shall the GBP/USD respect the current confluence of supply levels around 1.3150-1.3170.
- April 12, 2019 : EUR/USD demonstrating recent bearish rejection around 1.1320, shall it hold ?
- Oil market: growth factors and weak points
- Bitcoin analysis for April 12, 2019
- USD/JPY analysis for April 12, 2019
- It doesn't matter whether the trade war breaks out with a new force or the trade war ends, EUR/USD will rise
- Euro rose from the ashes
- GBP/USD: plan for the American session on April 12. The pound remains in the side channel
- EUR/USD: plan for the US session on April 12. Bulls managed to get above the key resistance of 1.1290
- Analysis of Gold for April 12, 2019
- Trading recommendations for the GBPUSD currency pair - prospects for further movement
- Gold as insurance against hyperinflation and driver of economic growth
- Simplified wave analysis and forecast for April 12 (EUR/USD, USD/JPY, GOLD)
- EURUSD: Euro buyers are once again trying to "drag the blanket" to their side
- GBP/USD. 12th of April. The trading system "Regression Channels". Pound sterling in complete confusion
- EUR/USD. 12th of April. The trading system "Regression Channels". The euro with great difficulty "crawls" up
- Analysis of EUR/USD divergence for April 12. Bullish divergence helped the euro to grow a little more
- Analysis of GBP/USD divergences for April 12th. The second rebound from the level of 1.30100. The pound is experiencing difficulties
- BITCOIN Analysis for April 12, 2019
- Control zones NZDUSD 04/12/19
- Technical analysis of AUD/USD for April 12, 2019
- Technical analysis of NZD/USD for April 12, 2019
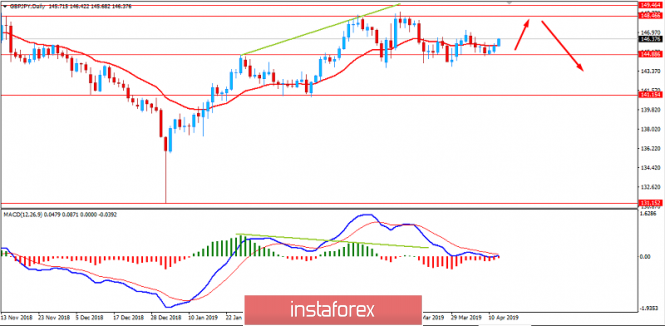
- Fundamental Analysis of GBPJPY for April 12, 2019
- Wave analysis of GBP / USD for April 12. Brexit moved, the pair remains in the triangle
- Fundamental Analysis of NZD/USD for April 12, 2019
| Posted: 12 Apr 2019 10:27 AM PDT
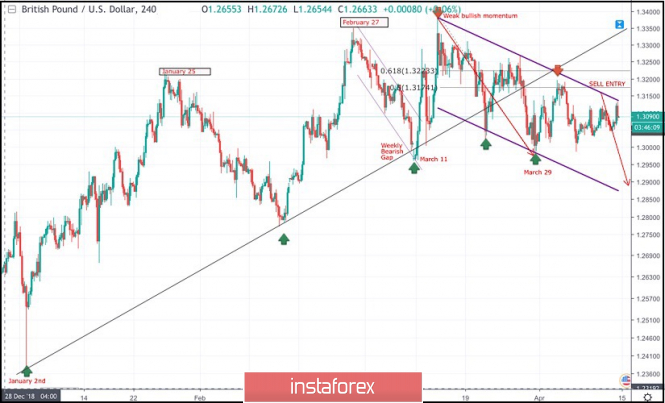
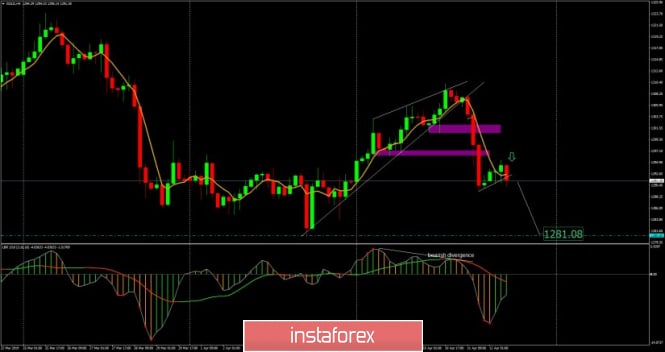
On January 2nd, the market initiated the depicted uptrend line around 1.2380. This uptrend managed to initiate two successive bullish waves towards 1.3200 (Jan. 25) then 1.3350 (Feb. 27) before the bearish pullback brought the GBPUSD pair towards the uptrend on March 8th. A weekly bearish gap pushed the pair below the uptrend line (almost reaching 1.2960) before the bullish breakout above short-term bearish channel was achieved on March 11. Shortly after, the GBPUSD pair demonstrated weak bullish momentum towards 1.3200 then 1.3360 where the GBPUSD failed to achieve a higher high above the previous top achieved on February 27. Instead, the depicted bearish channel was established. Significant bearish pressure was demonstrated towards 1.3150 - 1.3120 where the depicted uptrend line failed to provide any bullish support leading to obvious bearish breakdown. On March 29, the price levels of 1.2980 (the lower limit of the depicted movement channel) demonstrated significant bullish rejection. This brought the GBPUSD pair again towards the price zone of (1.3160-1.3180) where the upper limit of the depicted bearish channel as well as the backside of the depicted uptrend line came to meet the pair. Currently, the price zone of 1.3140-1.3170 currently corresponds to the upper limit of the depicted bearish channel where another bearish movement may be initiated. Bearish rejection is still anticipated around the current price levels (1.3140-1.3170). Further bearish decline is expected towards 1.2920-1.2900 where the lower limit of the depicted channel is located. Trade Recommendations: Any bullish pullback towards 1.3150-1.3170 should be considered for another SELL entry. TP levels to be located around 1.3100, 1.3020 then 1.2950 - 1.2920. S/L to be located above 1.3190. The material has been provided by InstaForex Company - www.instaforex.com |
| April 12, 2019 : EUR/USD demonstrating recent bearish rejection around 1.1320, shall it hold ? Posted: 12 Apr 2019 10:09 AM PDT
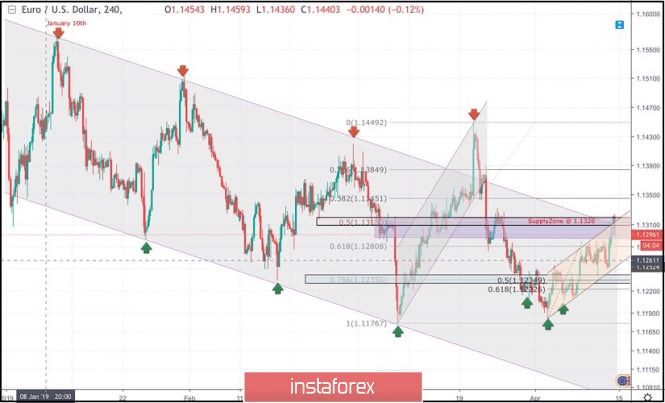
On January 10th, the market initiated the depicted bearish channel around 1.1570. Since then, the EURUSD pair has been moving within the depicted channel with slight bearish tendency. On March 7th, recent bearish movement was demonstrated towards 1.1175 (channel's lower limit) where significant bullish recovery was demonstrated. Bullish persistence above 1.1270 enhanced further bullish advancement towards 1.1290-1.1315 (the Highlighted-Zone) which failed to provide adequate bearish pressure. On March 18, a significant bullish attempt was executed above 1.1380 (the upper limit of the Highlighted-channel) demonstrating a false/temporary bullish breakout. On March 22, significant bearish pressure was demonstrated towards 1.1280 then 1.1220. By the end of last week, a bullish Head and Shoulders reversal pattern was demonstrated around 1.1200. As expected, this enhanced further bullish advancement towards 1.1300-1.1315 (supply zone) where recent bearish rejection is being demonstrated now. Short-term outlook turns to become bearish towards 1.1280 (61.8% Fibonacci) where price action should be watched cautiously. For Intraday traders, the price zone around 1.1280 stands as a prominent demand area to be watched for another valid BUY entry if enough bullish rejection is expressed. On the other hand, bearish breakdown below 1.1280 opens the way for further bearish decline towards 1.1250-1.1235. Trade recommendations : Conservative traders were suggested to have a valid BUY entry around 1.1235. It's running in profits now. TP levels to be located around 1.1320 and 1.1440. SL should be advanced to 1.1270 to offset the associated risk. The material has been provided by InstaForex Company - www.instaforex.com |
| Oil market: growth factors and weak points Posted: 12 Apr 2019 07:30 AM PDT
Oil prices continue to hold near five-month highs. How much more can they grow and what can prevent it? "A more significant than expected reduction in black gold production by OPEC countries, as well as growing geopolitical risks, form the basis for a further rise in quotations. It is possible that next month the United States will impose tougher conditions for buyers of Iranian oil, which were granted exemptions after Washington imposed sanctions against Tehran," analysts at RBC Capital Markets said They forecast the average cost of a barrel of Brent oil this year at $75, and WTI – $67. "In the near future, "bullish" factors will not disappear. We expect that the prerequisites for the deficit will continue for 2 quarters. The following now speaks in favor of this: a decrease in the production of raw materials by OPEC countries, a consistent increase in activity on world markets, a further tightening of oil sanctions by the United States and only a moderate increase in shale production at the moment," said Goldman Sachs representatives. "The cost of Brent crude oil has returned to levels above $70 a barrel. We believe that the "bulls" will not stop and, obviously, will make an attempt to develop movement in the direction of $80," the UBS experts said. They believe that in the next three months, quotes will stabilize in the range of $70- $80 per barrel. Meanwhile, despite the fact that the oil market is moving up, not everyone believes that this situation will continue. "The bullish attitude is gradually increasing, but a vicious circle may form that will prevent a prolonged oil rally. The higher prices rise, especially in such a short period, the more disagreements will appear in the OPEC + group," said Norbert Rucker from Julius Baer Bank. "OPEC may increase production from July if quotations exceed $80 per barrel," – reports Reuters, citing sources within the cartel. In addition, one of the obvious weaknesses is a strong backlog of assets in developing countries from a rally in commodity and equity markets. Higher oil prices and a still strong US dollar are putting pressure on a number of EM currencies, which is why in many countries, black gold is much more expensive, which could lead to a decrease in demand for raw materials. The material has been provided by InstaForex Company - www.instaforex.com |
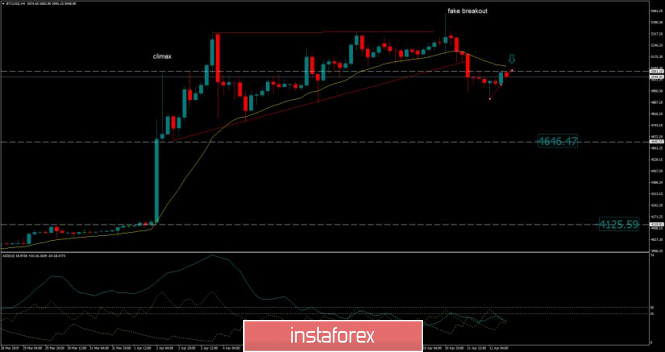
| Bitcoin analysis for April 12, 2019 Posted: 12 Apr 2019 06:57 AM PDT BTC has been trading sideways at the price of $5.047. We are still bearish and the downward movement is expected to happen.
According to the H4 time-frame, our analysis from yesterday is still active and didn't change. We found that our support trendline got finally broken, which is sign that sellers are in control and that buyers got exhausted. Also, we found that fake breakout of the resistance at $5.324 in the background, which adds more weakness on the BTC. Our advice is to watch for selling opportunities with the downward targets at $4.651 and $4.133. Key resistance level is seen at the price of $5.445. The material has been provided by InstaForex Company - www.instaforex.com |
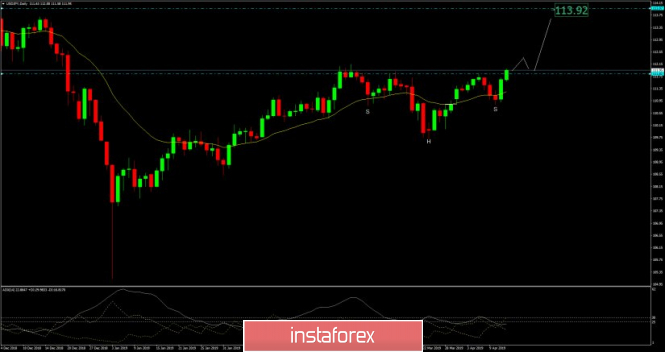
| USD/JPY analysis for April 12, 2019 Posted: 12 Apr 2019 06:52 AM PDT USD/JPY has been trading upwards as we expected. The price tested the level of 111.95. We are expecting more upside on this currency pair.
According to the daily time-frame, we found that the neckline at 111.82 from the inverted head and shoulders pattern got broken, which is sign that demand is in control. To confirm even more the breakout, we would like to see USD/JPY to trade at 112.30 before we buy. Support level is seen at the price of 110.85. Trading recommendation: We are watching for buying USD/JPY if price trades above 112.30. Projected target is set at the price of 113.90. The material has been provided by InstaForex Company - www.instaforex.com |
| Posted: 12 Apr 2019 06:50 AM PDT In the middle of the week, the EUR/USD pair sharply collapsed following the next ECB meeting. As expected, the regulator preferred to maintain the status quo and promised to disclose the details of the new TLTRO program at one of the following meetings. In addition, the Central Bank noted that the risks for growth prospects in the eurozone are still shifted downwards, and the onset of a recession in the regional economy is still unlikely. However, only one mention of this word made the market nervous, as a result of which EUR/USD fell. However, the pullback was short-lived, and soon the pair recovered. The FOMC "minutes" published this week, in turn, confirmed that the Fed, as promised in February, will adhere to a patient approach to the issue of changing monetary policy. Since the beginning of this year, the EUR/USD pair has been trading in the range of 1.1200-1.1450, and its range is 392 points, that is less than 4 cents. According to experts, in the "sleepy kingdom" rates of major currencies will be until the market changes its expectations about what steps the leading central banks intend to take in the future. "The fall of the euro after the ECB meeting on Wednesday led the pair to approach critical levels. The fact that the regulator is going to analyze whether there is a need for monetary policy easing was regarded by the market as the Central Bank's readiness to resort to such measures in the future, rather than attempts to normalize," said Esther Reichelt, currency strategist at Commerzbank. "If the ECB does implement a significant easing, then there's no hope of raising interest rates in 2020. This will put pressure on the euro. If EUR/USD decisively breaks down the level of 1.12, this can change the rules of the game," she added. In addition, the surge in volatility of quotations can lead to the completion of the US trade conflict with China, as well as the transfer of "fighting" from Asia to Europe. "The market now does not include in the prices a scenario for the de-escalation of the trade war between Washington and Beijing, which implies the abolition of duties. A trade agreement that turns out to be better than what is now expected will contribute to the improvement of the global economy. In this case, the dollar may weaken against the euro," said Ben Randal from Bank of America. The expert predicts that by the end of the year, EUR/USD will rise to the level of 1.20. "Although the trade deal between the United States and China is a prerequisite for the euro rally, this may not be enough for investors to enter the "longs" for a single currency, given the continuing risk of aggravation of trade relations between America and the Old World," B. Randall noted. However, right now the United States is unlikely to impose duties on European goods, because they have not yet solved this issue with China, and it is expensive and difficult to "fight" on two fronts. Therefore, while the claims are solely in the theoretical plane, and for EUR/USD, this information is neutral. The material has been provided by InstaForex Company - www.instaforex.com |
| Posted: 12 Apr 2019 06:50 AM PDT Despite all the attempts of Mario Draghi to drown the euro, EUR/USD bulls managed to finish the second week of April in the green zone. The vulnerability of the main competitor and positive news from China's inflation and the trade balance, as well as from European industrial production, allowed the main currency pair to consolidate above the base of the 13th figure. Buyers do not intend to stop, hinting that it is time to put an end to the upward trend in the USD index. At a time when the US economy slows down and the Fed intends to keep the federal funds rate at least until the end of 2019 (according to a consensus assessment of the Wall Street Journal experts, it will not change until 2021), practically nothing depends on the US dollar. It is forced to go with the flow and react to the behavior of other currencies and central banks. In order to resume the normalization cycle, the Fed needs very strong statistics. And how to get it, if the effect of the fiscal stimulus disappears, and the IMF predicts a decline in US GDP growth rates to 2.3% (the Fed forecast + 2.1%). The White House still believes in magical + 3%, but this requires either a new tax reform, or a reanimation of QE, or a weak dollar. The latter option is perhaps the most realistic for Donald Trump, which reduces the risks of a large-scale trade war between the US and the EU because in this situation the USD index will go up again. For a long time, "American" were afraid to sell because of the weakness of its competitors. Nevertheless, a positive from European business activity and industrial production returned interest in buying EUR/USD. If the economy of the currency bloc groped for the bottom, and the Chinese data would stretch a helping hand to it, then why not increase the share of the euro in investment portfolios? In this regard, the release of data on the GDP of China for the first quarter and for the indexes of purchasing managers in the eurozone in April can disperse the upward movement of the main currency pair. Unless, of course, there are no unpleasant surprises. Dynamics of European business activity and GDP One of them may come from the States, which intend to impose duties on imports of aircraft and other goods from the EU due to non-market subsidies to Airbus. There are rumors in the market about the start of a new trade war, but in fact, in this way, Donald Trump may push Brussels to negotiate the abolition of tariffs on industrial goods. If the parties agree, this will improve the position of international trade, and in fact, its slowdown, according to the IMF, has become the main brake on global GDP. The authoritative organization lowered the forecasts for economic growth in the eurozone from 1.6% to 1.3% in 2019, however, as often happens, the worse the estimate, the more reasons for joy if it is exceeded. Technically, the second false breakdown of the lower limit of the medium-term consolidation range of 1.125-1.15 testifies to the weakness of the "bears" in EUR/USD. If the opponents manage to return the quotes to the middle of the trading channel and activate, thus, the "Deception-Release" pattern, the risks of continuing the rally in the direction of the "Wolfe waves" target will increase. The material has been provided by InstaForex Company - www.instaforex.com |
| GBP/USD: plan for the American session on April 12. The pound remains in the side channel Posted: 12 Apr 2019 06:50 AM PDT To open long positions on GBP/USD, you need: Pound buyers managed to form a false breakout from the support level of 1.3052, which I paid attention to in my morning review. Now, their task is to break and consolidate above the middle of the channel 1.3088, which will update its upper limit of 1.3119, where I recommend fixing the profits. In the second half of the day, the scenario of a repeated decline of the pound to the support area of 1.3052, it is best to return to long positions to rebound from the minimum of 1.3021. To open short positions on GBP/USD, you need: Bears today will count on a return and consolidation below the support level of 1.3052, which will push GBP/USD to larger lows in the area of 1.3021 and 1.2988, where I recommend fixing the profits. The failure to consolidate and form a false breakdown in the middle of the side channel of 1.3088 will also be a signal to open short positions in GBP/USD. In the scenario of growth above 1.3088 in the second half of the day, it is best to count on the sale of the pound from the high of the week around 1.3119. Indicator signals: Moving Averages Trading is conducted in the area of 30 and 50 moving averages, which indicates the lateral nature of the market. Bollinger bands In the scenario of the pound decline, the lower border of the Bollinger Bands indicator in the area of 1.3040 will act as support. Description of indicators
|
| Posted: 12 Apr 2019 06:50 AM PDT To open long positions on EURUSD, you need: The data on industrial production in the eurozone turned out to be better than economists' forecasts, which allowed euro buyers to cope with the level of 1.1290, which I paid attention to in the morning review. At the moment, the upward trend is stopped in the resistance area of 1.1324, the breakthrough of which will increase the demand for EUR/USD and lead to an update of the highs in the area of 1.1358 and 1.1388, where I recommend fixing the profits. In the case of a downward correction of the euro in the second half of the day, you can take a closer look at long positions after the support test of 1.1295 or a rebound from a minimum of 1.1265. To open short positions on EURUSD, you need: Euro sellers are not in a hurry to return to the market from the resistance level of 1.1324, and the stop in growth is only due to profit taking on long positions. Only the formation of a false breakdown in this range in the second half of the day will allow us to count on a downward correction to the support area of 1.1295, the breakthrough of which will lead to a rapid decline in the euro to a minimum of 1.1265. In the scenario of further growth of EUR/USD, it is best to expect short positions to rebound from the maximum of 1.1358. Indicator signals: Moving Averages Trading is conducted above 30 and 50 moving averages, which indicates the resumption of the upward correction in euros. Bollinger bands In the case of a euro decline in the afternoon, support will be provided by the average Bollinger Bands indicator around 1.1275. Description of indicators
|
| Analysis of Gold for April 12, 2019 Posted: 12 Apr 2019 06:40 AM PDT Gold has been trading sideways at the price of $1.291.00 in past 16 hours. We still expecting downward movement.
According to the H4 time-frame, we found that there is the breakout of the bearish flag pattern in the background, which is sign that selling may continue. There is the breakout of the support trendline in the background, which adds even more weakness on the Gold. Key support level is seen at the price of $1.281.00. Key short-term resistance is set at $1.310.00. Trading recommendation: We sold Gold from $1.290.80 with the target at $1.281.10. Protective stop is placed above the $1.310.50. The material has been provided by InstaForex Company - www.instaforex.com |
| Trading recommendations for the GBPUSD currency pair - prospects for further movement Posted: 12 Apr 2019 04:04 AM PDT The pound / dollar currency pair for the last trading day showed extremely low volatility of 60 points, which resulted in a slight decrease. From the point of view of technical analysis, we see that for the fourth day in a row, there is a slight decrease in volatility and the quote itself is gradually driving into the range of 1.3030 (1.3000) / 1.3120, which is quite understandable and that the investors have hidden. Information and news background rolls into hell on the background of ambiguous Brexit. Earlier in the reviews, we have already discussed the reprieve, which the European Union provided with grace, but now, returning home, Theresa May provided the report to the House of Commons on her journey. The British Prime Minister delivered a speech: "We are faced with a tough choice, and the time frame is clear. And I'm sure that we must now strive to achieve consensus on a deal that meets the interests of our country. I welcome the negotiations with the opposition which took place in recent days, and which will continue today. For British policy, the current situation cannot be called normal, and all this in many ways causes inconvenience to both the government and the opposition parties". Naturally, this kind of fierce steps were met by Laborites, who criticized Theresa May. Jeremy Corbin, the opposition leader, said: "All of this is happening three weeks after the Prime Minister told the House of Commons that she was ready to postpone Brexit, but no later than June 30. And the second postponement of the date for three weeks not only speaks of a diplomatic failure, but also becomes another step in the improper management of the whole Brexit process by the government. " As expected from this postponement, we now return to our volatility, which is almost tirelessly decreasing almost a week. We are getting it all clear. Brexit is so confusing to all that the big players, and investors, are waiting for the groove to the certainty of is happening. The upcoming trading week in terms of events and news will be more modest relative to the past week. The main stream of news is expected from Tuesday, but also on Friday - both in the West and in Europe they celebrate the holiday "Good Friday". The most current data is displayed below. Tuesday United Kingdom 11:30 Moscow time. - Average wage with bonuses (Feb): Prev. 3.4% ---> Forecast 3.2% United Kingdom 11:30 Moscow time. - Change in the number of applications for unemployment benefits (Mar.): Prev. 27K United States 16:15 MSK - Industrial Production (g / g): Prev. 3.6% Wednesday United Kingdom 11:30 Moscow time. - Consumer Price Index (CPI) (y / y) (Mar): Prev. 1.9% ---> Forecast 1.8% 16:00 MSK - Speech by the head of the Bank of England Carney Thursday United Kingdom 11:30 Moscow time. - Retail Sales (YoY) (Mar): Prev. 4.0% ---> Forecast 3.3% United States 15:30 MSK - Retail Sales (YoY) (Mar): Prev. 2.2% These are preliminary and subject to change. Further development Analyzing the current trading chart, we see a preserving uncertainty, where the quote, working out the supposedly upper limit of the 1.3120 range, is heading towards the lower border of 1.3030 (1.3000). It is likely to assume the preservation of the current amplitude oscillation, where traders work both within the range and focus their attention on the borders themselves, waiting for them to break down the main trades. Based on the data available, it is possible to decompose a number of variations, let's consider them: - Buy positions are considered in the case of a slowdown in the range of 1.3030 (1.3000). In the case of mining, the prospect is in the side of 1.3120. Main transactions will be considered only after a clear price fixing becomes higher than 1.3120. - Positions for sale are in theory the same as for purchase. Works within range are with less volume. Major transactions are considered only after a clear fix below 1.3000. Indicator Analysis Analyzing a different sector of timeframes (TF ), we see that in the short term there is a neutral interest due to uncertainty. Intraday and mid-term prospects are set to a descending interest. Weekly volatility / Measurement of volatility: Month; Quarter; Year Measurement of volatility reflects the average daily fluctuation, based on monthly / quarterly / year. (April 11 was based on the time of publication of the article) The current time volatility is 30 points. In the case of clamping in the range and maintaining uncertainty, the volatility will remain below the daily average. Key levels Zones of resistance: 1.3220 *; 1,3300 **; 1.3440; 1.3580 *; 1.3700 Support areas: 1.3000 ** (1.3000 / 1.3050); 1.2920 *; 1.2770 (1.2720 / 1.2770) **; 1.2620; 1,2500 *; 1.2350 **. * Periodic level ** Range Level The material has been provided by InstaForex Company - www.instaforex.com |
| Gold as insurance against hyperinflation and driver of economic growth Posted: 12 Apr 2019 03:52 AM PDT According to analysts, the value of gold in relation to most world currencies has reached record levels. Experts call the yellow metal reliable protection against hyperinflation and focus on its key role in the global economy in the long term. Analysts believe that an illustrative example of the depreciation of the national currency is the situation in Venezuela, which is dominated by record hyperinflation, as a result of which paper money lost purchasing power. Another illustration is the galloping inflation in Turkey, where prices rose by 20% in March 2019. According to forecasts, by the end of this year, the fall of the Turkish economy could reach 3%. The current situation is favorable for the precious metal. Last week, the leading market players, market makers (literally – "market makers"), made a number of large purchases of gold. According to analysts, this fact indicates that with a price below $1300 for 1 troy ounce, precious metals will say goodbye forever. During five trading sessions, large hedgers purchased over 76 thousand contracts (1 contract = 100 ounces), or almost 295 tons of gold at a price of $1285 to $1300 for 1 troy ounce. According to experts, this is an impressive figure for one week, indicating that the value of gold will rise steadily and is unlikely to return to previous values. Market makers, active buyers of the precious metal, form this trend themselves. They buy the yellow metal at a lower price and sell on its growth. By purchasing this metal, they hedge the purchase of "short" positions on the exchange in futures and options. Large purchases of these market players mean only one thing: a further drop in prices is either limited or unlikely. Analyzing the situation on the market of the yellow metal, the experts come to the conclusion that the price of gold will continue to consolidate in the narrowing range of $ 1280- $ 1350 with an increase in local minima. According to forecasts of experts, in the second half of 2019, the precious metal will begin to rise in price. The peak price of gold should be expected in 2021 at about $1900-$2000 for 1 troy ounce. From this point on, a relatively deep correction will begin with a possible failure of the price in 2022, analysts summarize. The external geopolitical background also contributes to the formation of the cost of precious metals. In the next fifteen years, experts expect the pendulum of world leadership to swing toward Asia, and the United States will not play its former significant role. In such a transitional period, one should not hope for stability in global financial markets. Analysts do not exclude the growth of trade and money conflicts, due to which the role of gold in the global financial system will be very high. The material has been provided by InstaForex Company - www.instaforex.com |
| Simplified wave analysis and forecast for April 12 (EUR/USD, USD/JPY, GOLD) Posted: 12 Apr 2019 03:52 AM PDT EUR/USD On the chart of the pair, the last incomplete wave is descending, dated March 20. In a larger model, it forms a correction. In the structure, an intermediate rollback is nearing completion. Forecast: In the next trading session, it is expected to complete the rise and the formation of signals reversal. The lower limit of daily volatility is the support zone. Recommendations: When trading within the day, the current purchases of the pair are more reasonable to complete upon reaching the calculated reversal zone. Attention should be paid to the sell signals of the instrument. Resistance zone: - 1.1300 / 1.1330 Support zone: - 1.1210 / 1.1180 USD/JPY The rising wave of March 25 in a larger structure of scale H4 forms the final part (C). The wave continues its formation. After the correctional phase that ended 2 days ago, the price rise was expected to follow. Forecast: A preliminary calculation of the target zone of the current price increase gives the final reference in the area of the 114th figure. In the coming sessions, a short-term pullback is not excluded, not further than the lower level of the support zone. Recommendations: At the next session, sales of the pair are not relevant. Counter kickbacks are recommended to use for entry or gain of instrument purchases. Resistance zones: - 112.90 / 113.20 - 112.00 / 112.30 Support zone: - 111.60 / 111.30 GOLD The direction of short-term fluctuations in the gold rate is given by the upward wave of March 3, which is formed in the form of a standard plane. The first 2 parts (A + B) are completed, the final part (C) has been developing since April 4. Forecast: The intermediate price reduction close to completion. At the next sessions, a reversal and a change in the course of movement is expected. The target area is the resistance zone. Recommendations: Sale of gold is possible on the smallest TF reduced lot. In the area of calculated support, it is recommended to track the reversal signals in order to find the entry point to long positions. Resistance zone: - 1315.0 / 1320.0 Support zone: - 1285.0 / 1280.0 Explanations for the figures: Waves in the simplified wave analysis consist of 3 parts (A – B – C). The last unfinished wave is analyzed. Zones show areas with the highest probability of reversal. The arrows indicate the wave marking according to the method used by the author, the solid background is the formed structure, the dotted ones are the expected movements. Note: The wave algorithm does not take into account the duration of tool movements over time. The material has been provided by InstaForex Company - www.instaforex.com |
| EURUSD: Euro buyers are once again trying to "drag the blanket" to their side Posted: 12 Apr 2019 03:52 AM PDT Statements made by representatives of the Federal Reserve System had a negative impact on the US dollar, which attempted to grow against the euro and the British pound yesterday afternoon. The report on the number of Americans applying for unemployment benefits for the first time provided only temporary support for the US dollar. According to the US Department of Labor, the labor market is once again strengthening after a series of weak reports. Thus, the number of initial applications for unemployment benefits for the week from March 31 to April 6 decreased by 8,000 and amounted to 196,000. Economists had expected the number of new applications last week to be 210,000. The speeches of the various representatives of the Federal Reserve System, who were scheduled yesterday, did not support the US dollar. The head of the Federal Reserve Bank of New York, John Williams, believes that inflation is close to the Fed's target level of 2%, and unemployment is at historically low levels. Also, in his opinion, concerns about the slowdown in economic growth have weakened. The president of the Federal Reserve Bank of St. Louis, James Bullard, does not agree with him. He noted that the Fed policy is now in the right mode, and we can safely say that the Fed has completed the process of its normalization. However, further actions of the Fed in relation to rates depend on the situation in the economy. Bullard recalled that the bond market continues to give a warning sign on the economy. We are talking about the inversion of the yield curve, which was clearly visible in the early spring of this year. The head of St. Louis also believes that the Fed will again not reach the target level of inflation this year. Fed Vice Chairman Richard Clarida said in an interview that the economy is in good shape, but economic growth is slowing compared to 2018. In his opinion, the Fed will slow down the balance reduction in May and complete the reduction process in September. Let me remind you that this was first announced during a press conference by Fed Chairman Jerome Powell. As for the technical picture of the EURUSD pair, despite the Asian growth, the prospects for further recovery remain a big question. For a more confident upward movement, a breakdown and consolidation above the resistance of 1.1300 are required, which will resume the trend and give it a boost, which will lead to updating of the highs around 1.1330 and 1.1390. If trade continues in the sideways channel, support will be seen in the area of 1.1260, but a larger level is located slightly lower, in the area of 1.1230. The Canadian dollar is adjusted after yesterday's decline paired with the US dollar. Data on the cost of new homes in Canada did not affect the market, as the fall in prices in large urban centers was offset by growth in other markets. According to a report by the National Bureau of Statistics of Canada, prices in the primary housing market in February 2019 increased by only 0.1%. The material has been provided by InstaForex Company - www.instaforex.com |
| Posted: 12 Apr 2019 03:52 AM PDT 4-hour timeframe Technical details: The upper linear regression channel: direction - up. The lower linear regression channel: direction - down. Moving average (20; smoothed) - sideways. CCI: -25.2460 The GBP/USD currency pair again changed the direction of movement and fixed below the moving average line. In recent days, trading on this pair is more like a "swing". There is no trend as such. Traders clearly do not know how to respond to the Brexit shift for six months. Recall that at the end of 2018 and early 2019, everyone thought that Brexit was at the finish line. However, the reality was different. Now Britain, led by Theresa May, is likely to face new negotiations with the European Union, as the parliament flatly refused to approve the version of the "deal" that reached in negotiations with EU leaders Theresa May. Or, Theresa May will have to find new ways to help negotiate with the majority of parliamentarians. The "deal" in the form of "Parliament approves the agreement, and Theresa May resigns" also did not suit the parliament. A few months ago, it was difficult to imagine what scenario would lead Britain to leave the EU. Now it is difficult to imagine what the whole procedure will end. It is possible that the country will remain in the EU. There are no important macroeconomic publications planned for the UK today. Thus, there will be no special influence of the foundation on the movement of the currency pair. The technical picture shows a flat or at least no trend. Nearest support levels: S1 - 1.3062 S2 - 1.3031 S3 - 1.3000 Nearest resistance levels: R1 - 1.3092 R2 - 1.3123 R3 - 1.3153 Trading recommendations: The pair GBP/USD has fixed back below the moving, however, the market is now completely calm. Thus, short positions are relevant with targets at 1.3031 and 1.3000, but it is recommended to trade these targets extremely carefully. Buy positions can be considered after fixing the pair above the moving average line with targets at 1.3123 and 1.3153 and also very carefully and accurately. In addition to the technical picture should also take into account the fundamental data and the time of their release. Explanations for illustrations: The upper linear regression channel is the blue lines of the unidirectional movement. The lower linear channel is the purple lines of the unidirectional movement. CCI is the blue line in the indicator regression window. The moving average (20; smoothed) is the blue line on the price chart. Murray levels - multi-colored horizontal stripes. Heiken Ashi is an indicator that colors bars in blue or purple. The material has been provided by InstaForex Company - www.instaforex.com |
| Posted: 12 Apr 2019 03:52 AM PDT 4-hour timeframe Technical details: The upper linear regression channel: direction - down. The lower linear regression channel: direction - down. Moving average (20; smoothed) - up. CCI: 118.2649 The currency pair EUR/USD on Friday, April 12, at the Asian trading session, quite unexpectedly made a breakthrough upward and reached the resistance level of 1.1289 for the third time. However, the upward trend is still very weak, and the volatility is low. To date, the planned publication of industrial production for February in the European Union, as well as the consumer confidence index for April in the United States. It is unlikely that these data will greatly affect the behavior of the market. Most likely, the maximum – they will cause a short surge of emotions that will not go beyond the current values of volatility. Thus, the pair continues to move with a minimum upward bias and fairly frequent corrections. As we have repeatedly said, traders did not have the strength and desire to overcome the Murray level of "-1/8" – 1,1200, which is also the lower boundary of a strong area of support for the pair. At the same time, trading in the last few days clearly shows that there is no particular desire among traders to buy a currency pair. Thus, any positions on the pair are now quite impractical, since reversals occur often, and the duration of the movement in one direction is low. Nearest support levels: S1 - 1.1261 S2 - 1.1230 S3 - 1.1200 Nearest resistance levels: R1 - 1.1292 R2 - 1.1322 R3 - 1.1353 Trading recommendations: The EUR/USD currency pair has resumed its upward movement. Thus, it is now recommended to consider purchase orders with targets at 1.1292 and 1.1322. A new turn of the Heiken Ashi down indicates a new round of downward correction. Sell positions are recommended to open no earlier than fixing the pair below the moving average line with targets at 1.1230 and 1.1200. In this case, a downtrend may resume. In addition to the technical picture should also take into account the fundamental data and the time of their release. Explanations for illustrations: The upper linear regression channel is the blue lines of the unidirectional movement. The lower linear regression channel is the violet lines of the unidirectional movement. CCI - blue line in the indicator window. The moving average (20; smoothed) is the blue line on the price chart. Murray levels - multi-colored horizontal stripes. Heiken Ashi is an indicator that colors bars in blue or purple. The material has been provided by InstaForex Company - www.instaforex.com |
| Posted: 12 Apr 2019 03:52 AM PDT 4h As seen on the 4-hour chart, the EUR/USD pair rebounded from the retracement level of 61.8% (1.1281) with a fall in the direction of the Fibo level of 76.4% (1.1241), but the bullish divergence in the CCI indicator worked in favor of the European currency and the resumption of growth. As a result, the pair completed closing above the retracement level of 61.8%, and the growth of quotations can be continued on April 12 in the direction of the Fibo level of 50.0% (1.1313). The closing of the pair under the level of 61.8% can be interpreted as a reversal in favor of the US currency and expect a slight drop in the direction of the retracement level of 76.4%. The Fibo grid was built on extremums from March 7, 2019, and March 20, 2019. Daily As seen on the 24-hour chart, the pair still retains the chances of resuming the fall in the direction of the retracement level of 161.8% (1.0941), as it still cannot close above the Fibo level of 127.2% (1.1285). The retreat of quotations from this level will work in favor of the US currency and will allow expecting a fall in the direction of the retracement level of 161.8%. Fixing the pair above the Fibo level of 127.2% will allow traders to continue to grow in the direction of the retracement level of 100.0% (1.1553). The Fibo grid was built on extremes from November 7, 2017, and February 16, 2018. Trading advice: Buy deals on EUR/USD pair can be opened with the target at 1.1313 as the pair completed consolidation above the Fibo level of 61.8%. The stop loss order should be placed below the level of 1.1281. Sell deals on EUR/USD pair can be opened with the target at 1.1241 if the pair completes consolidation below the level of 61.8%. The stop loss order should be placed above the level of 1.1281. The material has been provided by InstaForex Company - www.instaforex.com |
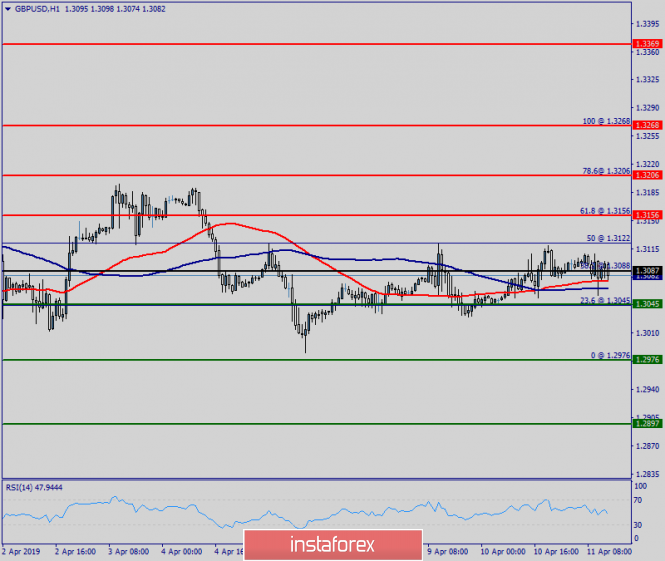
| Posted: 12 Apr 2019 03:52 AM PDT 4h As seen on the 4-hour chart, the GBP/USD pair made another rebound from the retracement level of 76.4% (1.3094) with a turn in favor of the US dollar. Thus, on April 12, the fall in quotations can be continued in the direction of the Fibo level of 61.8% (1.2969). Today, emerging divergences are not observed in any indicator. Closing the pair above the retracement level of 76.4% will allow traders to count on a further increase in the direction of the retracement level of 100.0% (1.3296). The Fibo grid is built according to the extremums of September 20, 2018, and January 3, 2019. 1h As seen on the hourly chart, the pair fell once again to the retracement level of 23.6% (1.3046) and made a reversal in favor of the British pound. As a result, the pair is growing again in the direction of the retracement level of 38.2% (1.3087). The rebound of quotes from this level of Fibo will allow traders to expect a reversal in favor of the American currency and a new fall in the direction of the retracement level of 23.6%. Closing a pair above the Fibo level of 38.2% will increase the chances of continued growth towards the next retracement level of 50.0% (1.3122). The Fibo grid is built according to the extremums of March 27, 2019, and March 29, 2019. Trading recommendations: Buy deals on GBP/USD pair can be opened with targets at 1.3122 and 1.3157 and a stop loss order under the retracement level of 38.2% if the pair closes above 1.3087 (hourly chart). Sell deals on GBP/USD pair can be opened with the target at 1.3046 and a stop loss order above the level of 38.2% if the pair bounces off the level of 1.3087 (hourly chart). The material has been provided by InstaForex Company - www.instaforex.com |
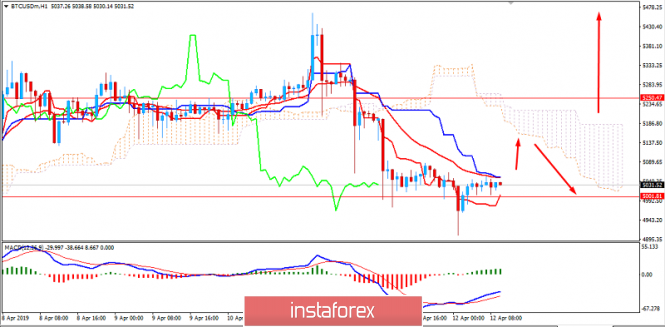
| BITCOIN Analysis for April 12, 2019 Posted: 12 Apr 2019 03:36 AM PDT Bitcoin has been trading at near $5,000 after the impulsive bearish momentum pulled the price below $5,250 recently with a daily close. The price hit an intraday low below $5,000 but it managed to regain momentum propmtly. The price is currently being held by the dynamic level of 20 EMA and Tenkan line as resistance. The price is expected to continue consolidating further moving higher towards the Kumo Cloud resistance area. The Kumo Cloud resistance has widened quite well and it is expected to contain the price as strong resistance. So, a further climb above $5,250 area is capped. In this scenario, as the price remains below $5,250, bearish pressure will determine a further price move, though analysts foresee correctional climbs and volatile price actions. Otherwise, a break above $5,250 with a daily close would also mean a break above the strong Kumo resistance, which is quite unlikely. In this case, BTC will regain the bullish momentum. SUPPORT: 4,800-80, 5,000 RESISTANCE: 5,250, 5,500 BIAS: BULLISH
|
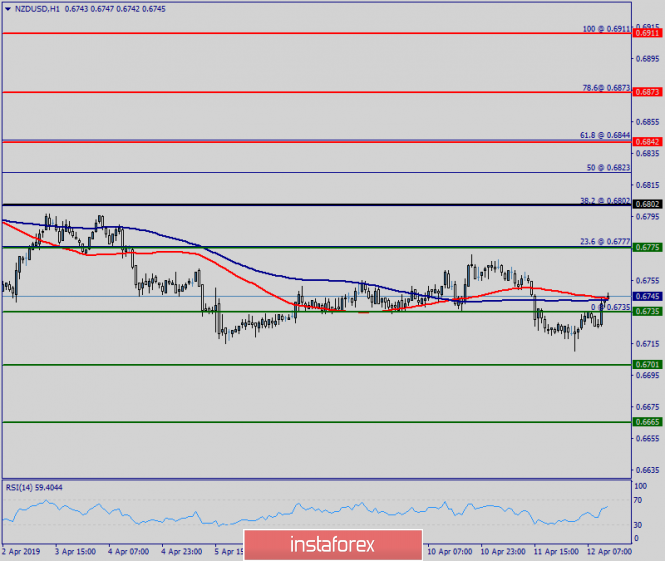
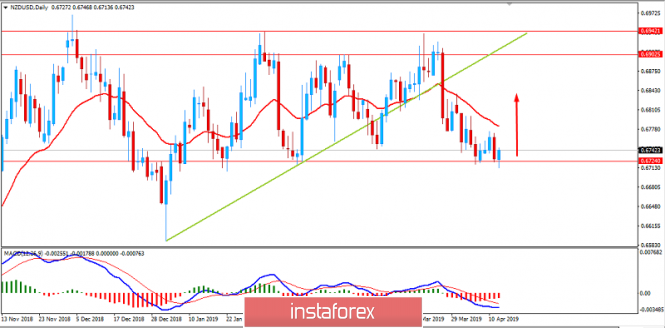
| Posted: 12 Apr 2019 03:28 AM PDT This morning was marked by the test of WCZ 1/2 0.6714-0.6707. This zone has been identified as an important target and support. The emergence of demand for this zone indicates the presence of large limit orders. Purchases after the formation of a "false breakdown" pattern must be partially consolidated after absorbing the fall of Thursday. The rest can be moved to breakeven and left for next week. Until there has been a violation of the downward impulse, the work is carried out within the medium-term accumulation zone. The main target for growth is WCZ 1/2 0.6787-0.6780. A cancellation of the upward movement will occur if the closure of today's US session occurs below the level of 0.6707. This will speak about the emergence of a large market seller who will be able to disassemble limit purchase orders located within the WCZ 1/2. Daily CZ - daily control zone. The zone formed by important data from the futures market, which change several times a year. Weekly CZ - weekly control zone. The zone formed by the important marks of the futures market, which change several times a year. Monthly CZ - monthly control zone. The zone, which is a reflection of the average volatility over the past year. The material has been provided by InstaForex Company - www.instaforex.com |
| Technical analysis of AUD/USD for April 12, 2019 Posted: 12 Apr 2019 03:26 AM PDT The AUD/USD pair is set above strong support at the levels of 0.7046 and 0.7168. This support has been rejected four times confirming the uptrend. Hence, the major support is seen at the level of 0.7046, because the trend is still showing strength above it. Accordingly, the pair is still in the uptrend in the area of 0.7046 and 0.7168. The AUD/USD pair is trading in the bullish trend from the last support line of 0.7112 towards thae first resistance level of 0.7168 in order to test it. This is confirmed by the RSI indicator signaling that we are still in the bullish trending market. Now, the pair is likely to begin an ascending movement to the point of 0.7168 and further to the level of 0.7290. The level of 0.7389 will act as the major resistance and the double top is already set at the point of 0.7389. At the same time, if there is a breakout at the support levels of 0.7112 and 0.7046, this scenario may be invalidated. Overall, however, we still prefer the bullish scenario. The material has been provided by InstaForex Company - www.instaforex.com |
| Technical analysis of NZD/USD for April 12, 2019 Posted: 12 Apr 2019 03:23 AM PDT The NZD/USD pair is showing signs of strength following a breakout of the highest level of 0.6765. On the H1 chart, the level of 0.6765 coincides with 23.6% of Fibonacci, which is expected to act as minor support today. Since the trend is above the 23.6% Fibonacci level, the market is still in an uptrend. But, major support is seen at the level of 0.6735. Furthermore, the trend is still showing strength above the moving average (100). Thus, the market is indicating a bullish opportunity above the above-mentioned support levels, for that the bullish outlook remains the same as long as the 100 EMA is headed to the upside. Therefore, strong support will be found at the level of 0.6735 providing a clear signal to buy with a target seen at 0.6842. If the trend breaks the minor resistance at 0.6842, the pair will move upwards continuing the bullish trend development to the level 0.6911 in order to test the double top. The material has been provided by InstaForex Company - www.instaforex.com |
| Fundamental Analysis of GBPJPY for April 12, 2019 Posted: 12 Apr 2019 03:16 AM PDT The 6-month delay in Brexit did help the UK economy to avoid a sudden shock which had been expected recently. Obviously, the British parliament's political indecisiveness lead to certain weakness. However, the country will recover after the Brexit issue is solved. Of course, the deadline extension is not totally relieving, but it will give lawmakers some time to think and tackle the situation. When the UK starts negotiations about its future trade relations with the EU, tensions are going to get more intense. Instability and uncertainty will continue to weigh down Europe's economy, especially if the United Kingdom contests the EU elections. Recently, the UK GDP report was published with a decrease to 0.2% as expected from the previous value of 0.5% and Manufacturing Production dropped to 0.9% from the previous value of 1.1%, yet it managed to surpass the expected value of 0.2%. Despite the worse economic reports, GBP managed to sustain its bullish momentum against JPY which is expected to continue in the coming days. On the other hand, Japan became a victim of the recent global imbalances such as the US-China trade war, BREXIT issues, and global economic slowdown. These factors especially affected the country's export sector, the major support for the Japanese economy. Japan has recently called on G20 to strengthen coordination for taking on the potential risks on the global economy and finding the best way to handle them. Bank of Japan appreciates the gradual growth of the country's economy. However, there are concerns that external pressures might cause significant fallout. Therefore, the G20 meeting's outcome is very important. Today's the M2 Money Stock remained unchanged at 2.4% as it was expected. Although, it did not help JPY to regain momentum over GBP indicating the weakness of the yen. Now, let us look at the technical view. The price is currently pushing higher after the recent bounce of the 145.00 support area which is expected to lead the price higher towards 149.50-150.00 resistance area before any bearish intervention is observed. The bearish intervention is likely to occur in the coming days, while the price remains below 150.00 area. |
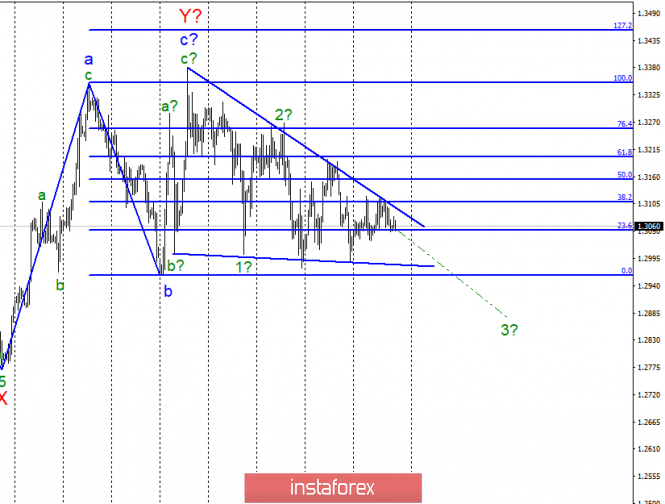
| Wave analysis of GBP / USD for April 12. Brexit moved, the pair remains in the triangle Posted: 12 Apr 2019 02:54 AM PDT
Wave counting analysis: On April 11, the GBP / USD pair lost a few dozen base points, and again this is not enough for the instrument to leave the limits of the narrowing triangle. Now, we can assume that the pair will again fall to its lower line. However, in the coming days, the instrument still has to leave the triangle, since there is simply no other option. Based on the current wave marking, it is still assumed to build a downward wave as part of a downward trend. The news background for the couple is now neutral, since Brexit was postponed for 6 months and, accordingly, no major decisions were made. Purchase goals: 1.3350 - 100.0% Fibonacci 1.3454 - 127.2% Fibonacci Sales targets: 1.2961 - 0.0% Fibonacci General conclusions and trading recommendations: Wave pattern involves the construction of a downward trend. However, as long as the pair makes a successful attempt to break through one of the lines of the triangle, the bidding will take place inside it. The news background today is likely to be absent, and I expect the tool to fall to the bottom line of the triangle. A successful attempt to break through the top line will be a strong enough signal for small purchases. The material has been provided by InstaForex Company - www.instaforex.com |
| Fundamental Analysis of NZD/USD for April 12, 2019 Posted: 12 Apr 2019 02:48 AM PDT USD has been holding the upper hand in the pair while NZD is struggling to gain momentum. Despite strong yesterday's CPI and PPI reports from the US, USD failed to increase the bearish impulsive pressure over NZD which caused the pair's correction and volatility in the market. The Reserve Bank of New Zealand proposed to increase the amount of capital requirements for every bank to make sure that they can survive financial and economic shocks. The news affected market sentiment on NZD. Thus, it lost ground across the board due to such a scenario. The New Zealand Governor mentioned the sensibility and efficiency of monetary policy as one of the critical measures to provide resilience of the domestic economy. The quarterly Unemployment rate of NZD increased from 4% to 4.3% in the last quarter of 2018. Besides, CPI dropped from 0.9% to 0.1%. Today Business New Zealand Manufacturing Index report was published with a decline to 51.9 from the previous figure of 53.4 and Visitor Arrivals contracted further to -1.5% from the previous negative value of -0.3%. The downbeat economic data subdued NZD gains but it managed to sustain momentum above 0.6700 area. On the other hand, Federal Reserve Chairman Jerome Powell recently stated that the central bank's decision could be ajusted to global geopolitical risks. Citing the poicymaker, monetary policy decisions would be taken by the central bank only without any government interference. The US Consumer Price Index ex Food & energy dropped from 2.1% to 2.0%. Core CPI increased from 1.5% to 1.9% amid the ongoing rally of oil prices. Today Prelim UoM Consumer Sentiment report is going to be published which is expected to decrease marginally to 98.1 from the previous figure of 98.4 and Import Price is expected to decrease to 0.4% from the previous value of 0.6%. Now let us look at the technical view. The price is currently trading higher after impulsive bearish pressure with a daily close yesterday off the 0.6700 area. The price is currently expected to climb higher as 0.6700 has proved itself as reliable support earlier a few times. As the price remains above 0.6700 with a daily close, the pair is going to trade under bullish pressure in the coming days.
|


| You are subscribed to email updates from Forex analysis review. To stop receiving these emails, you may unsubscribe now. | Email delivery powered by Google |
| Google, 1600 Amphitheatre Parkway, Mountain View, CA 94043, United States | |
No comments:
Post a Comment