
Forex analysis review |
- USD/CAD approaching support, potential bounce!
- Fractal analysis of major currency pairs on April 15
- XAG/USD approaching support, potential bounce!
- USD/JPY approaching resistance, potential drop!
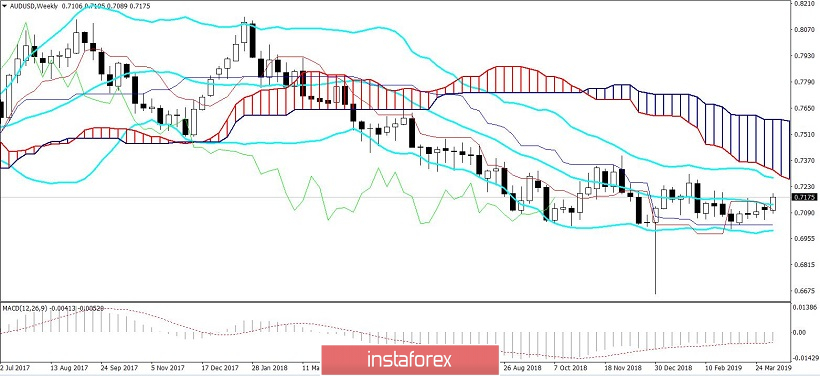
- AUD/USD: positive from China, Vale's tragedy and the weakening greenback
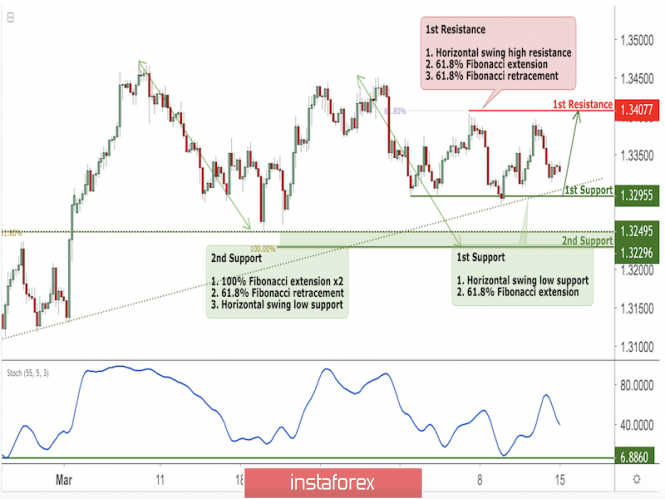
| USD/CAD approaching support, potential bounce! Posted: 14 Apr 2019 07:03 PM PDT USDCAD is approaching our first support at 1.3295 (horizontal swing low support, short term ascending line) where a strong bounce might occur above this level pushing price up to our first resistance level at 1.3407 (horizontal swing high resistance, 61.8% Fibonacci extension , 61.8% Fibonacci retracement ). Stochastic is also approaching support where we might see a corresponding bounce in price.
|
| Fractal analysis of major currency pairs on April 15 Posted: 14 Apr 2019 06:40 PM PDT Forecast for April 15 : Analytical review of H1-scale currency pairs: For the euro / dollar pair, the key levels on the H1 scale are: 1.1370, 1.1352, 1.1327, 1.1291, 1.1280 and 1.1259. Here, we continue to follow the development of the ascending structure from April 2. Continuation of the movement to the top is expected after the breakdown of the level of 1.1327. In this case, the goal is 1.1352. For the potential value for the top, we consider the level of 1.1370. After reaching which, we expect a consolidation in the range of 1.1370 - 1.1352, as well as a possible rollback to correction. Short-term downward movement is possible in the range of 1.1291 - 1.1280. The breakdown of the latter value will lead to a prolonged correction. Here, the target is 1.1259. This level is the key support for the top. The main trend is the ascending structure of April 2. Trading recommendations: Buy 1.1328 Take profit: 1.1350 Buy 1.1354 Take profit: 1.1370 Sell: 1.1290 Take profit: 1.1280 Sell: 1.1278 Take profit: 1.1262 For the pound / dollar pair, the key levels on the H1 scale are: 1.3189, 1.3123, 1.3088, 1.3027, 1.2984, 1.2959, 1.2924 and 1.2876. Here, the price has entered an equilibrium state. Continuation to the bottom is possible after breakdown of the level of 1.3027. In this case, the first target is 1.2984. Short-term downward movement is expected in the range of 1.2984 - 1.2959. The breakdown of the latter value will lead to the movement to the level of 1.2924, wherein we expect a consolidation near this value. For the potential value for the bottom, we consider the level of 1.2876, from which we expect the departure of a correction. Short-term upward movement is possible in the range of 1.3088 - 1.3123. The breakdown of the latter value will have to develop an upward trend. Here, the first potential target is 1.3189. The main trend is the equilibrium situation. Trading recommendations: Buy: 1.3090 Take profit: 1.3120 Buy: 1.3124 Take profit: 1.3187 Sell: 1.3025 Take profit: 1.2987 Sell: 1.2984 Take profit: 1.2960 For the dollar / franc pair, the key levels on the H1 scale are: 1.0110, 1.0080, 1.0065, 1.0040, 1.0012, 0.9998 and 0.9975. Here, we continue to follow the development of the upward cycle of March 27. At the moment, the price is in the correction. Continuation of the movement to the top is expected after the breakdown of the level of 1.0040. In this case, the goal is 1.0065. Meanwhile, in the range of 1.0065 - 1.0080, there is a short-term upward movement, as well as a consolidation. We consider the level of 1.0110 to be a potential value for the top. Upon reaching this level, we expect a rollback to the bottom. Short-term downward movement is possible in the range of 1.0012 - 0.9998. The breakdown of the last value will lead to a prolonged correction. Here, the target is 0.9975. This level is a key support for the top. The main trend - the ascending structure of March 27. Trading recommendations: Buy : 1.0040 Take profit: 1.0065 Buy : 1.0066 Take profit: 1.0080 Sell: 1.0012 Take profit: 0.9998 Sell: 0.9996 Take profit: 0.9975 For the dollar / yen pair, the key levels on the scale are : 113.06, 112.88, 112.57, 112.34, 112.17, 111.87, 111.74 and 111.48. Here, we are following the development of the ascending structure from April 10. Short-term upward movement is expected in the range of 112.17 - 112.34. The breakdown of the latter value will lead to the movement to the level of 112.57, near which, we expect a consolidation. On the other hand, breakdown of the level of 112.60 should be accompanied by a pronounced upward movement. Here, the goal is 112.88. For the potential value for the top, we consider the level of 113.06. After reaching which, we expect a consolidation, as well as a rollback to the correction. Short-term downward movement is possible in the range of 111.87 - 111.74. The breakdown of the latter value will lead to a prolonged correction. Here, the goal is 111.50. This level is a key support for the upward structure. The main trend: the ascending structure of April 10. Trading recommendations: Buy: 112.17 Take profit: 112.32 Buy: 112.36 Take profit: 112.55 Sell: 111.87 Take profit: 111.75 Sell: 111.72 Take profit: 111.55 For the Canadian dollar / US dollar pair, the key levels on the H1 scale are: 1.3509, 1.3479, 1.3438, 1.3421, 1.3401, 1.3374, 1.3322, 1.3306 and 1.3283. Here, the price is close to the abolition of the ascending structure of April 9, for which a breakdown of the level of 1.3306 is necessary. In this case, the first potential target is 1.3283. We expect a resumption of the upward movement after the breakdown of the level of 1.3374. Here, the first target is 1.3401, the breakdown of which will allow us to count on the movement towards the level of 1.3421, wherein there is consolidation of the price near this level. The price pass of the noise range of 1.3421 - 1.3438 which should be accompanied by a pronounced upward movement. Here, the target is 1.3479, wherein consolidation is near this level. For the potential value for the top, we consider the level of 1.3509. After reaching which, we expect a rollback to the bottom. The main trend is the formation of the upward potential of April 9, the stage of deep correction. Trading recommendations: Buy: 1.3374 Take profit: 1.3400 Buy : 1.3403 Take profit: 1.3420 Sell: 1.3322 Take profit: 1.3306 Sell: 1.3303 Take profit: 1.3285 For the Australian dollar / US dollar pair, the key levels on the H1 scale are : 0.7250, 0.7220, 0.7209, 0.7195, 0.7161, 0.7149, 0.7133 and 0.7115. Here, we determined the subsequent targets for the top from the local ascending structure on April 11. Continuation of the movement to the top is expected after the breakdown of the level of 0.7195. In this case, the goal is 0.7209, wherein a price consolidation is near this level. The price pass of the noise range of 0.7209 - 0.7220 will make it possible to count on movement towards a potential target of 0.7250. From this level, we expect a rollback to the bottom. Short-term downward movement is possible in the range of 0.7161 - 0.7149. The breakdown of the latter value will lead to an in-depth correction. Here, the target is 0.7133. This level is the key support for the top. The main trend is the local structure for the top of April 11. Trading recommendations: Buy: 0.7195 Take profit: 0.7209 Buy: 0.7220 Take profit: 0.7250 Sell : 0.7160 Take profit : 0.7152 Sell: 0.7147 Take profit: 0.7136 For the euro / yen pair, key levels on the H1 scale are: 127.58, 127.16, 126.95, 126.77, 126.38, 126.18 and 125.89. Here, we are following the development of the ascending structure from April 10. Short-term movement to the top is expected in the range of 126.77 - 126.95. The breakdown of the latter value will lead to the movement to the level of 127.16, near which, we expect a consolidation. We consider the level of 127.58 as a potential value for the top, to which we expect a movement, after the breakdown of the level of 127.18. Short-term downward movement is possible in the range of 126.38 - 126.18. The breakdown of the latter value will lead to a prolonged correction. In this case, the target is 125.90. This level is a key support for the top. The main trend is the ascending structure of April 10. Trading recommendations: Buy: 126.77 Take profit: 126.95 Buy: 126.97 Take profit: 127.16 Sell: 126.38 Take profit: 126.20 Sell: 126.14 Take profit: 125.90 For the pound / yen pair, the key levels on the H1 scale are : 147.80, 147.54, 147.13, 146.81, 146.37, 146.12 and 145.64. Here, we are following the development of the ascending structure of April 9. Continuation of the movement to the top is expected after the breakdown of the level of 146.81. In this case, the goal is 147.13, wherein there is a price consolidation near this level. The breakdown of the level 147.13 should be accompanied by a pronounced upward movement. Here, the potential target is 147.80. Upon reaching this level, we expect a consolidation in the range of 147.54 - 147.80, as well as a rollback to the correction. Short-term downward movement is possible in the range of 146.37 -146.12. The breakdown of the latter value will lead to a prolonged correction. Here, the target is 145.64. This level is a key support for the top. The main trend is the ascending structure of April 9. Trading recommendations: Buy: 146.81 Take profit: 147.11 Buy: 147.18 Take profit: 147.54 Sell: 146.35 Take profit: 146.12 Sell: 146.08 Take profit: 145.70 The material has been provided by InstaForex Company - www.instaforex.com |
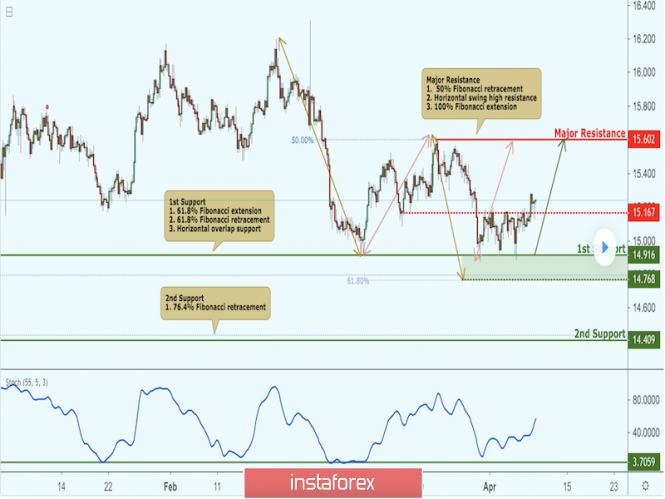
| XAG/USD approaching support, potential bounce! Posted: 14 Apr 2019 06:39 PM PDT XAGUSD is approaching our first support at 14.91 (61.8% Fibonacci extension , 61.8% Fibonacci retracement , Horizontal overlap support) where a strong bounce might occur above this level to our major resistance at 15.60 (100% Fibonacci extension , 50% Fibonacci retracement , Horizontal swing high resistance). Stochastic is also approaching support where we might see a corresponding bounce in price. Trading CFDs on margin carries high risk. Losses can exceed the initial investment so please ensure you fully understand the risks.
|
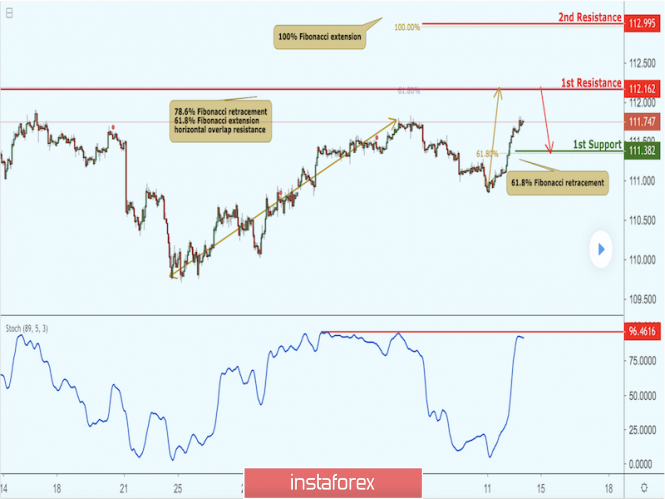
| USD/JPY approaching resistance, potential drop! Posted: 14 Apr 2019 06:37 PM PDT USDJPY is approaching our first resistance at 112.16 (78.6% Fibonacci retracement , 61.8% Fibonacci extension , horizontal overlap resistance) where a strong drop might occur below this level pushing price down to our major support at 111.38 (61.8% Fibonacci retracement ). Stochastic (89,5,3) is also approaching resistance and we might see a corresponding drop in price. Trading CFDs on margin carries high risk. Losses can exceed the initial investment so please ensure you fully understand the risks.
|
| AUD/USD: positive from China, Vale's tragedy and the weakening greenback Posted: 14 Apr 2019 03:59 PM PDT The Australian dollar ended the trading week on a positive note: together with the American currency, it updated its two-month high, reaching 0.7175. This dynamic is partly due to the greenback's weakness, but the aussie has its own arguments for growth. In general, any more or less large-scale growth of AUS/USD should be treated with caution: as a rule, the pair hits the ceiling of the price range and then pulls back. But there is also an alternative option in which the pair changes the price niche - most often in the outline of the current trend or completely changing the price direction on a global scale (which happens much less often). Since December last year, the AUD/USD has been fluctuating in a fairly wide price range - 0.70-0.7250. Both bears and bulls of the pair repeatedly tried to break through the boundaries of this aisle, but all these attempts have failed. The fundamental background is too controversial for investors to undoubtedly give preference to an increase or a decline. Nevertheless, the struggle for influence continues, and eventually one of the parties will prevail: either the sellers will consolidate in the area of 0.69 and below, or the buyers will return the pair to the range of 0.73-0.75 (0.7580 to be more precise ). At the end of last week, the aussie made a "serious bid to win," nearly rising to the boundaries of the 72nd figure. A dilemma arises: either to sell the pair from current levels or "invest" in growth, given the possible end of the trade war between the United States and China. The question is really difficult, since the Australian dollar is very sensitive to the news background regarding the prospects for US-China relations. If Beijing and Washington reach the finish line of negotiations, it will help the AUD/USD bulls to reverse the situation and gain a foothold in the 73rd figure, with the intention of further growth. In spite of that, the upward impulse from Friday was not bound by the topic of trade negotiations. The pair grew due to the general interest of traders to risky assets, as well as due to the weakening of the dollar amid growing commodity markets. Anti-risk sentiment significantly declined due to the postponement of Brexit, as well as progress in negotiations between the United States and China. In addition, the Chinese data was pleasing: first, exports in dollar terms rose by 14% in March after a substantial decrease of 20% in the previous month. In addition, the volume of bank lending has also significantly increased: last month, this figure doubled compared with the previous period, reaching almost 1.7 trillion yuan (ie, 251 billion dollars). Imports somewhat disappointed (the figure in March decreased by 7.6% compared with 5.2% in February). But there is one point worth noting: in March, China increased imports of soybeans by 10%. This is important in the context of the US-China trade negotiations. Let me remind you that at the beginning of this year, Beijing agreed to increase the purchase of American agricultural products - primarily soybeans, corn and wheat, totaling $ 30 billion. The final volumes should exceed even those figures that were before the start of the trade war. The March figures show that the Chinese are fulfilling their commitments - at least in this part. In other words, the release of Chinese data complemented the optimistic fundamental picture and supported commodity currencies, including the Australian dollar. In addition, the Australian felt the support and the growth of the commodity market, in particular copper and iron ore. Unfortunately, this trend is due to the tragic events. Let me remind you that at the end of January, there was a breakthrough of the dam of the Corrego de Feijao mine in Brazil, which belongs to the Vale company. Waste from the mining and processing complex flooded the nearby municipality, killing more than 200 people. Such incidents have consequences – including economic ones. At the end of March, the Brazilian court froze the company's assets worth more than four billion dollars, thus covering the potential costs of compensation, salaries and other unforeseen expenses. The commodity market responded instantly: for the first time in a long time, the cost of a ton of iron ore exceeded the $90 mark (now it is trading at $95 per ton). The fact is that the Brazilian company Vale and the Australian Rio Tinto and BHP Billiton are the largest mining companies in the world (actually monopolists of the market) - and have devalued the value of iron ore for a long time. As a result, supply exceeded demand (primarily due to China and the slowing of the global economy), putting indirect pressure on the Australian dollar. But now the situation has changed - one of the "three whales" of the market actually dropped out of the game, and therefore the cost of iron ore has increased dramatically. Copper also demonstrates positive dynamics, reacting to positive signals from China. Thus, the AUD/USD pair has the potential for further growth. On the daily chart, the pair is at the top of the Bollinger Bands indicator and above all the lines of the Ichimoku indicator: this indicates the priority of an upward movement. To determine the resistance level, let's move to the weekly timeframe. As you can see, the strongest resistance level here is the mark of 0.7280 - at this price point the upper line of the Bollinger Bands indicator coincides with the lower boundary of the Kumo cloud on W1. In other words, the Aussie has a 100-point price gap for its growth, but when the pair approaches the mark of 0.7280, you will need to be careful with long positions. The material has been provided by InstaForex Company - www.instaforex.com |


| You are subscribed to email updates from Forex analysis review. To stop receiving these emails, you may unsubscribe now. | Email delivery powered by Google |
| Google, 1600 Amphitheatre Parkway, Mountain View, CA 94043, United States | |
No comments:
Post a Comment