
Forex analysis review |
- April 18, 2019 : GBP/USD Intraday technical analysis and trade recommendations.
- April 18, 2019 : EUR/USD Short-term outlook has turned into bearish.
- Bitcoin is about to drop - Analysis for April 18,2019
- EUR./USD analysis for April 18, 2019
- Gold analysis for April 18, 2019
- Technical analysis of GBP/USD for April 18, 2019
- Technical analysis of EUR/USD for April 18, 2019
- USD/SGD Fundamental Analysis for April 18, 2019
- EUR/USD, GBP/USD, USD/JPY. Simplified wave analysis and forecast for April 18
- Fractal analysis of major currency pairs for April 18
- The sharp rise in oil prices can bring down the market
- Wave analysis of GBP/USD for April 18. Waiting for a breakthrough of 1.2960, this will relieve tension from the market
- Wave analysis of EUR/USD for April 18. The euro fell, but retains an upward set of waves
- GBP/USD. April 18th. The trading system "Regression Channels". Donald Tusk "for" the abolition of Brexit
- EUR/USD. April 18th. The trading system "Regression Channels". The euro under the influence of the news may start falling
- Analysis of EUR/USD divergence for April 18. The euro is is inclined to rise a little more than to fall
- Analysis of GBP/USD divergences for April 18th. New bearish divergence is pushing pound down
- EUR / USD: Euro buyers urgently need to correct the situation
- Daily review of Indicator analysis for GBP / USD pair on April 18, 2019
- Daily review of Indicator analysis for EUR / USD pair on April 18, 2019
- Foreign exchange markets will continue to balance in the "sideways": EUR / USD and USD / CAD sales on growth
- AUD / USD: Australian ignores important releases and positive for China
- EUR / USD plan for the European session on April 18. All attention to eurozone reports
- GBP / USD plan for the European session on April 18. Bears continue to put pressure on the British pound
- Trading Plan for EUR / USD and GBP / USD pairs on 04/18/2019
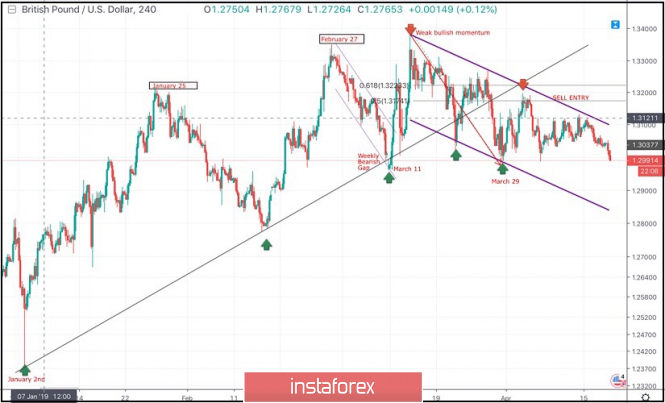
| April 18, 2019 : GBP/USD Intraday technical analysis and trade recommendations. Posted: 18 Apr 2019 09:48 AM PDT
On January 2nd, the market initiated the depicted uptrend line around 1.2380. This uptrend managed to initiate two successive bullish waves towards 1.3200 (Jan. 25) then 1.3350 (Feb. 27) before the bearish pullback brought the GBPUSD pair towards the uptrend on March 8th. A weekly bearish gap pushed the pair below the uptrend line (almost reaching 1.2960) before the bullish breakout above short-term bearish channel was achieved on March 11. Shortly after, the GBPUSD pair demonstrated weak bullish momentum towards 1.3200 then 1.3360 where the GBPUSD failed to achieve a higher high above the previous top achieved on February 27. Instead, the depicted recent bearish channel was established. Significant bearish pressure was demonstrated towards 1.3150 - 1.3120 where the depicted uptrend line failed to provide any bullish support leading to obvious bearish breakdown. On March 29, the price levels of 1.2980 (the lower limit of the depicted movement channel) demonstrated significant bullish rejection. This brought the GBPUSD pair again towards the price zone of (1.3160-1.3180) where the upper limit of the depicted bearish channel as well as the backside of the depicted uptrend line came to meet the pair. Bearish rejection was anticipated around the mentioned price levels (1.3140-1.3170). However, the GBPUSD bullish pullback failed to pursue towards the mentioned zone. Instead, significant bearish rejection was demonstrated earlier around the price level of 1.3120. Hence, Short-term outlook has turned into bearish towards 1.2920-1.2900 where the lower limit of the depicted channel is located. Trade Recommendations: Any bullish pullback towards 1.3120-1.3140 should be considered for another SELL entry. TP levels to be located around 1.3100, 1.3020 then 1.2950 - 1.2920.S/L to be located above 1.3170. The material has been provided by InstaForex Company - www.instaforex.com |
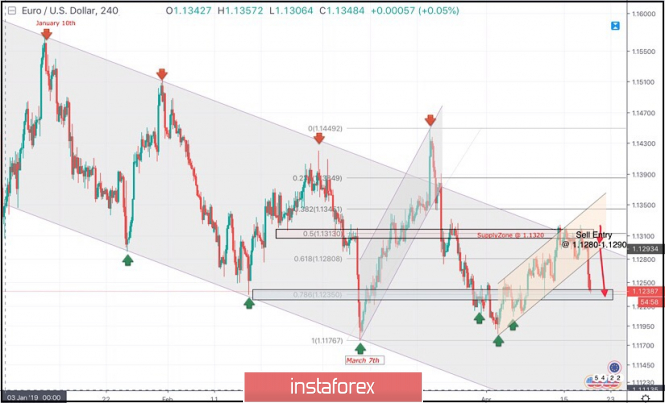
| April 18, 2019 : EUR/USD Short-term outlook has turned into bearish. Posted: 18 Apr 2019 09:26 AM PDT
On January 10th, the market initiated the depicted bearish channel around 1.1570. Since then, the EURUSD pair has been moving within the depicted channel with slight bearish tendency. On March 7th, recent bearish movement was demonstrated towards 1.1175 (channel's lower limit) where significant bullish recovery was demonstrated. Bullish persistence above 1.1270 enhanced further bullish advancement towards 1.1290-1.1315 (the Highlighted-Zone) which failed to provide adequate bearish pressure. On March 18, a significant bullish attempt was executed above 1.1380 (the upper limit of the Highlighted-channel) demonstrating a false/temporary bullish breakout. On March 22, significant bearish pressure was demonstrated towards 1.1280 then 1.1220. Two weeks ago, a bullish Head and Shoulders reversal pattern was demonstrated around 1.1200. As expected, this enhanced further bullish advancement towards 1.1300-1.1315 (supply zone) where recent bearish rejection was being demonstrated. Short-term outlook turned to become bearish towards 1.1280 (61.8% Fibonacci) followed by further bearish decline towards 1.1235 (78.6% Fibonacci). For Intraday traders, the current price zone around 1.1235 (78.6% Fibonacci) stands as a prominent demand area to be watched for a possible short-termBUY entry. However, conservative traders should be waiting for a bullish pullback towards 1.1280-1.1290 (backside of the broken bullish channel) for a valid SELL entry. Moreover, a bearish breakdown below 1.1235 is mandatory to allow further bearish decline towards 1.1180-1.1170. Trade recommendations : A valid SELL entry can be taken around the price zone of 1.1280 - 1.1290 when a bullish pullback occurs. TP levels to be located around 1.1250, 1.1235 and 1.1170. SL should be placed above 1.1320. The material has been provided by InstaForex Company - www.instaforex.com |
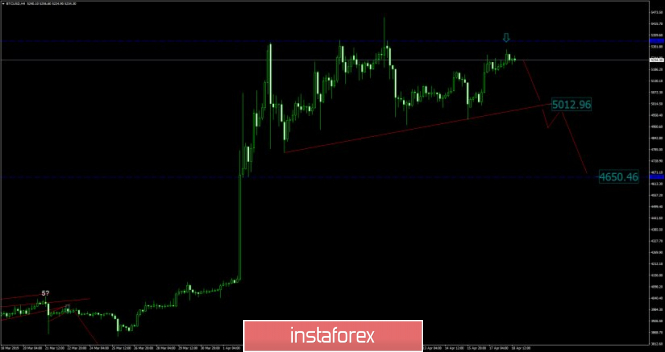
| Bitcoin is about to drop - Analysis for April 18,2019 Posted: 18 Apr 2019 07:43 AM PDT Cryptocurrency exchange Coinbase is expanding crypt-to-crypto conversions and trading services to 11 more countries. The San Francisco-based firm announced the news in a blog post on Wednesday, saying that customers in Argentina, Mexico, Peru, Colombia, Chile, India, Hong Kong, South Korea, Indonesia, the Philippines and New Zealand can now access crypt-to-crypto exchanging services. Even there are some positive news around Bitcoin the price action confirms that indecision is present for months. Technical picture:
Our analysis from yesterday is still valid. According to the H4 time-frame, we found that there is rounding top formation in creation, which is sign that BTC is under the distribution process. Probably some bigger traders are looking to sell larger amount so the distribution is underway. Support at the price of $4.900 is very important for swing traders since the breakout of this level may confirm downward movement. Key resistance is seen at the price of $5.445.
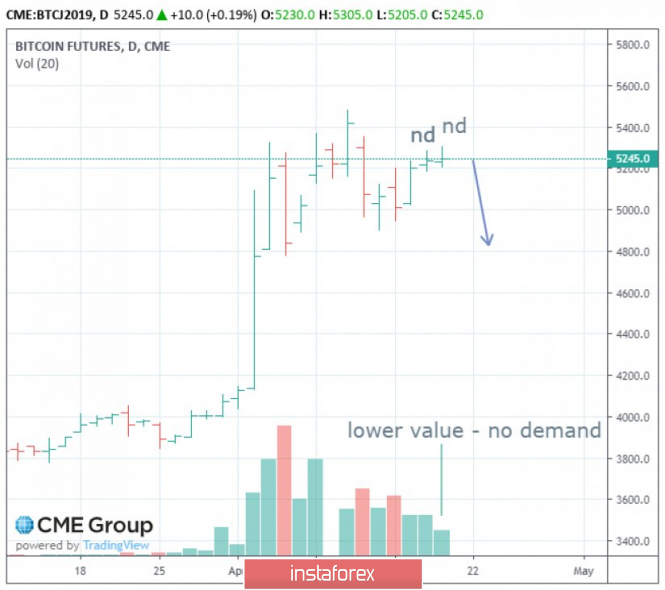
On the Futures market we found that after the strong push higher in the background and climatic action, there is another day with decreasing in the volume on the upside, which is sign that there is no big interest on the upside so selling may be a good option going further. Pay attention on the supports at $4.646 and $4.130, since these levels may be a very good levels to scale out our potential sell positions. The material has been provided by InstaForex Company - www.instaforex.com |
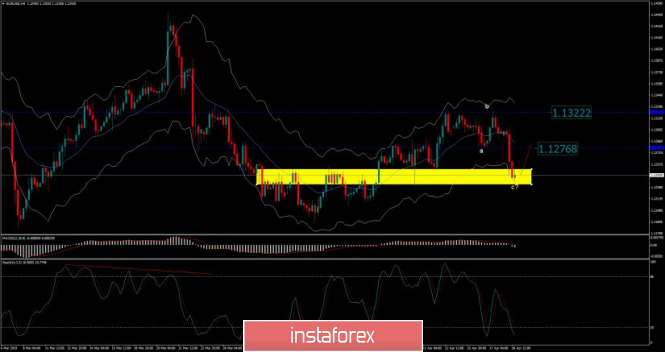
| EUR./USD analysis for April 18, 2019 Posted: 18 Apr 2019 07:31 AM PDT EUR/USD has been trading downwards. The price tested the level of 1.1234. Potential oversold condition on the EUR/USD.
According to the H4 time-frame, we found that there is the bullish divergence on the 3/10 oscillator, which is sign that selling looks risky. We also found that EUR/USD did rejection from the very strong support (blue shape) at the price of 1.1245, which adds more potential strength on the EUR. Stochastic is in oversold condition and selling would be bad idea at this stage. Support levels are seen at the price of 1.1228 and 1.1210. Resistance levels are seen at 1.1276 and 1.1322. Our recommendation: Watch for potential buying opportunities. Upward targets are set at the price of 1.1276 and 1.1322. The material has been provided by InstaForex Company - www.instaforex.com |
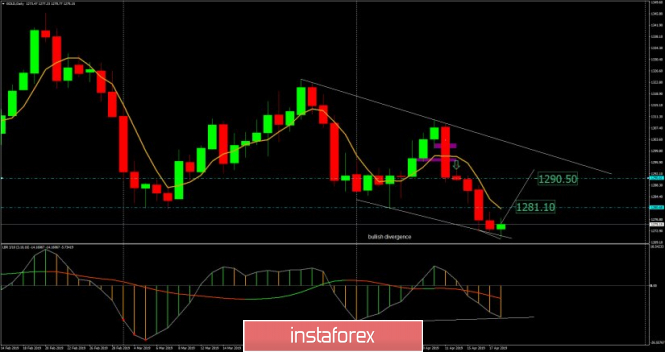
| Gold analysis for April 18, 2019 Posted: 18 Apr 2019 07:19 AM PDT Gold has been trading downwards. The price tested the level of $1.270.77. Anyway, we expect potential bullish correction and upward momentum.
According to the daily time-frame, we found that there is the bullish divergence on the 3/10 oscillator, which is sign that selling looks risky. We also found that Gold didn't correct upward for 5 days and we should expect some up days in the next period. Key resistance level and upward target is seen at the price of $1.290.50. Key support level for now is set at $1.271.00. Our recommendation: Watch for potential buying opportunities on the dips. Upward targets are set at $1.281.10 and $1.290.00. Protective stop can be placed below $1.270.00. The material has been provided by InstaForex Company - www.instaforex.com |
| Technical analysis of GBP/USD for April 18, 2019 Posted: 18 Apr 2019 06:51 AM PDT |
| Technical analysis of EUR/USD for April 18, 2019 Posted: 18 Apr 2019 06:40 AM PDT Overview: The EUR/USD pair continues to move downwards from the level of 1.1280. Yesterday, the pair dropped from the level of 1.1280 to the bottom around 1.1225. Today, the first resistance level is seen at 1.1280 followed by 1.1310, while daily support 1 is seen at 1.1179. According to the previous events, the EUR/USD pair is still moving between the levels of 1.1280 and 1.1180; for that we expect a range of 102 pips. If the EUR/USD pair fails to break through the resistance level of 1.1280, the market will decline further to 1.1179. This would suggest a bearish market because the RSI indicator is still in a positive area and does not show any trend-reversal signs. The pair is expected to drop lower towards at least 1.1137 with a view to test the second support. On the other hand, if a breakout takes place at the resistance level of 1.1280 (the double top), then this scenario may become invalidated. The material has been provided by InstaForex Company - www.instaforex.com |
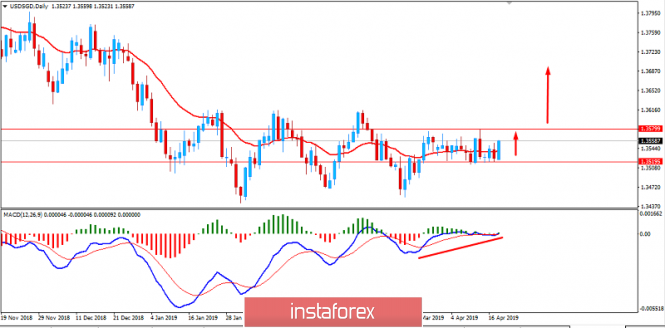
| USD/SGD Fundamental Analysis for April 18, 2019 Posted: 18 Apr 2019 06:04 AM PDT USD/SGD started a bearish trend after the MAS meeting where SGD became 1.6% stronger than USD in October 2018 to 1.9% stronger than USD as at end-March 2019. At the last MAS meeting, the Central bank acknowledged that the domestic economy has eased a pace of growth. The economy is likely to expand at a modest pace in the coming quarters. Core inflation has deccelerated more than expected due to the recent fall in oil prices and a stronger impact from the liberalization of the retail electricity market. Therefore, core inflation is assumed to be between 1% to 2%. Gross Domestic Product (GDP) growth would come in slightly below the mid-point of 1.5–3.5%. Core inflation, including prices of accommodation and private road transport, fell to 1.6% year-on-year in January–February 2019, from 1.8% in Q4 2018. The Singapore Retail Sales declined from 0.2% to -1.5% and GDP decreased from 1.9% to 1.3%. The foreign reserve remains the same. The economic data and the central bank's outlook indicate that the SGD will be weaker than USD in the short term. Thus, the USD/SGD pair might gain bullish momentum. On the other hand, the US consumer price index rose from 1.5% to 1.9% while the consumer price ex-food & energy dropped in March. Producer price index increased from 0.1% to 0.6% and the Michigan Consumer sentiment decreased from 98.4% to 96.9%. Average hourly earnings for all employees rose 3.4% over the 12 months ending in February, which is a significantly faster pace than a year earlier. However, the manufacturing output contracted. Major US equity price indexes increased over the reporting period, while short-term funding markets generally remained stable. In the last FOMC meeting, the board discussed whether to eliminate the Federal Reserve's securities holdings at the end of September 2019. The Federal Reserve is closely monitoring the labor market and GDP growth rates. In the long-term prospects, the US economy is set to remain on a soung footing. However, the recent mixed economic data is making the market volatile and indecisive. Today US Core Retail Sales report was published with an increase to 1.2% from the previous value of -0.2%, Retail Sales surged to 1.6% in March from -0.2% in February, and Unemployment Claims decreased to 192k from the previous figure of 197k, defying the forecast for an increase to 207k. Meanwhile, USD is expected to assert strength versus its counterpart. Singapore's economy is feeble nowadays. In this context, SGD is losing further momentum in the coming days. Now let us look at the technical view. The price is currently quite impulsive with the bullish momentum after bouncing off the 1.3500 support area. The price is expected to climb higher and break above 1.3580 resistance. So, the pair could extend an advance higher towards 1.3700-50 price area in the coming days. The price recently formed Bullish Divergence while ranging between the price boundary between 1.3500-80 area. Now the price is forming Bullish Divergence under volatile trend momentum after a long-term bearish trend. Thus, there is a greater probability of a bullish counter-move. As the price remains above 1.3500 area with a daily close, the bullish bias is likely to continue.
|
| EUR/USD, GBP/USD, USD/JPY. Simplified wave analysis and forecast for April 18 Posted: 18 Apr 2019 04:09 AM PDT EUR/USD The trend rate of intraday fluctuations of the euro major is set by the bearish wave of March 20. The nature of the movements is corrective. The structure lacks the final downward part. The price is near the lower boundary of the potential reversal zone. Forecast: Preparations for changing the intersessional trend of the euro is nearing completion. The flat fluctuations of the last 3 days have formed a reversal structure, which can continue with a price reduction already at the next trading sessions. The probability of a short-term price increase is not excluded. The expected swing down is estimated at around one and a half price figures. Recommendations: For purchasing conditions in the next day is not created. In the area of resistance, traders are advised to monitor the pair's sell signals. Resistance zones: - 1.1320 / 1.1350 Support zones: - 1.1260 / 1.1230 GBP/USD The price fluctuations of the pound over the last month have a pronounced flat character, forming a horizontal triangle on the chart. The structure of the last bearish wave of March 13 is developing according to a clear algorithm, which lacks the final part. The middle part of the wave (B) is fully formed. Forecast: The price is at the lower limit of the converging flat corridor, which can be broken in the next day. Before the active phase of decline, there is a high probability of a sharp increase in volatility, with a short-term rise in the price to the resistance zone. Given the pre-holiday day, the pair's market activity may move to the beginning of next week. Recommendations: Buying a major pair of pounds in the coming days is unpromising, even on small TF. The downward mood dominates, so it is recommended to focus on searching for sell signals. Resistance zones: - 1.3065 / 1.3095 Support zones: - 1.3000 / 1.2970 USD/JPY The unfinished wave of the Japanese yen is starting from March 25th. It completes a larger upward wave zigzag, which allows us to expect a quick transition of the current price increase to a larger scale. The structure tracks the first parts (A + B), completes the correctional rollback within the final part (C). Forecast: With a high probability, the current flat will continue today in the last days. The completion of the corrective phase is expected in the area of calculated support. The beginning of the price rise can be expected no earlier than tomorrow. Recommendations: It is recommended to refrain from trading in the market of the pair until the end of the current flat phase of the movement. When the price reaches the support zone, you should pay attention to the reversal signals in order to search for signals of entry into long positions. Resistance zones: - 112.90 / 113.20 - 112.00 / 112.30 Support zones: - 111.70 / 111.40 Explanations for the figures: Waves in the simplified wave analysis consist of 3 parts (A – B – C). The last unfinished wave is analyzed. Zones show areas with the highest probability of reversal. The arrows indicate the wave marking according to the method used by the author, the solid background is the formed structure, the dotted ones are the expected movements. Note: The wave algorithm does not take into account the duration of tool movements over time. The material has been provided by InstaForex Company - www.instaforex.com |
| Fractal analysis of major currency pairs for April 18 Posted: 18 Apr 2019 04:09 AM PDT Dear colleagues. For the Euro/Dollar currency pair, we expect clearance of the expressed initial conditions for the downward cycle and the level of 1.1229 is the key resistance for the bottom. For the Pound/Dollar currency pair, the subsequent targets for the downward movement were determined from the local structure on April 12. For the Dollar/Franc currency pair, we expect to continue moving upwards after the price passes the range of 1.0114 - 1.0125. For the currency pair Dollar/Yen, we follow the development of the ascending structure from April 10 and we expect further upward movement after the breakdown of 112.17. For the Euro/Yen currency pair, the price is in deep correction from the upward structure on April 10, and at the moment, we are expecting clearance of the expressed initial conditions for the downward cycle. For the currency pair Pound/Yen, we follow the development of the downward cycle of April 15. Forecast for April 18: Analytical review of H1-scale currency pairs: For the Euro/Dollar currency pair, the key levels on the H1 scale are 1.1299, 1.1280, 1.1266, 1.1242, 1.1229 and 1.1211. We expect clearance of the expressed initial conditions for the downward cycle. The short-term downward movement is possible in the range of 1.1242 - 1.1229 and the breakdown of the latter value will lead to the movement to a potential target of 1.1211, consolidation is near this level. The range of 1.1266 - 1.1280 is corrective and we expect a short-term upward movement, as well as a key reversal downwards. The level of 1.1299 is the key support for the possible registration of the initial conditions of the downward cycle. Its price passage will lead to the formation of an upward potential. In this case, the first goal is 1.1323. The main trend is the formation of a downward structure. Trading recommendations: Buy 1.1266 Take profit: 1.1280 Buy 1.1282 Take profit: 1.1299 Sell: 1.1240 Take profit: 1.1229 Sell: 1.1228 Take profit: 1.1211 For the Pound/Dollar currency pair, the key levels on the H1 scale are 1.3131, 1.3097, 1.3079, 1.3053, 1.2984, 1.2959, 1.2924 and 1.2876. We are following the development of the local downward structure of April 12. The short-term downward movement is expected in the range of 1.2984 - 1.2959 and the breakdown of the last value should be accompanied by a pronounced downward movement. The target is 1.2924 and near this level is the consolidation. The breakdown of 1.2922 should be accompanied by a pronounced move towards a potential target of 1.2876, from this level, we expect a rollback to the top. We expect a correction after the breakdown of 1.3053. The target is 1.3079 and the range of 1.3079 - 1.3097 is the key support for the downward structure of April 12. Its price passage will have to build up potential for the top. In this case, the target is 1.3131. The main trend is the local downward structure of April 12. Trading recommendations: Buy: 1.3053 Take profit: 1.3079 Buy: 1.3098 Take profit: 1.3130 Sell: 1.2984 Take profit: 1.2960 Sell: 1.2957 Take profit: 1.2925 For the Dollar/Franc currency pair, the key levels on the H1 scale are 1.0165, 1.0147, 1.0125, 1.0114, 1.0096, 1.0082 and 1.0064. We continue to monitor the ascending structure of April 12. The movement upwards is expected after the price passes the range of 1.0114 - 1.0125. In this case, the target is 1.0147 and consolidation is near this level. The potential value for the top is considered the level of 1.0165, upon reaching which we expect a consolidated movement, as well as a rollback to the top. The short-term downward movement is possible in the area of 1.0096 - 1.0082 and the breakdown of the last value will lead to a prolonged correction. The goal is 1.0064 and this level is the key support for the top. The main trend is the local rising structure of April 12. Trading recommendations: Buy: 1.0125 Take profit: 1.0145 Buy: 1.0148 Take profit: 1.0165 Sell: 1.0096 Take profit: 1.0083 Sell: 1.0080 Take profit: 1.0064 For the Dollar/Yen currency pair, the key levels on the scale of H1 are 113.06, 112.88, 112.57, 112.34, 112.17, 111.87, 111.74 and 111.48. We follow the development of the ascending structure from April 10. The short-term upward movement is expected in the area of 112.17 - 112.34 and the breakdown of the latter value will lead to the movement to the level of 112.57, near which, we expect consolidation. The breakdown of 112.60 should be accompanied by a pronounced upward movement. The goal is 112.88. The potential value for the top is considered the level of 113.06, after reaching which we expect consolidation, as well as a rollback to the correction. The short-term downward movement is possible in the area of 111.87 - 111.74 and the breakdown of the latter value will lead to a prolonged correction. The target is 111.50 and this level is the key support for the upward structure. The main trend is the rising structure of April 10. Trading recommendations: Buy: 112.17 Take profit: 112.32 Buy: 112.36 Take profit: 112.55 Sell: 111.87 Take profit: 111.75 Sell: 111.72 Take profit: 111.55 For the Canadian Dollar/Dollar currency pair, the key levels on the H1 scale are 1.3509, 1.3479, 1.3438, 1.3421, 1.3401, 1.3374, 1.3322, 1.3306 and 1.3283. The price entered the equilibrium situation. A downward movement is expected after the price passes the range of 1.3322 - 1.3306. In this case, the first potential target is 1.3283. We expect a resumption of the upward movement after the breakdown of 1.3374. The first target is 1.3401 and the breakdown of which will allow us to count on the movement towards the level of 1.3421, near this level is the price consolidation. The price pass of the range of 1.3421 - 1.3438 should be accompanied by a pronounced upward movement. The target is 1.3479 and consolidation is near this level. The potential value for the top is considered the level of 1.3509, upon reaching which we expect a rollback downwards. The main trend is the equilibrium situation. Trading recommendations: Buy: 1.3374 Take profit: 1.3400 Buy: 1.3403 Take profit: 1.3420 Sell: 1.3322 Take profit: 1.3306 Sell: 1.3303 Take profit: 1.3285 For the Australian Dollar/Dollar currency pair, the key levels on the H1 scale are 0.7268, 0.7250, 0.7220, 0.7209, 0.7192, 0.7153, 0.7137 and 0.7115. We follow the development of the ascending structure from April 11. An upward movement is expected after breakdown of 0.7192. In this case, the first target is 0.7209. The price passage of the range of 0.7209 - 0.7220 must be accompanied by a pronounced upward movement. The target is 0.7250. The potential value for the top is considered to be the level of 0.7268, upon reaching this value, we expect consolidation, as well as a rollback to the top. The short-term downward movement is possible in the range of 0.7153 - 0.7137 and the breakdown of the latter value will have to form the initial conditions for the downward cycle. In this case, the goal is 0.7137. The main trend is the local structure for the top of April 11. Trading recommendations: Buy: 0.7192 Take profit: 0.7209 Buy: 0.7220 Take profit: 0.7250 Sell: 0.7153 Take profit: 0.7138 Sell: 0.7135 Take profit: 0.7115 For the Euro/Yen currency pair, the key levels on the H1 scale are 126.77, 126.38, 126.12, 125.89, 125.46 and 125.23. The price is in the adjustment area of the ascending structure on April 10. We expect clearance of the expressed initial conditions for the bottom to the level of 125.23 and in the area of 125.23 - 125.46 is the short-term downward movement. The short-term upward movement is possible in the area of 125.89 - 126.12 and the breakdown of the last value will lead to a prolonged correction. In this case, the target is 126.38 and this level is the key support for the bottom. The breakdown of the level of 126.38 will lead to the formation of the ascending structure. In this case, the potential target is 126.77. The main trend is the ascending structure of April 10, the stage of deep correction. Trading recommendations: Buy: 125.90 Take profit: 126.10 Buy: 126.14 Take profit: 126.35 Sell: 125.46 Take profit: 125.25 Sell: Take profit: For the Pound/Yen currency pair, the key levels on the H1 scale are 146.31, 145.94, 145.69, 145.32, 145.16, 144.87, 144.51 and 144.28. We follow the development of the downward structure of April 15. We expect the downward movement to continue after the price passes the range of 145.32 - 145.16. In this case, the target is 144.87 and consolidation is near this level. The breakdown of the level of 144.85 should be accompanied by a pronounced downward movement. The target is 144.51. We consider the level of 144.28 as a potential value for the bottom, after reaching which we expect consolidation in the area of 144.51 - 144.28, as well as a rollback to the top. The short-term upward movement is possible in the area of 145.69 - 145.94 and the breakdown of the latter value will lead to a prolonged correction. The target is 146.31 and this level is the key support for the downward structure. The main trend is the development of the downward cycle of April 15. Trading recommendations: Buy: 145.70 Take profit: 145.92 Buy: 145.96 Take profit: 146.30 Sell: 145.16 Take profit: 144.90 Sell: 144.85 Take profit: 144.51 The material has been provided by InstaForex Company - www.instaforex.com |
| The sharp rise in oil prices can bring down the market Posted: 18 Apr 2019 04:09 AM PDT
According to analysts, the rapid rise in the cost of black gold can trigger a collapse in the global market. Experts consider such a development of events to be natural in connection with the over-fulfillment of the obligations of the participants in the OPEC + transaction. They warn market participants of the negative scenario. Since the beginning of this year, oil has risen in price by almost 30%, which, according to experts, is a record value. For over two months, the reference brand Brent has almost completely won back the winter landslide. As a result, the price of Brent crude for the first time in five months exceeded $70 per barrel. Experts believe that the reason for this is the reduction in oil production from the parties to the OPEC + transaction. According to the information of Bloomberg agency, in January 2017, the organization's members almost fulfilled their obligations, and by spring they began to overfulfill. The implementation of OPEC + plans was on the rise. As a result, oil prices moved upwards, and since the second half of 2017, Brent's value has not dropped below $50 a barrel. Saudi Arabia has succeeded most in fulfilling commitments. In March 2019, the kingdom exceeded the plan by 160%. Over the past five months of this year, oil production here fell by almost 1.2 million barrels per day, to 9.8 million. Among the countries included in the cartel, program over-fulfillment was recorded in Angola and Algeria. Of the 10 countries that joined the agreement under OPEC +, Kazakhstan and Mexico also distinguished themselves. At the end of last month, Russia mined raw materials in the range of 11.6 million barrels per day, while the planned volume provided for 100 thousand barrels less. According to some analysts, a total reduction in oil production can seriously damage the global economy. According to John Kemp, a leading expert at Reuters, the current situation in the black gold market resembles the one that emerged before the collapse in oil prices in 2013–2014. At that time, the market, imperceptibly for its participants, was overstocking, and in the second half of 2014, it collapsed sharply. As a result, there was a crisis in the entire oil industry and government finance in countries dependent on oil exports. At present, a slightly different situation arises when danger threatens oil producers from the demand for black gold. In the event of a significant increase in oil prices, the decline in demand will increase. Oil will be unclaimed, and a large number of people may be interested in electric vehicles and turn to renewable energy sources. The experience of the last decade has shown that ultrahigh oil prices are just as disastrous for the hydrocarbon industry as they are too low. If oil-producing states cannot bring the market to equilibrium, the consequences could be unpredictable, analysts say. The material has been provided by InstaForex Company - www.instaforex.com |
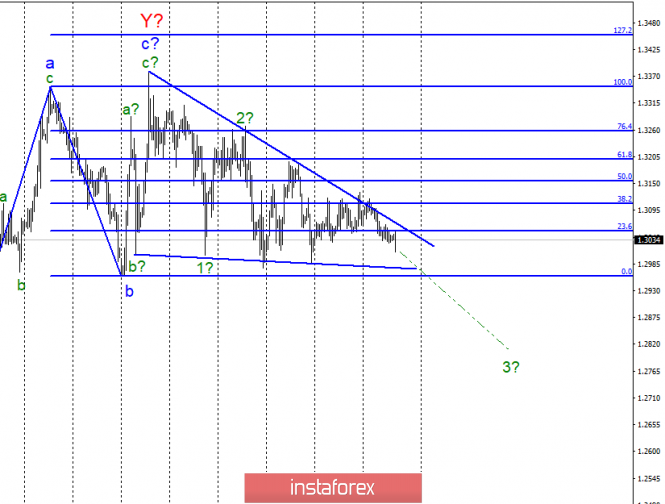
| Posted: 18 Apr 2019 04:09 AM PDT
Wave counting analysis: On April 17, the GBP/USD pair lost only about 5 bp. Thus, the market activity on the instrument remains low, and trading continues to take place inside the narrowing triangle. The current wave counting does not allow making any new conclusions, except those that have already been made. It is still assumed to construct a descending set of waves, in particular wave 3. The confirmation of this variant will be a successful attempt to break through the lower line of the triangle and the level of 0.0% Fibonacci. A weak report on inflation was released yesterday in the UK, and today a strong retail sales report, but the pound was declining in both cases. In general, the news background is not supporting the UK currency, with rare exceptions. Accordingly, the breakthrough of the level of 0.0% remains a forecast for the pair GBP/USD. Purchase goals: 1.3350 - 100.0% Fibonacci 1.3454 - 127.2% Fibonacci Sales targets: 1.2961 - 0.0% Fibonacci General conclusions and trading recommendations: The wave pattern still involves the construction of a downward trend section. And the markets still can not withdraw a pair from the triangle, so the trades are held with a small amplitude. Accordingly, I recommend expecting a pair out of the triangle to determine the market mood for the near future. Now, I expect the fall of the pound sterling to the mark of 1.2961 and a breakthrough of this mark. The material has been provided by InstaForex Company - www.instaforex.com |
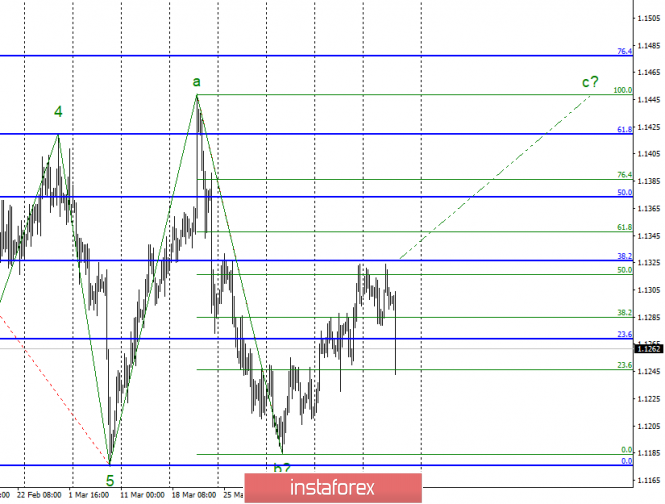
| Wave analysis of EUR/USD for April 18. The euro fell, but retains an upward set of waves Posted: 18 Apr 2019 04:09 AM PDT
Wave counting analysis: On Wednesday, April 17, trading ended for EUR / USD by 15 bp increase. However, today, after the third unsuccessful attempt to break the level of 50.0% Fibonacci, the pair fell down. However, so far this decrease in no way violates the current wave pattern, which still involves the construction of a wave C in the composition of the ascending set of waves. However, now we need a signal to resume the construction of the wave C, which may be an unsuccessful attempt to break the level of 23.6% on the lower Fibonacci grid. Or break the level of 50.0% Fibonacci. The news background for the euro, meanwhile, remains neutral. Even the inflation report released yesterday did not help either the euro or the dollar. In the current conditions, the forecast may be a failed attempt to break the level of 23.6% and the resumption of the increase. Sales targets: 1.1177 - 100.0% Fibonacci Purchase targets: 1.1448 - 100.0% Fibonacci 1.1476 - 76.4% on the highest Fibonacci grid. General conclusions and trading recommendations: The pair, presumably, remains within the framework of the construction of wave C, but now the construction of an internal downward wave has begun. I believe that the pair will bounce from 23.6% level and will resume rising with targets placed near the calculated marks of 1.1448 and 1.1476. But a successful attempt to break the level of 23.6% can lead to complications of the current wave marking. The material has been provided by InstaForex Company - www.instaforex.com |
| Posted: 18 Apr 2019 04:09 AM PDT 4-hour timeframe Technical details: The upper linear regression channel: direction - up. The lower linear regression channel: direction - down. Moving average (20; smoothed) - down. CCI: -79.2988 The GBP/USD currency pair dropped yesterday to Murray's level of "3/8" - 1.3031, but could not overcome it and can now start a round of upward correction. We have repeatedly noted that for the pound sterling, there are two saving levels of support at 1.3031 and 1.3000, from which the price bounced off regularly. Together with the level of 1.3123, they form a side channel, which the pound sterling and the dollar cannot leave. For the pound, today will be more important than for the euro. In the UK, a report on retail sales will be published today, which is quite important. Forecasts, by the way, are very weak. If in annual terms an increase of 4.6% is expected, then on a monthly basis a reduction of 0.3%. Thus, if the forecasts come true, then traders will understand that retail sales have fallen compared to the previous month. But in the States, retail sales, by contrast, can grow. Therefore, already on the basis of these two publications, it is possible to make a forecast about the continuation of the strengthening of the American currency. To counter the growth of the dollar will be the levels of 1.3000 and 1.3031. Meanwhile, the head of the European Parliament, Donald Tusk, believes that the abolition of Brexit will be the best solution for everyone. He also fears that UK participation in the European elections could lead to an increase in the number of Euro-skeptics in the European Parliament, which threatens the further development and existence of the entire European Union. Nearest support levels: S1 - 1.3031 S2 - 1.3000 S3 - 1.2970 Nearest resistance levels: R1 - 1.3062 R2 - 1.3092 R3 - 1.3123 Trading recommendations: The pair GBP/USD continues to be below the MA, however its potential fall is limited by the levels of 1.3031 and 1.3000, the first of which has already been worked out and has not been overcome. Thus, a further decline is in doubt, unless today's retail sales reports help the bears. Buy positions will formally become relevant after the pair is fixed above the moving average line with a short target of 1.3123 - this is the upper limit of the side channel. In addition to the technical picture should also take into account the fundamental data and the time of their release. Explanations for illustrations: The upper linear regression channel is the blue lines of the unidirectional movement. The lower linear channel is the purple lines of the unidirectional movement. CCI is the blue line in the indicator regression window. The moving average (20; smoothed) is the blue line on the price chart. Murray levels - multi-colored horizontal stripes. Heiken Ashi is an indicator that colors bars in blue or purple. The material has been provided by InstaForex Company - www.instaforex.com |
| Posted: 18 Apr 2019 04:09 AM PDT 4-hour timeframe Technical details: The upper linear regression channel: direction - down. The lower linear regression channel: direction - sideways. Moving average (20; smoothed) - sideways. CCI: 17.7343 The currency pair EUR/USD on Thursday, April 18, once again fulfilled Murray's level of "8/8" - 1.1322, failed to overcome it and lowered to the moving average line. At the same time, the upward trend in the pair persists, although it remains rather weak. Today in the eurozone and America, a sufficiently large number of macroeconomic reports will be published, but most of them will be insignificant. For example, as many as 6 reports on business activity indices in the fields of production and services of the EU and the USA. However, these are only preliminary values for March, and not final. Thus, they will only understand what the final values can be expected from these indicators. For example, the EU Markit business index in the manufacturing sector has already dropped below 50, which means a negative trend. All three US indices continue to be above 50. Also today there will be several reports on US retail sales. All indicators are expected with a significant increase compared with the previous period. Thus, the likelihood that today it is the US dollar that will receive support from the fundamental data is very high. Thus, as a forecast, it can be assumed that today there will be a closing below the moving average. By the way, three rebounds from the level of 1.1322 speak in favor of this. Now this level looks like the maximum rate that EUR/USD could reach in the current conditions. Nearest support levels: S1 - 1.1292 S2 - 1.1261 S3 - 1.1230 Nearest resistance levels: R1 - 1.1322 R2 - 1.1353 R3 - 1.1383 Trading recommendations: The EUR/USD currency pair has begun another round of correction. Thus, it is now recommended to consider long positions with targets at 1.1322 and 1.1353, but after the completion of the current correction and if the price remains above the moving average. It is recommended to open sell orders no earlier than fixing the pair below the moving average with targets at 1.1261 and 1.1230. But the potential downward movement will still be limited to the level of 1.1200. In addition to the technical picture should also take into account the fundamental data and the time of their release. Explanations for illustrations: The upper linear regression channel is the blue lines of the unidirectional movement. The lower linear regression channel is the violet lines of the unidirectional movement. CCI - blue line in the indicator window. The moving average (20; smoothed) is the blue line on the price chart. Murray levels - multi-colored horizontal stripes. Heiken Ashi is an indicator that colors bars in blue or purple. The material has been provided by InstaForex Company - www.instaforex.com |
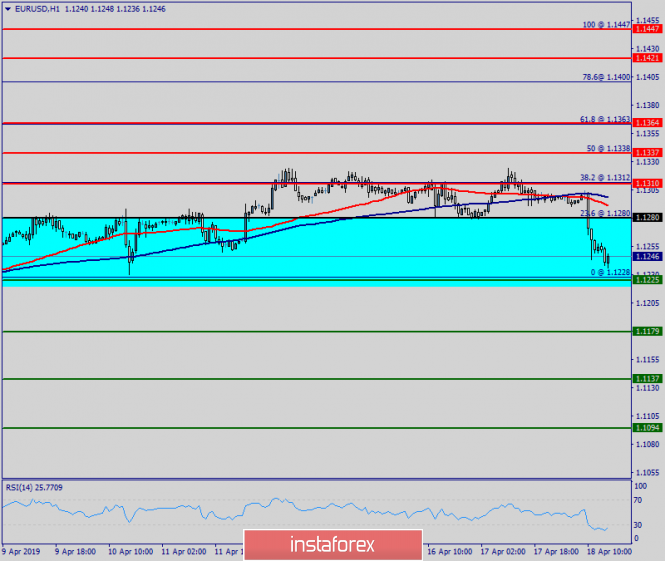
| Posted: 18 Apr 2019 04:09 AM PDT 4h As seen on the 4-hour chart, the EUR/USD pair performed first with a rebound from retracement level of 61.8% (1.1281), and then from the Fibo level of 50.0% (1.1313). As a result, on April 18, a new decline began in the direction of the retracement level of 61.8%. New emerging divergences today are not observed in any indicator. The end of quotations from the Fibo level of 61.8% will again work in favor of the euro and returning the pair to the retracement level of 50.0%. A close below the Fibo level of 61.8% will increase the chances for the EUR/USD pair to fall further in the direction of the next retracement level of 76.4% (1.1241). The Fibo grid was built on extremums from March 7, 2019, and March 20, 2019. Daily As seen on the 24-hour chart, the pair still holds chances for both growth and decline. Quotes of the pair completed the close above the Fibo level of 127.2% (1.1285) on the one hand, and on the other hand, bearish divergence is on the CCI indicator. It is the formation of a divergence that will work in favor of the US dollar and the resumption of a fall in the direction of the retracement level of 161.8% (1.0941). But until the pair closes below the Fibo level of 127.2%, there is still a chance for the growth of the Eurocurrency. The Fibo grid was built on extremes from November 7, 2017, and February 16, 2018. Forecast for EUR/USD and trading recommendations: Buy deals on EUR/USD pair can be opened with targets at 1.1313 and 1.1344 if the pair bounces off retracement level of 61.8%. The stop loss order should be placed below the level of 1.1281. Sell deals on EUR/USD pair can be opened with targets at 1.1281 and 1.1241 since the pair completed the rebound from the level of 50.0%. The stop loss order should be placed above the level of 1.1313. The material has been provided by InstaForex Company - www.instaforex.com |
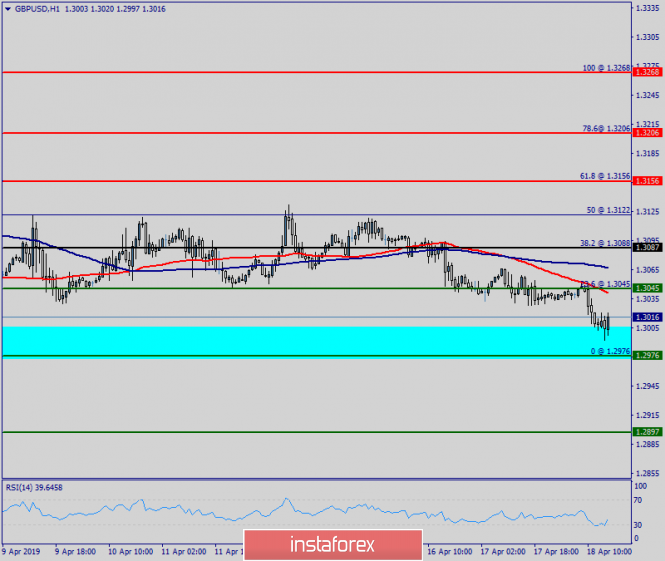
| Analysis of GBP/USD divergences for April 18th. New bearish divergence is pushing pound down Posted: 18 Apr 2019 04:09 AM PDT 4h As seen on the 4-hour chart, the GBP/USD pair completed closing below the Fibo level of 76.4% (1.3098) and continues the process of falling towards retracement level of 61.8% (1.2969). There is no visible indicator of divergence today. Thus, only quoting quotes from the Fibo level of 61.8% can be regarded as a reversal in favor of the British pound, and traders can expect a resumption of growth in the direction of the retracement level of 76.4%. The Fibo grid is built on extremums from September 20, 2018, and January 3, 2019. 1h As seen on the hourly chart, the GBP/USD pair closed below the Fibo level of 23.6% (1.3045) and returned to it, however, on April 18, the bearish divergence of the CCI indicator is brewing, which allows us to expect a reversal in favor of the American currency and the resumption of the fall in retracement of 0.0% (1.2976). On the other hand, the closure of the pair above the level of 23.6% allows us to expect some growth. As a result, confirmation of the beginning of the fall can be considered closing of quotations below the Fibo level of 23.6%. The Fib grid is built on extremes from March 27, 2019, and March 29, 2019. Forecast for GBP / USD and trading recommendations: Buy deals on GBP/USD pair can be opened with the target at 1.3088 and the stop loss order under retracement level of 23.6% if the current emerging bearish divergence is canceled (hourly chart). Sell deals on GBP/USD pair can be opened with a target at 1.2976 and a stop loss order above 23.6% if the pair closes below 1.3045 to form a bearish divergence (hourly chart). The material has been provided by InstaForex Company - www.instaforex.com |
| EUR / USD: Euro buyers urgently need to correct the situation Posted: 18 Apr 2019 02:30 AM PDT Euro buyers failed to cope yesterday with a large level around 1.1325, which led to a downward correction. However, the fundamental data on the American economy and the statements of the Fed representatives did not greatly help the dollar to continue its strengthening against risky assets. Yesterday, there was news that the United States and China had drawn up an approximate schedule for the next round of trade negotiations, which is a good signal for the markets. The agreement is expected to be signed by the end of May. It is already known that the US sales representative Lighthizer planned a trip to Beijing on April 29. The fundamental data released yesterday indicated that the trade deficit in the USA in February of this year was reduced due to a stronger increase in exports over imports. As indicated in the report of the US Department of Commerce, the foreign trade deficit decreased by 3.4% in February 2019 compared with the amounted to 49.38 billion US dollars in the previous month. As I noted above, exports in February increased by 1.1% and amounted to 209.69 billion dollars, while imports increased by only 0.2% compared with the previous month. It is noteworthy that the deficit of trade in goods with China decreased by 9.3% compared in the previous month and amounted to 30.12 billion dollars. Stocks from wholesale companies in the US resumed their growth. According to the report of the Ministry of Commerce, inventories in the wholesale trade increased by 0.2% in February 2019 compared with the previous month, while economists expected growth of 0.4%. The Philadelphia Fed President is one of the few who is still optimistic about interest rates, especially given the fact that at a recent meeting the Central Bank hinted that rates could be lowered if necessary. Perhaps one of the few who still believes in changes in monetary policy is Patrick Harker, the president of the Federal Reserve Bank of Philadelphia. In the course of yesterday's interview, Herker said that one more rate increase is still possible this year and another one in 2020. In his opinion, the labor market is strong and inflation is restrained. Harker expects inflation to average more than 2% this year and the US GDP will grow by 2% this year and the next year. As for the technical picture of the EURUSD pair, it has not undergone major changes. Major support remains the lower boundary of the lateral channel at 1.1280, while the upper region of 1.1325 acts as resistance. All of these are in harmony with the average boundary of the channel in the area of 1.1300. Further movement of the euro today will depend on the upcoming economic data from the euro area. The Canadian dollar has temporarily regained its position against the US dollar after a report that annual inflation in Canada accelerated in March. According to a report by the National Bureau of Statistics of Canada, Canada's total CPI rose by 1.9% in March against 1.5% in the previous month. The data completely coincided with economists' forecasts and inflation rose by 0.7% compared with the previous month. The base CPI increased by 2.2% compared with the same period last year. Canada's foreign trade deficit declined in February, which also provided temporary support for the Canadian dollar. According to the report, the shortage of foreign trade in goods amounted to 2.90 billion Canadian dollars. Meanwhile, economists had expected the deficit to reach $3.6 billion. Exports fell by 1.3% in February, while imports fell by 1.6%. The material has been provided by InstaForex Company - www.instaforex.com |
| Daily review of Indicator analysis for GBP / USD pair on April 18, 2019 Posted: 18 Apr 2019 01:34 AM PDT On Wednesday the market moved in the side channel. Traders could not decide whether the support line of 1.3067 (yellow thin line) was broken or not. On Thursday, a strong calendar news comes out at 9.30 and 13.30 London time. Trend analysis (Fig. 1). On Thursday, the technical analysis gives a downward movement. The first lower target is at 1.3002, which is the 38.2% pullback level (blue dashed line). Fig. 1 (daily schedule). Comprehensive analysis: - indicator analysis - down; - Fibonacci levels - down; - volumes - down; - candlestick analysis is neutral; - trend analysis - down; - Bollinger lines - down; - weekly schedule - up. General conclusion: On Thursday, the technical analysis gives a downward movement. The first lower target is at 1.3002, which is the 38.2% pullback level (blue dashed line). The material has been provided by InstaForex Company - www.instaforex.com |
| Daily review of Indicator analysis for EUR / USD pair on April 18, 2019 Posted: 18 Apr 2019 12:51 AM PDT On Wednesday, the market tested the upper fractal 1.1325. However, more bulls were not enough and the price went down quite strongly. On Thursday, strong calendar news comes out at 10.30 and 13.30 London time. Trend analysis (Fig. 1). On Thursday, the price might try again to break through the resistance line of 1.1301 (red bold line). Again, the first upper target is the level of 1.1325 on the upper fractal. Fig. 1 (daily schedule). Comprehensive analysis: - indicator analysis - up; - Fibonacci levels - up; - volumes - up; - candlestick analysis is neutral; - trend analysis - up; - Bollinger lines - up; - weekly schedule - up. General conclusion: On Thursday, the price might try again to break through the resistance line of 1.1301 (red bold line). Again, the first upper target is the level of 1.1325 on the upper fractal. The material has been provided by InstaForex Company - www.instaforex.com |
| Posted: 18 Apr 2019 12:48 AM PDT The wave of optimism that came from China turned out to be short-lived. The published strong GDP data from the labor market, as well as the values of retail sales, could only temporarily maintain positive sentiment in the markets. In our opinion, they only brought confusion and allowed speculators to use them only as a pretext for short-term transactions. In the foreign exchange market, the US dollar was under pressure in the Asian trading session, but everything returned to normal since the beginning of trading in the States. The decline in the US stock market showed that investors continue to doubt the unclouded prospects for global growth. They are still balancing due to the uncertainty factor, which has been gnawing the markets for the fourth consecutive month. Naturally, this picture is most fully reflected in the foreign exchange market, which has always been characterized by high volatility but once again, fell significantly in recent months. This probably led to the loss of a significant number of speculative investors. Today, the situation may somewhat liven up against the background of the publication of data on the index of business activity in the manufacturing sector of Germany and the eurozone, as well as retail sales in the United States. It can be assumed that if the index of business activity in the manufacturing sector in Germany and the eurozone shows growth as predicted. This will push the demand higher for risky assets and the single currency may receive short-term support. At the same time, the expected increase in the base index of retail sales in the United States may cool the growth of the euro against the dollar, which returns the situation to the already usual direction of lateral dynamics. In general, we do not expect any noticeable changes in the market since there are no significant and weighty reasons for this. Forecast of the day: The EUR/USD pair will most likely remain in the lateral range of 1.1280-1.1325. But if the data from Germany and the Eurozone come out weaker, the pair may be under pressure after rising to 1.1325 and fall back to 1.1280. A breakthrough of this level will lead to a price reduction to 1.1250. The USD/CAD pair will grow to 1.3390 on expected positive data on US retail sales. We consider it possible to sell it from this mark with a local target of 1.3290. |
| AUD / USD: Australian ignores important releases and positive for China Posted: 18 Apr 2019 12:18 AM PDT The AUD/USD pair ignored data on the Australian labor market, which were published today during the Asian session. The release turned out to be rather contradictory but it was quite good as a whole since many parameters turned out to be better than expected. Yet, the Australian dollar froze in place and did not even try to overcome the key resistance level of 0.7200, which was the top line of the Bollinger Bands indicator on the daily chart. Even the Aussie did not help another batch of positive rumors about the prospects for the US-China trade talks. All of these suggest that traders of this pair do not risk opening large positions on the eve of a three-day weekend. Tomorrow trading floors will be closed as the Catholic world celebrates Good Friday. But all the listed fundamental factors will still be won back, albeit with a time delay. Therefore, it is impossible to ignore the dynamics of the Australian labor market, even in the absence of any market reaction to published figures. In general, today's release did not bring any surprises. Data on the labor market in Australia turned out to be slightly contradictory but on the whole, it was slightly better than forecasts. The unemployment rate rose to 5% as expected after an unexpected decline in February to 4.9%. The indicator was published from September to January at the 5% level. Thus, the current dynamics cannot be called negative. The increase in the number of employees was frankly positive as the indicator jumped to 25 despite the projected growth of up to 15 thousand. This is a very good result but it is far from the records of the last year. For example, a number of 38 thousand jobs were created in January compared to last year's figures of 39 thousand and 43 thousand for the months of November and August, respectively. Part-time employment also showed a positive trend, which significantly exceeded forecasts. But, in my opinion, this result cannot be called a positive signal, since full-time positions offer a higher level of wages in contrast to those positions that involve part-time employment. This factor has a negative impact on the dynamics of wage growth and indirectly to the dynamics of inflation growth. After a reduction in February and in March, the partial employment rate jumped to 48 thousand. It is likely that this fact leveled the positive effect of the overall release. However, the AUD/USD traders did not attach importance to either the positive or the negative sides of today's publication. This fact can still somehow be "justified", whereas ignoring the news regarding the prospects for a truce between the US and China looks somewhat abnormal. The fact is that yesterday in one of the influential American newspapers information was published about the course of negotiations between Beijing and Washington. According to the sources of the publication, it is now in full swing to sign a historic deal. At the moment, there are even indicative dates for signing the agreement. The parties are trying to have time to prepare and agree on the text of the transaction by May 27, when Memorial Day is celebrated in the US. The symbolism of this date is not quite clear since this day is dedicated to the memory of the American military. However, according to another publication, Donald Trump and Xi Jinping may sign a deal a little later in June at the G20 summit, which will be held in Osaka. or the most part, it is not so important - where exactly the historic "truce" between the superpowers will take place. All information sources assure that the deal is almost 90% ready, although there are still two rounds of negotiations ahead. Thus, the US trade negotiator Robert Lightheiser will visit Beijing in a week while PRC representative Liu He will pay a return visit to the US in early May. According to preliminary data, the structure of the future agreement is ready. Presently, the parties are coordinating the legal details of the transaction. It is worth recalling that in early April, Beijing and Washington agreed on a mechanism for implementing the trade agreement. This question has long been a stumbling block, according to the rumors. It was because of him that the March meeting of the leaders of the superpowers had to be postponed. Now, the parties agreed that the relevant authorities will be created in the countries to deal with the implementation of the terms of the transaction. Thus, many factors which will give a general risk-taking on the good data on the Australian labor market, as well as the continuing growth of the commodity market. These will favor the growth of the Australian currency. The phlegmatic response of the AUD/USD pair to such a fundamental background suggests that traders are simply afraid to open large positions on the eve of the weekend. But at the same time, the potential for further growth of "Aussie" remains and will certainly be realized next week. The material has been provided by InstaForex Company - www.instaforex.com |
| EUR / USD plan for the European session on April 18. All attention to eurozone reports Posted: 18 Apr 2019 12:10 AM PDT To open long positions on EUR / USD pair, you need: Today, the direction of the market will set the reports for the eurozone countries. If buyers manage to return to the resistance level of 1.1301, then we can expect a larger upward trend with the return and repeated test of the maximum of 1.1323. A breakthrough in the said level will continue the upward trend to the levels of 1.1336 and 1.1358, where I recommend fixing the profit. If the EUR / USD falls in the first half of the day amid weak PMI data, it is best to return to long positions on a rebound from the lower border of the channel at 1.1280 or from the new minimum of 1.1258. To open long positions on EUR / USD pair, you need: The bears managed to consolidate below the resistance of 1.1301. As long as the trade is conducted below this level, the pressure on EUR/USD pair will continue, which will lead to an update of the lower boundary of the side channel in the area of 1.1280, where I recommend taking profits. It is best to expect a larger downward trend after the release of weak PMI index reports for the eurozone countries, which will open the way to the minima of 1.1258 and 1.1232. In case that the EUR/USD pair rises in the first half of the day, it is best to return to short positions after updating the highs of 1.1323 and 1.1358. More details about the forecast can be found in the video review. Indicator signals: Moving averages Trade is conducted in the region of 30 and 50 moving averages, which indicates the lateral nature of the market. Bollinger bands The volatility of the Bollinger Bands indicator has decreased, which does not give signals on the market entry. Description of indicators MA (moving average) 50 days - yellow MA (moving average) 30 days - green MACD: fast EMA 12, slow EMA 26, SMA 9 Bollinger Bands 20 The material has been provided by InstaForex Company - www.instaforex.com |
| Posted: 18 Apr 2019 12:01 AM PDT To open long positions on the GBP / USD pair, you need: Inflation data did not help the pound to return above the middle of the channel, as they completely coincided with economists' forecasts. It is best to consider long positions in the GBP/USD pair after returning and fixing above the resistance of 1.3064, which will lead to updating the upper limit of the wide side channel around 1.3094 and test the maximum of 1.3118, where I recommend taking profits. In the scenario of another wave reduction of the pound, it is best to rely on long positions after a false breakdown in the area of 1.3032 and best on a rebound from the lows of 1.3010 and 1.2989. To open short positions on the GBP / USD pair, you need: In the first half of the day, the bears need to form a false breakdown in the area of resistance at 1.3064, which will increase the pressure on the pair and will lead to another test of large support at 1.3032, from which the pound has rebounded four times already. Only a breakthrough of this range will increase the pressure on the GBP/USD pair, which will open a direct road to the area of minimum at 1.3010 and 1.2989, where I recommend taking profits. In a growth scenario above 1.3064 after the release of a retail sales report, it is best to rely on short positions for a rebound from resistance 1.3094. More details about the forecast can be found in the video review. Indicator signals: Moving averages Trade is conducted in the region of 30 and 50 moving averages, which indicates the formation of a side channel. Bollinger bands The volatility of the Bollinger Bands indicator has seriously decreased, which does not give signals on market entry. Description of indicators MA (moving average) 50 days - yellow MA (moving average) 30 days - green MACD: fast EMA 12, slow EMA 26, SMA 9 Bollinger Bands 20 The material has been provided by InstaForex Company - www.instaforex.com |
| Trading Plan for EUR / USD and GBP / USD pairs on 04/18/2019 Posted: 18 Apr 2019 12:00 AM PDT Only investors were in a positive mood and prepared to make wholesale purchases of a pound with a single European currency, as the sad news came again. Inflation in the United Kingdom did not grow as expected but remained unchanged while in Europe, the total confirmed the preliminary estimate and inflation fell from 1.5% to 1.4%. By contrast, data on inventories at wholesale warehouses in the United States were better than expected, as they grew by only 0.2% instead of the expected 0.5%. oddly enough, this was enough for investors to believe in the dollar even more and even forgot that these same stocks have been growing for fifteen months in a row. In fact, today is the last working day and tomorrow marks as non-working holiday Good Friday in Europe. On this pre-holiday day, oddly enough, a lot of interesting macroeconomic data that will give considerable food for thought just at the time of prayer. Thus, the growth rate of retail sales in the United States should accelerate from 2.2% to 2.7%, which is naturally impressive, especially if we recall the recent increase in inflation. However, the growth rate of retail sales should also accelerate from 4.0% to 4.6% in the United Kingdom, which to some extent compensates for the disappointment with yesterday's inflation data. In addition, preliminary data on business activity indices will be published in both Europe and the United States. The forecasts for the Old World are rather moderately optimistic since the business activity index in the services sector should decrease from 53.3 to 53.2. However, in the manufacturing sector, it grew from 47.5 to 47.9. In sum, this should give rise to a composite index of business activity from 51.6 to 51.8 but in the United States, the expectations are not so optimistic, as the business activity index in the service sector can be reduced from 55.3 to 55.0 and also the production index can fall from 52.4 to 51.8. Hence, we are waiting for a decline in the composite index of business activity from 54.6 to 54.0 and of course, they are once again waiting for an increase in the number of applications for unemployment benefits. If the number of repeated applications for unemployment benefits can grow up to 7 thousand, then the number of primary applications can increase as much as 11 thousand. Regardless, the significant increase in retail sales will smooth all this negativity. The euro/dollar currency pair continues to fluctuate within the level of 1.1300. It is likely that the amplitude fluctuation within 1.1290/1.1320 will continue and concentrate closer to the upper boundary. The pound/dollar currency pair felt temporary support in front of it after approaching the lower limit of the range move at 1.3030, resulting in stagnation. It is likely to assume that instability continues around 1.3030/1.3050, where it is worth tracking down the fixation points outside the borders to place trade orders. |


| You are subscribed to email updates from Forex analysis review. To stop receiving these emails, you may unsubscribe now. | Email delivery powered by Google |
| Google, 1600 Amphitheatre Parkway, Mountain View, CA 94043, United States | |
No comments:
Post a Comment