
Forex analysis review |
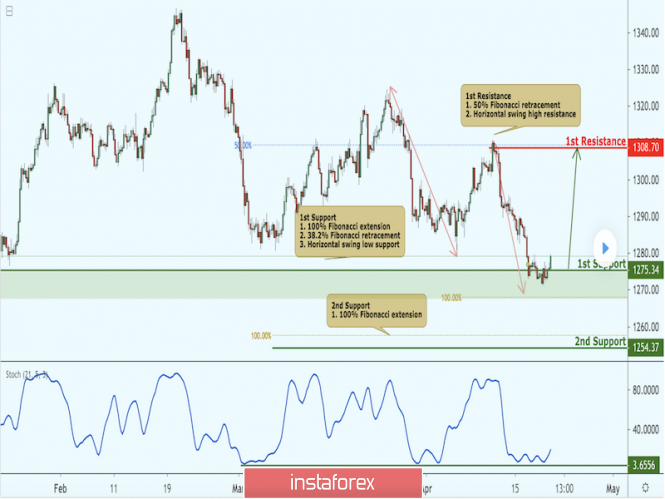
- XAU/USD approaching support, potential bounce!
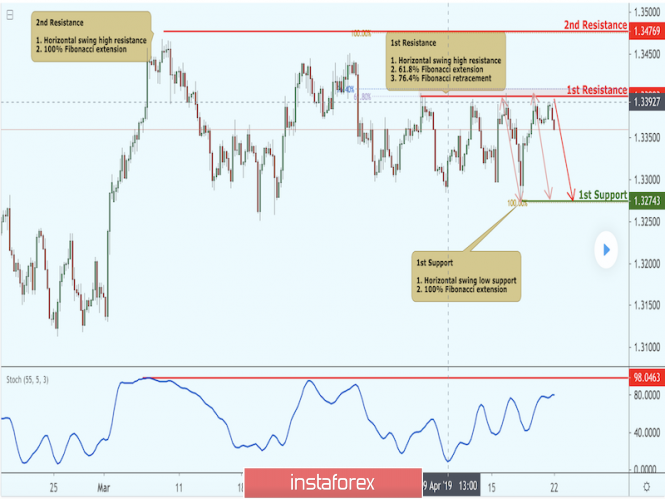
- USD/CAD approaching resistance, potential drop!
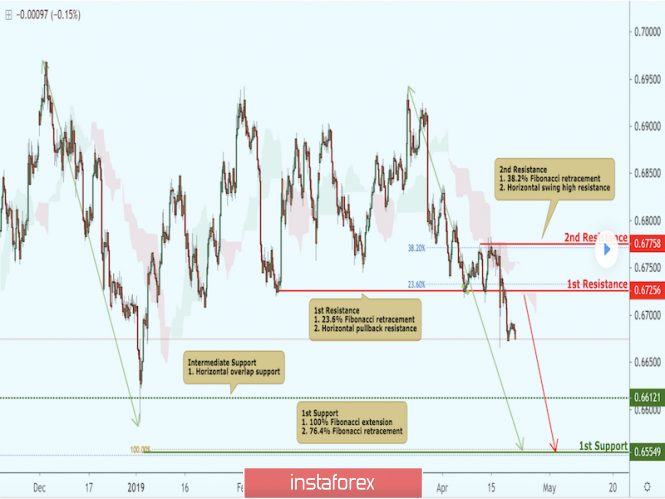
- NZD/USD approaching resistance, potential drop!
- Fasten your seat belts: after a lull in the market, a surge of "turbulence" is expected
- The price of black gold will rise to $80 in case of a full embargo on oil from Iran
- The dollar rejoices. How long?
- The US dollar can not yet find support but the Canadian dollar could
- The cost of oil is growing rapidly, but Saudi Arabia will not allow a deficit
- The most truthful rumors (weekly review of EUR/USD and GBP/USD)
- AUD/USD. Australian inflation could knock out the aussie
- April 22, 2019 : GBP/USD Intraday technical analysis and trade recommendations.
- April 22, 2019 : EUR/USD Intraday technical analysis and trade recommendations.
- Bitcoin is about to drop - Analysis for April 22,2019
- EUR./USD analysis for April 22, 2019
- The gold is about to drop, 22.04.2019
- "Canadian" took the lead
- Wave analysis of GBP/USD for April 22. The euro fell to the bottom line of the triangle
- What to expect from the euro: will it grow to $1.16 or decrease to $1.05?
- Wave analysis of EUR / USD pair on April 22. Market activity is zero on Easter Monday
- Trading Plan for EUR / USD pair on 04/22/2019
- Gold production in 2019 could be a record – opinion
- Daily review on Indicator analysis for GBP / USD pair on April 22, 2019
- Higher oil prices will support commodity currencies with a high probability of a decline in AUD/USD and USD/CAD pairs
- Trading recommendations for the EURUSD currency pair - placement of trading orders (April 22)
- Indicator analysis. Daily review on April 22, 2019 for the pair EUR / USD
| XAU/USD approaching support, potential bounce! Posted: 22 Apr 2019 07:40 PM PDT XAUUSD is approaching our first support at 1275.34 (horizontal swing low support, 38.2% Fibonacci retracement , 100% Fibonacci extension ) where a strong bounce might occur above this level pushing price up to our major resistance at 1308.70 (horizontal swing high resistance, 50% Fibonacci retracement ). Stochastic is also approaching support where we might see a corresponding bounce in price. Trading CFDs on margin carries high risk. Losses can exceed the initial investment so please ensure you fully understand the risks.
|
| USD/CAD approaching resistance, potential drop! Posted: 22 Apr 2019 07:38 PM PDT USDCAD is approaching our first resistance at 1.3399 (horizontal swing high resistance, 76.4% Fibonacci retracement , 61.8% Fibonacci extension ) where a strong drop might occur below this level pushing price down to our major support at 1.3274 (100% Fibonacci extension , horizontal swing low support). Stochastic is also approaching resistance where we might see a corresponding drop in price. Trading CFDs on margin carries high risk. Losses can exceed the initial investment so please ensure you fully understand the risks.
|
| NZD/USD approaching resistance, potential drop! Posted: 22 Apr 2019 07:36 PM PDT NZDUSD is approaching our first resistance at 0.6725 (horizontal pullback resistance, 23.6% Fibonacci retracement ) where a strong drop might occur below this level pushing price down to our major support at 0.6554 (100% Fibonacci extension , 76.4% Fibonacci retracement ). Ichimoku cloud is also showing signs of bearish pressure. Trading CFDs on margin carries high risk. Losses can exceed the initial investment so please ensure you fully understand the risks.
|
| Fasten your seat belts: after a lull in the market, a surge of "turbulence" is expected Posted: 22 Apr 2019 03:45 PM PDT Despite the global lull in the Forex market, traders do not seem to relax. The bottom, where JP Morgan's world currency volatility index turned out to be, may portend strong fluctuations in the US dollar exchange rate - this has happened three times in the past 25 years. Some currency strategists warn that they should prepare for a surge in market "turbulence." In the meantime, in the face of declining volatility of key currencies, investors are forced to search every corner of the market in search of profit. "The lack of serious movement in developed markets means that currency traders should try their luck in the darker corners of the liquid currencies of developing countries," said Peter Rosensstraich of Swissquote Bank. "Hedge funds have begun to redefine the weight of emerging markets against the dollar," said Philip Ferreira, senior mixed assets strategist at Lyxor Asset Management. According to Keith Jax, a Societe Generale specialist, using the yen as a funding currency to buy Indian rupee, Chinese yuan or the Philippine peso could bring substantial profits. Carry trading also looks attractive in a low volatile environment. "At the beginning of the year, we opened longs for the USD/ZAR pair, since it managed to rally, which took place in February-March. We received about 6% profit on this jump, and I am very pleased with it, "said Allianz investment manager Casper Brzezniak. "The pound sterling is trading in an even narrower range than its counterparts, since Brexit was postponed until October, and the volatility of the British currency fell sharply. To make money in these conditions, you need to have time to take advantage of short periods of volatility on the news. This strategy can bear fruit if you choose the right range. Timing is also very important," said Scott Thiel of BlackRock Inc. The material has been provided by InstaForex Company - www.instaforex.com |
| The price of black gold will rise to $80 in case of a full embargo on oil from Iran Posted: 22 Apr 2019 03:44 PM PDT According to the observations of experts, after the news about the possibility of a complete ban by the United States on any operations with Iranian oil, the price of black gold soared to $74 per barrel. Experts believe that Washington will fulfill the promise and introduce a full embargo on oil from Iran. As a result, global oil producers will suffer, and crude will cost about $80 per barrel. Experts do not exclude that from May 2, 2019, the United States will cancel all the anti-Iran sanctions relief measures relating to oil operations. Analysts are confident that in the event of developments in this key, given the current impact of OPEC+, there could be a serious shortage of supply in the oil market by summer. The current situation will open up the potential for rising oil prices to $80 a barrel and more, experts sum up. It should be noted that the OPEC+ agreement on reducing production by 1.2 million barrels per day ( s), reached at the end of 2018, continues to affect the black gold market. In this case, the Iranian factor could be an additional powerful catalyst for rising prices, experts believe. A complete ban on the purchase of Iranian oil could mean a loss of 1.5-2 million b/s for the global market. Analysts do not exclude that Iranian oil can replace crude from Saudi Arabia. Economists say that it is the beginning of the struggle for the global oil market between the United States and OPEC+ countries, in particular with Saudi Arabia. This version is followed by Gaidar Hasanov, a specialist at the International Financial Center. "The US strategy included high oil prices, about $75-$80 per barrel when using such "instruments" like Iran and Venezuela. Such levers of influence on world oil prices have shown their effectiveness," the expert emphasizes. At the moment, the United States, striving for unconditional leadership, can offer its oil at a good discount to get ahead in supply of OPEC+ countries, Mr. Hasanov summarizes. The material has been provided by InstaForex Company - www.instaforex.com |
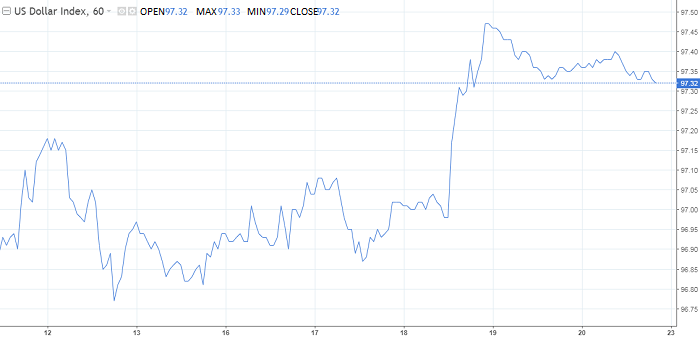
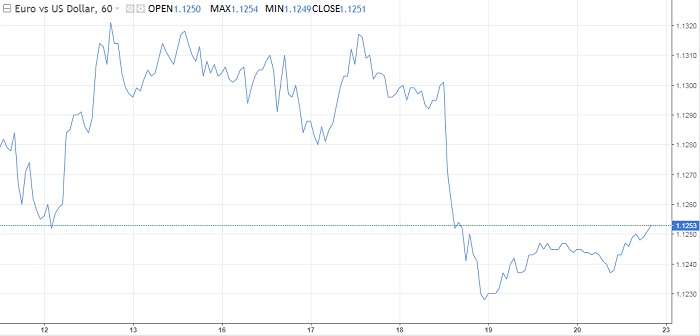
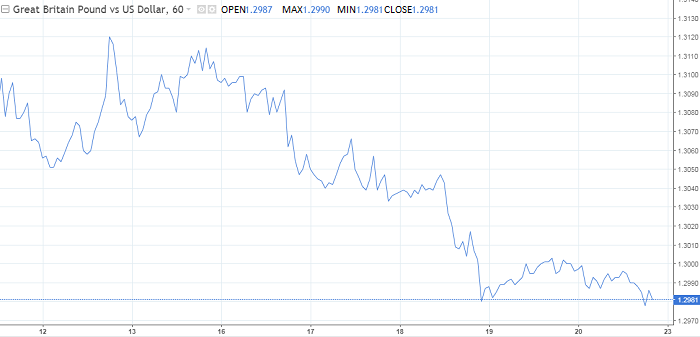
| The dollar rejoices. How long? Posted: 22 Apr 2019 03:44 PM PDT The dollar started a new week on the positive. The mood of the US currency has improved the consensus forecast of Bloomberg experts, according to which the US economy in the first quarter will expand by 2.2%, and not by 1.5%, as was said in March. At the same time, the respondents from Wall Street Journal see a figure of 2.4%, and a leading indicator from the Atlanta Federal Reserve Bank indicates a 2.8% increase in GDP. On Monday, the dollar index is trading around 97, staying near local highs over the past six months. Correctional kickbacks have recently become less and less deep. This may indicate a decrease in pressure from the "bears" on the US currency. A breakthrough of the resistance area can shift the scope of the bulls to an important round level of 100. Then it is possible to test the 103 mark, where the dollar rose in early 2017. Of course, a strong economy is good for the dollar, but not in this case. The Federal Reserve is now in rest and waiting mode, so the benefit goes towards the global GDP. Chicago Fed President Charles Evans said that in case of a decrease in inflation and a long stay near 1.5%, the central bank will need to play it safe and loosen its monetary policy. The index of personal consumption expenditures will slow in March to 1.6%, a JP Morgan study showed. Fed Vice President Richard Clarida said that the recession was not the only reason for which the regulator had previously resorted to monetary expansion. Thus, during the 12 months from February 1994, the rate increased from 3.25% to 6%, and then was reduced at three FOMC meetings. The reason - the rate of inflation was much lower than the forecast of the central bank. It's funny, but if you use the Eurostat methodology to calculate the US CPI, the situation will turn into a catastrophe at one point. It turns out that prices in America are slowing even faster than in the eurozone. As for the EUR/USD pair, its fall, most likely, is due not to a strong dollar, but to a weak euro. However, the fact that the economies of the United States and the People's Republic of China give out indicators above the forecast, as a result will have a positive impact on the GDP of the euro bloc. In addition to slowing growth in the euro area, a major reason for the depreciation of EUR/USD is the difference in the level of interest rates in the Fed and the ECB. This factor also makes selling the EUR/USD pair profitable in case of low volatility, as it is now. Thus, the demand for borrowed funds in euros to buy the US currency will ensure a subsequent decrease in quotations in the near future. The single currency is likely to go to $1.12, and possibly lower. However, the potential of a downward campaign is limited, and a return to the resistance of $1.1325 will be a strong argument in favor of fans of the euro. Regarding the pound Last week, the UK published "motley" statistics. The reduction in inflation does not add optimism, but the steady growth of wages against the positive background of retail sales supports the idea of raising the rate of the central bank of England. This should be taken seriously only if Britain is "profitable" in divorcing the EU. It's complicated. No exit without a deal is now unacceptable, and no one knows which of the options the central bank considers to be "the best". Parliament is returning from a long Easter weekend, but no new votes on the topic of Brexit are planned for the time being. Traders expect at least a hint of compromise from British politicians. Rumour has it that the regional leaders - the Labour party will come up with a proposal for Corbyn to refuse from a repeated referendum for finalizing an already ratified agreement. Such a step will help reach a compromise with the government, including in terms of maintaining UK membership in the Customs Union with the EU. If Theresa May and Jeremy Corbyn manage to agree, then at least local political support from the European Union will be guaranteed. This alignment contributes to a stable growth of the pound, and then the euro. |
| The US dollar can not yet find support but the Canadian dollar could Posted: 22 Apr 2019 03:44 PM PDT The dollar is marking time and, apparently, is not going to start moving yet. At the beginning of the week, the Canadian dollar distinguished itself, its growth was facilitated by a jump in oil prices after Washington's statements about sanctions for large Iranian oil importers. Recall that the financial markets in Australia, Hong Kong and many large European countries are closed due to Easter holidays, and although the currency markets are working, the trading volume will be small. The dollar, which not so long ago received support from the growth of yield of US Treasury bonds and signs of growth in the global economy, suspended its rise. Currently, traders need to closely monitor the US GDP report, which will be released this Friday, in order to get additional information about the state of the American economy. In the meantime, the rise in oil prices is the main driving force in foreign exchange markets. On Monday, the price of Brent crude oil exceeded $74 per barrel, which is the highest since November, because US President Donald Trump decided to ban the purchase of Iranian oil to eight countries that previously could do it without fear of US sanctions. With the rise in oil prices, which is one of the main export goods of Canada, the currencies of these countries also jumped in price against the dollar. The material has been provided by InstaForex Company - www.instaforex.com |
| The cost of oil is growing rapidly, but Saudi Arabia will not allow a deficit Posted: 22 Apr 2019 03:44 PM PDT The beginning of the week was positive for oil. The cost of the Brent reference mark exceeded $74 per barrel, the highest since November, as the United States announced further sanctions aimed at reducing the export of Iranian oil. The United States will ban the purchase of Iranian oil to eight countries that were previously allowed to do this in order to reduce oil revenues in Iran. This decision caused uncertainty about the stability of global supply. Brent crude increased by 3.3 percent, to $74.31 a barrel, and American WTI by 2.9 percent, to $65.87 a barrel. Earlier, Washington promised not to impose sanctions on the eight main buyers of Iranian oil - China, India, Japan, South Korea, Taiwan, Turkey, Italy and Greece - this allowed them to continue to make limited purchases for six months. Secretary of State Mike Pompeo confirmed that Washington's goal is to reduce the export of Iranian oil to zero, and added that the US does not plan to provide any grace period after May 1. Restrictions on Iranian exports will lead to a further reduction in supply in the market, which has already been tightened as a result of the introduction of US sanctions against Iran and another OPEC member Venezuela, as well as voluntary cuts in OPEC production. Trump said that Saudi Arabia and other OPEC countries can "compensate" for any reduction in Iranian oil supplies. Saudi Arabia said it would coordinate with other producers to ensure adequate supply of oil and a balanced market. Experts predict that Saudi Arabia will quickly increase production. The material has been provided by InstaForex Company - www.instaforex.com |
| The most truthful rumors (weekly review of EUR/USD and GBP/USD) Posted: 22 Apr 2019 03:44 PM PDT Frankly, last week was supposed to be extremely boring and languid. Although a lot of extremely interesting macroeconomic data were released. But the week was short because of Easter, for which all respectable Europeans, who started to rest on Friday, were preparing very actively. But before that, it was still necessary to go shopping, buy all sorts of goodies on the holiday table. Yes, do not forget about gifts to relatives and friends. So Europe was not up to some kind of stock trading. Plenty for you. There are more important things than all kinds of quotes and the like. So, ahead of the holiday troubles, investors didn't particularly care that the growth rate of industrial production in the United States slowed down from 3.5% to 2.8%, and retail sales accelerated their growth rates from 2.2% to 3.6%. They brushed off the fact that wholesale stocks rose by 0.2%, and commercial stocks by another 0.3%. Moreover, they did not care at all that wholesale stocks have been growing for fifteen months in a row, and commercial stocks - for eleven consecutive months. They are absolutely indifferent that a decline of 0.1% in the construction industry in Europe gave way to an increase of 5.2%. Just as no one was interested in the fact that the growth rate of average wages in the UK slowed down from 3.5% to 3.4%, and the number of applications for unemployment benefits rose from 26.7 thousand to 28.3 thousand. After all, no attention was given to the fact that inflation in the United Kingdom remained unchanged, while the growth rate of retail sales accelerated sharply from 4.0% to 6.7%. And of course - the British politicians themselves were distracted by the extremely important discussions of exactly how to "divorce" the European Union, and stood in queues for shopping. They were not up to the negotiations and loud statements. They will think about it later. There were more important things to do. Nevertheless, something, or rather someone, was able to briefly distract respected people from such an exciting occupation for a moment. Yes, so then the question was: "what was it?". Exactly before good Friday, early Thursday morning in particular, in one extremely self-respecting means of mass agitation and disinformation, bearing the name of its founder, who recently was the mayor of New York, the news was published, which stirred absolutely everyone who was not standing in line and for some strange reason was sitting at the trading terminal. The headline of the news said that the position of Mario Draghi, who is set to leave his post on October 31 of this year, is being considered by the head of the German federal bank Jens Weidmann. The effect of this news suggests that most people do not read anything but the headlines. After all, the head of the European Central Bank does not hold the office for life, but is appointed for eight years, so then sooner or later someone else must come to replace Mario Draghi. The term of his office is coming to an end, it is not surprising that now the selection of candidates is being actively conducted. When many saw that the representative of Germany was being considered for the post of head of the European Central Bank, and from the title it was possible to conclude that the issue had already been resolved, several people became so frightened that they simply arranged a sale of the single European currency. So it is clear to everyone that it is Germany that has the greatest weight and influence in the European Union, but the Germans themselves do not occupy leading positions in all-European structures. Such news could be regarded only as the fact that Germany is settling the last formalities for the transformation of the European Union into the Fourth Reich. After all, the European Central Bank already makes its decisions, first of all, with an eye to the interests of Germany, and if it is headed by a German, then the interests of other countries in general will not be taken into account. But what makes it a comic situation is that the same Jens Weidman is not even among the top five most likely to replace Mario Draghi. But as the head of one of the national central banks, he is, of course, included in the list of candidates for the post of head of the European Central Bank. So once again the masters of headlines made a rustling noise. Honestly, if the media agitation and misinformation don't start to cause panic again, then the coming week promises to be even more boring than the previous one. Not only that, on Monday, Europe continues to rest on the occasion of Easter, so there is no macroeconomic data either. No, of course, something is published there, but all this is extremely uninteresting. With the exception of preliminary data on the United States GDP for the first quarter of this year, which is expected to show a slowdown in economic growth. In addition, housing sales in the secondary market could fall by 2.3%, and new homes by an additional 2.6%. So there are not so many reasons for optimism about the dollar. Although Donald Trump, it seems, has already "made America great again". So the single European currency will have a good reason to win back the random collapse that happened at the end of last week, and could end the week at 1.1325. A similar fate awaits the pound, which ran after the single European currency against the background of strange headlines about the future head of the European Central Bank. In addition, in the UK, data on public sector borrowing will be published, the amount of which should remain almost unchanged. So the pound has a good chance to grow to 1.3100. |
| AUD/USD. Australian inflation could knock out the aussie Posted: 22 Apr 2019 03:43 PM PDT The Australian dollar paired with the US currency is gradually declining against the background of an absolutely empty economic calendar. By and large, Australia's trading floors this week will be open for only three days: today the country celebrates Easter Monday, and it will celebrate ANZAC Day on Thursday - the national holiday of Australia and New Zealand. Such "holidays" are characterized by low liquidity and at the same time an increased risk of unusual price fluctuations. In addition, key data on the growth of Australian inflation will be published on Wednesday, which are now of particular importance in light of the upcoming meeting of the Reserve Bank of Australia. In other words, despite the short trading week, increased volatility is expected for the AUD/USD pair. By and large, the aussie is clamped in a fairly wide price range. For several months, the pair, like a ping-pong ball, has been pushed off from the lower limit of the price band (0.70 area) and goes to its "ceiling" - the mark of 0.7250. Both buyers and sellers of AUD/USD have tried several times to go above/below the indicated boundaries, but the contradictory fundamental background returns the price to the usual framework each time. However, the confrontation between bears and bulls of the pair continues, and in this context, the release of data on the growth of Australian inflation can play an important role. The consumer price index in Australia has been declining for the second quarter in a row. If in the second quarter of 2018, this figure was 2.1%, then in the 4th quarter of last year the indicator came out at 1.8% (in annual terms). In the first quarter of this year, inflation should also show a negative trend, falling to the level of 1.5% yoy. On a quarterly basis, the situation does not differ for the better – after an increase to 0.5%, a decline to 0.2% is expected. If the release comes out at the forecast level (and even more so - below expectations), the aussie will weaken throughout the market, including in tandem with the dollar. Here it is necessary to recall, against the background of some fundamental factors, the Australian dollar rose in price last week. In total, there are three factors – the growth of the commodity market, a positive from China and the weakening of the greenback. To date, their influence has weakened for several reasons. In particular, iron ore began to gradually become cheaper after the price reached record highs – $94 per ton. This rise is explained simply: at the beginning of the year in Brazil there was a breakthrough of the dam of the Corrego de Feijao mine, which is owned by Vale. Waste from the mining and processing complex flooded the nearby municipality, killing more than 200 people. The Brazilian court froze the company's assets that are worth more than four billion dollars, thus covering the potential costs of compensation, salaries and other unforeseen expenses. After that, the cost of iron ore increased sharply, as one of the "three whales" of the market de facto dropped out of the game. Last week, however, Vale's representatives said they were planning to resume work at the Brucutu mine, which is one of the largest mines in Brazil. After that, the cost of a ton of iron ore dropped from $94 to the current $87, putting pressure on the aussie, as the Australian economy is focused on exporting raw materials (iron ore, copper, coal). In addition, the Australian dollar was under pressure from the soft rhetoric of the representatives of the RBA. Last week, the minutes of the previous meeting were published, and the AUD/USD bulls did not like the tone. Most of the members of the regulator were in favor of maintaining a wait-and-see position, however, some of them admitted the likelihood of monetary policy easing. Let me remind you that the "neighbors" of the RBA - members of the Reserve Bank of New Zealand - at the last meeting actually warned about lowering the interest rate. Now, similar steps are expected from the Australian central bank. In this context, inflation will play a crucial role: if the consumer price index continues to swoop down (which is very likely), the pressure on the aussie will increase significantly. From a technical point of view, the situation is uncertain. As a result of many months of confrontation, the price should choose its own vector of further movement - either the sellers will consolidate in the area of 0.69 and below, or the buyers will return the pair to the range of 0.73-0.7580. But at the moment, the pair is trading at the middle line of the Bollinger Bands indicator (on the daily chart), falling from a local high level of 0.7210. If the pair breaks through this support level, then the next price outpost will be 0.7070 - this is the lower line of the above indicator. The material has been provided by InstaForex Company - www.instaforex.com |
| April 22, 2019 : GBP/USD Intraday technical analysis and trade recommendations. Posted: 22 Apr 2019 10:57 AM PDT
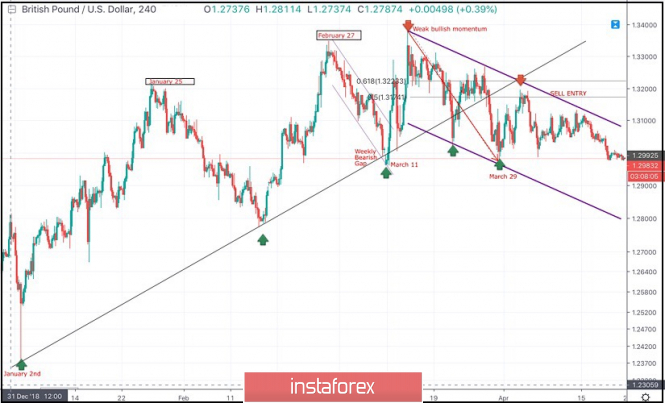
On January 2nd, the market initiated the depicted uptrend line around 1.2380. A weekly bearish gap pushed the pair below the uptrend line (almost reaching 1.2960) before the bullish breakout above short-term bearish channel was achieved on March 11. Shortly after, the GBPUSD pair demonstrated weak bullish momentum towards 1.3200 then 1.3360 where the GBPUSD failed to achieve a higher high above the previous top achieved on February 27. Instead, the depicted recent bearish channel was established. Significant bearish pressure was demonstrated towards 1.3150 - 1.3120 where the depicted uptrend line failed to provide any bullish support leading to obvious bearish breakdown. On March 29, the price levels of 1.2980 (the lower limit of the depicted movement channel) demonstrated significant bullish rejection. This brought the GBPUSD pair again towards the price zone of (1.3160-1.3180) where the upper limit of the depicted bearish channel as well as the backside of the depicted uptrend line came to meet the pair. Bearish rejection was anticipated around the mentioned price levels (1.3150-1.3180). However, the GBPUSD bullish pullback failed to pursue towards the mentioned zone. Instead, significant bearish rejection was demonstrated earlier around the price level of 1.3120. Since then, Short-term outlook has turned into bearish towards 1.2920-1.2900 where the lower limit of the depicted channel is located. Trade Recommendations: Any bullish pullback towards 1.3120-1.3140 should be considered for another SELL entry. TP levels to be located around 1.3100, 1.3020 then 1.2950 - 1.2920. S/L to be located above 1.3170. The material has been provided by InstaForex Company - www.instaforex.com |
| April 22, 2019 : EUR/USD Intraday technical analysis and trade recommendations. Posted: 22 Apr 2019 10:49 AM PDT
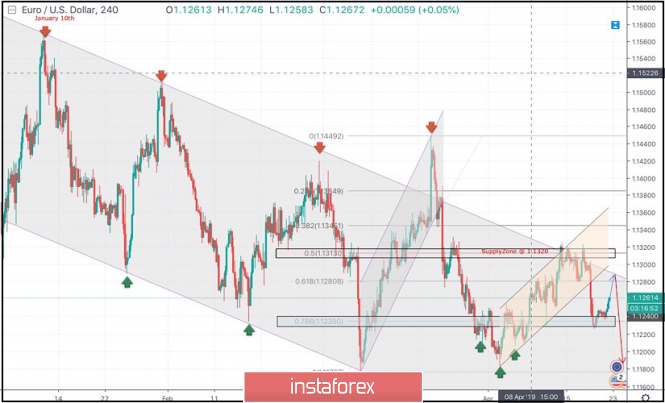
On January 10th, the market initiated the depicted bearish channel around 1.1570. Since then, the EURUSD pair has been moving within the depicted channel with slight bearish tendency. On March 7th, recent bearish movement was demonstrated towards 1.1175 (channel's lower limit) where significant bullish recovery was demonstrated. On March 18, a significant bullish attempt was executed above 1.1380 (the upper limit of the Highlighted-channel) demonstrating a false/temporary bullish breakout. On March 22, significant bearish pressure was demonstrated towards 1.1280 then 1.1220. Few weeks ago, a bullish Head and Shoulders reversal pattern was demonstrated around 1.1200. This enhanced further bullish advancement towards 1.1300-1.1315 (supply zone) where recent bearish rejection was being demonstrated. Short-term outlook turned to become bearish towards 1.1280 (61.8% Fibonacci) followed by further bearish decline towards 1.1235 (78.6% Fibonacci). For Intraday traders, the price zone around 1.1235 (78.6% Fibonacci) stood as a prominent demand area where a valid short-term BUY entry was suggested on Friday. On the other hand, conservative traders should be waiting for a bullish pullback towards 1.1280-1.1290 (backside of the broken bullish channel) for a valid SELL entry. Moreover, earlierbearish breakdown below 1.1235 opens the way for further bearish decline towards 1.1180-1.1170. Trade recommendations : A valid SELL entry can be taken around 1.1280 - 1.1290 when a bullish pullback occurs. TP levels to be located around 1.1250, 1.1235 and 1.1170. SL should be placed above 1.1320. The material has been provided by InstaForex Company - www.instaforex.com |
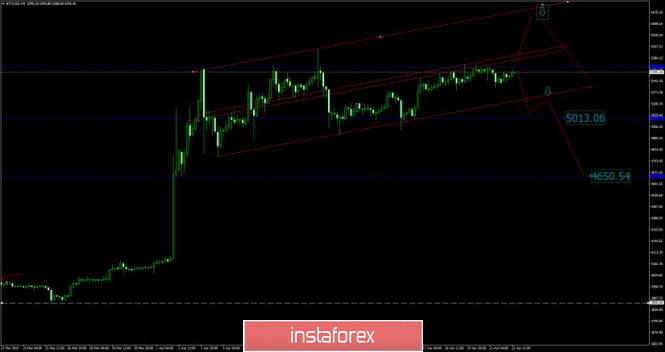
| Bitcoin is about to drop - Analysis for April 22,2019 Posted: 22 Apr 2019 06:50 AM PDT Investment banking giant JPMorgan Chase is planning to expand an existing blockchain project to include settlement features as it seeks to fend off competition from payments upstarts such as TransferWise and Ripple. We got some positive vibes from institutions about cryptos but the price action still suggest indecision. Technical picture:
According to the H4 time-frame, we found that that BTC is trading inside of the defined upward channel, which may be potential distribution channel for further lower prices. Anyway, we must be ready for both scenarios. Even we give more chances to the downside you can watch for upside in case that BTC breaks the resistance at $5.450. We give more chances to the down break of the channel and potential testing of $5.013 and $4.650.
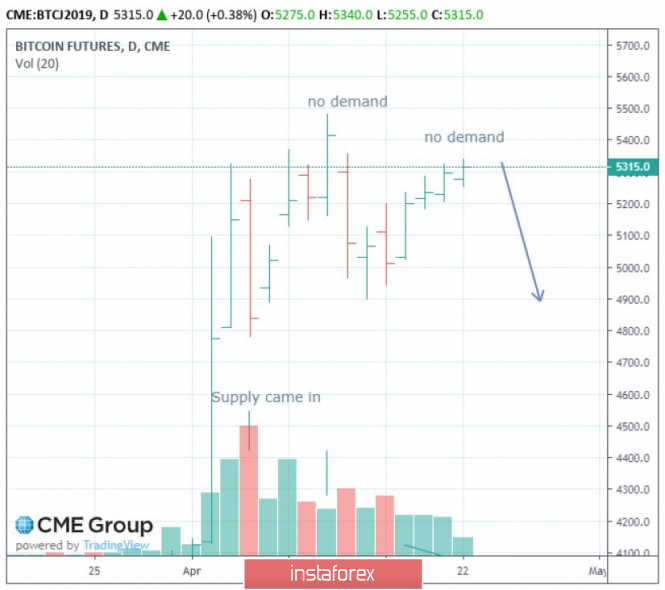
On the Futures market we found that after the strong push higher in the background and climatic action, there is the decreasing in the volume on the upside, which is sign that there is no big interest on the upside so selling may be a good option going further. Pay attention on the supports at $4.646 and $4.130, since these levels may be a very good levels to scale out our potential sell positions. The material has been provided by InstaForex Company - www.instaforex.com |
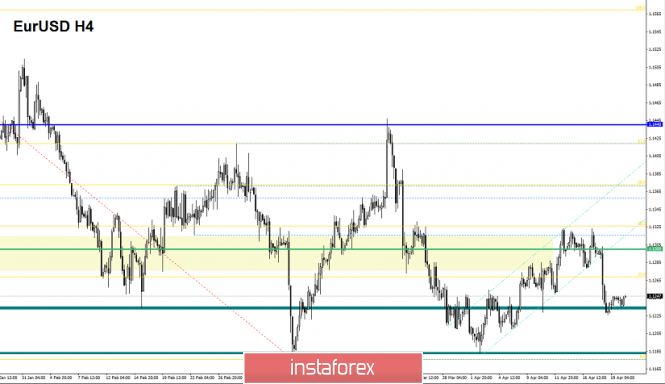
| EUR./USD analysis for April 22, 2019 Posted: 22 Apr 2019 06:23 AM PDT
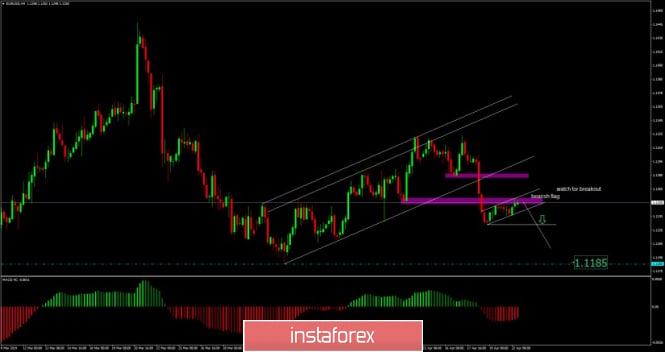
EUR/USD has been trading upwards in past few sessions. The price tested the level of 1.1250. According to the H4 time-frame, we found that there is the breakout of the larger upward channel in the background, which his sign that sellers are in control. We also found that bearish flag in creation, which is another sign of the EUR weakness. Support levels are seen at the price of 1.1226 and 1.1185. Resistance levels are seen at 1.1250 and 1.1277. Our recommendation: We will sell EUR if we see breakout of the support at 1.1226 with target at 1.1185. The material has been provided by InstaForex Company - www.instaforex.com |
| The gold is about to drop, 22.04.2019 Posted: 22 Apr 2019 06:14 AM PDT
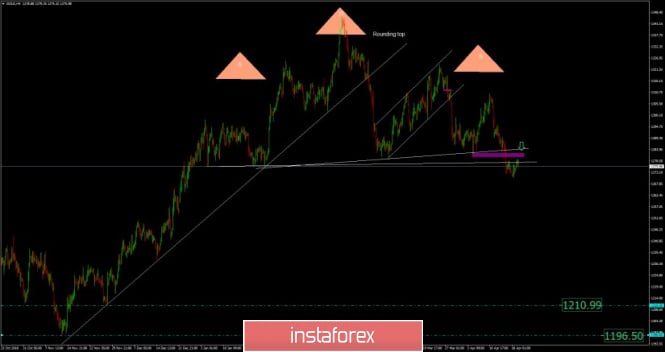
Gold has been trading downwards in past few sessions. The price tested the level of $1.270.80. According to the H4 time-frame, we found that there is the breakout of the 4-month long head and shoulders pattern in the background, which is sign that downward price is expected. Also, the rounding top formation is in the background together with the complex head and shoulders, which adds even more power on the downside. The key support at the price of $1.281.00 was broken and there is no significant support until $1.211.00 and $1.196.50. Our recommendation: We sold Gold from $1.275.70 and we did put targets at $1.211.00 and $1.196.50. Protective stop is placed at $1.312.00. The material has been provided by InstaForex Company - www.instaforex.com |
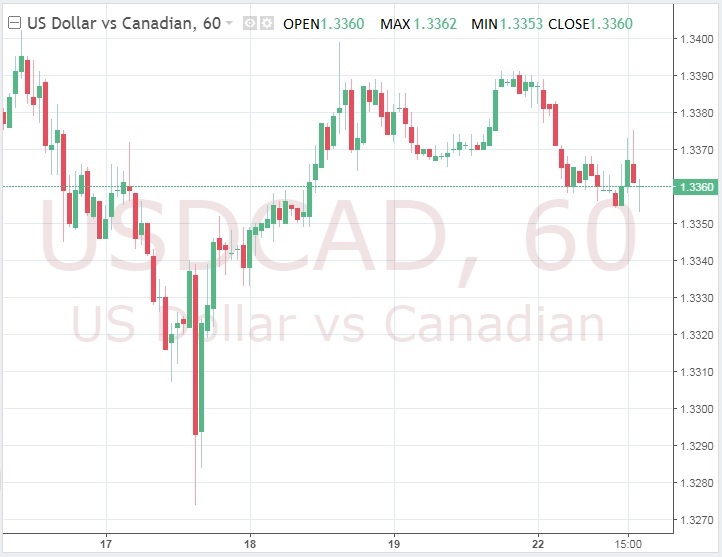
| Posted: 22 Apr 2019 05:31 AM PDT The announcement of the cancellation by Washington with the grace period for buyers of Iranian oil not only became a catalyst for more than 3% of Brent and WTI rally, but also allowed the currencies of black gold exporting countries to strengthen their positions in the race for the title of the best performer among the G10 monetary units. The Canadian dollar managed to intercept the leader's yellow jersey from the British pound but the presence of geopolitical risks and concerns about the central dovish rhetoric at the April 24 meeting did not allow the USD/CAD sellers to spread their wings. The modest success of "Looney" against the background of more than 30% of the rally Brent and WTI since the beginning of the year at first glance look strange. However, the economy of the maple leaf country does not live on oil alone. Non-energy exports fell 4% in February to their lowest level in 12 months and coupled with a slowdown in GDP to 0.1% QoQ in the fourth quarter, which forces the Central Bank to be extremely cautious. Indeed, the consumer prices in March accelerated from 1.5% to 1.9% and core inflation from 1.9% to 1.97% y/y. This exceeds the forecast of Bloomberg experts by 1.8% but the first indicator increased the rate is due to oil and the second has barely moved from its 1.9% average last year. Inflation is not too high and not too low, which allows BoC to sit on the sidelines. Dynamics of Canadian Inflation During its previous meeting, the regulator noted that the monetary policy in the current environment should remain stimulating and the value of the overnight rate of 1.75% to be below the neutral level between 2.5 and 3.5%. Stephen Poloz stressed that further decisions of the Bank of Canada will depend on incoming data and the presence of headwinds makes BoC sit on the sidelines. A significant shift in the world outlook of the central bank still counting on 2-3 acts of monetary restriction in 2019 at the end of 2018 should be viewed as a "bearish" factor for the loonies. If it were not for the rapid rally of oil, its positions would be significantly worse than the current ones. Uncertainty about the ratification of the US agreement with Mexico and Canada by the US Congress as concluded by Donald Trump also exerts pressure on the Canadian. According to the study of the International Trade Commission, it will add 0.35 pp to GDP and increase the number of jobs by 176 thousand. If the lawmakers do not approve the contract, new negotiations will have to be held. Uncertainty about the outcome of the dialogue between Washington and Ottawa did not allow the Loonie to strengthen in the past year. Thus, factors such as the reaction of oil to the decision of the United States to cancel the grace period for buyers of Iranian oil, rumors from the US Congress about the ratification of the NAFTA replacement agreement and the proximity of the Bank of Canada meeting allow loonies to claim the title of the most interesting currency of the week by April 26. If BoC decides to put pressure on its currency with the help of signals of a potential reduction in the overnight rate, then the USD/CAD quotes will be able to break through the upper limit of the consolidation range of 1.3295-1.3395. Technically, it formed in the framework of the "splash and shelf" pattern. Moving the pair out of the trading range is fraught with target sales of 161.8% or 78.6% using the AB = CD or Gartley patterns. USD / CAD daily chart |
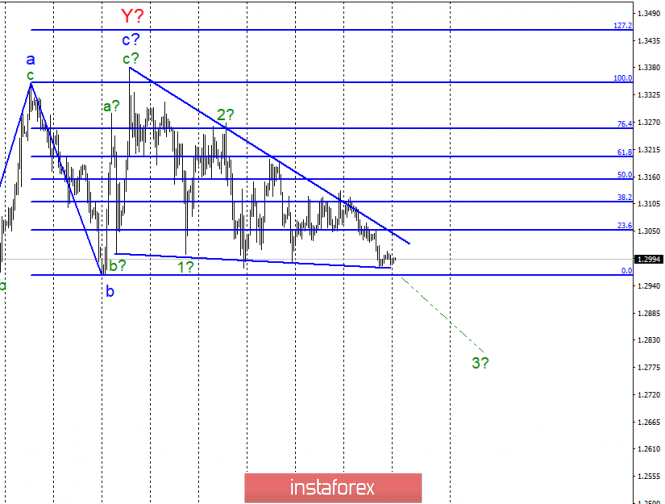
| Wave analysis of GBP/USD for April 22. The euro fell to the bottom line of the triangle Posted: 22 Apr 2019 04:42 AM PDT
Wave counting analysis: On April 19, the pair GBP/USD gained only a few base points and remained near the bottom forming a narrowing triangle of the line. A highly anticipated scenario. Market activity is now almost zero, there is no news, and the triangle itself does not yet give grounds for more active behavior. Everyone is waiting for the breakthrough of which line the tool will perform, as well as news. I believe that in case of a break of the level of 0.0% on Fibonacci, the pair can return to the execution of the option with the construction of a downward wave. And the probability of this will be high. I also note the fact that the Conservative Party may soon announce a new vote of no confidence to Theresa May and ask her to resign. And Theresa May's resignation will definitely not have a positive impact on the pound. Therefore, we are waiting for the development of events. Purchase goals: 1.3350 - 100.0% Fibonacci 1.3454 - 127.2% Fibonacci Sales targets: 1.2961 - 0.0% Fibonacci General conclusions and trading recommendations: The wave pattern still involves the construction of a downward trend. And the markets still can not withdraw a pair from the triangle, so the trades are held with a small amplitude. Accordingly, I recommend expecting a pair out of the triangle to determine the market mood for the near future. A successful attempt to break the 0.0% mark on Fibonacci will be a strong signal to sell the pair GBP/USD. The material has been provided by InstaForex Company - www.instaforex.com |
| What to expect from the euro: will it grow to $1.16 or decrease to $1.05? Posted: 22 Apr 2019 04:42 AM PDT Despite the fact that the EUR / USD pair remains close to multi-month lows, experts of Nordea Bank believe that the current ratio of potential income and risk is quite attractive in opening long positions. The reason for Nordea's upbeat sentiment on the euro was a message from the Middle Kingdom regarding the news in March where lending in the country has sharply jumped amid the growth of the M2 unit, which reached a 13-month high and amounted to 188.94 trillion yuan. "At some point, credit expansion may bring bitter rewards, but in the near future it implies a revival of the economy," representatives of the financial institute said. According to experts, there is a steady correlation between financial conditions in Asia and the rate of the euro against the US dollar. They believe that the accelerated development of the Chinese economy will lead to a surge in activity in other regions, which will contribute to reducing the difference in GDP growth in the United States and the rest of the world, which will be a positive moment for the euro. Nordea currency strategists recommend buying the EUR / USD pair with a target of 1.1650 and a stop at 1.1187. Meanwhile, analysts at Saxo Bank believe that Europe is in a losing fork in anticipation of the outcome of the trade negotiations between Washington and Beijing. "The more friendly the agreement, the higher the likelihood that China will transfer part of the demand for imports from the Old World to America. However, no matter what the deal is - friendly or not - there are risks of de-globalization and a slowdown in global GDP, which is a double problem for the EU, the world's largest economic bloc with a trade surplus" noted by Saxo Bank foreign exchange strategies. "If the global economy moves from slowing down to further deterioration, then Germany will surely be in the midst of a recession in the EU. The backlog of the country will again expose the Franco-German "front" and also lead to the fact that the debt problem from the dichotomy: "Germany - PIIGS countries" or "austerity - freedom of spending" will grow into a common European problem, "they added. "With regard to the ECB, the regulator is in complete confusion in terms of new initiatives after a decade of zero interest rate policy and the lack of growth, which could boast of its result," the authorities said. They admit that the EUR/USD pair could sink to the level of 1.05 in the second quarter. The material has been provided by InstaForex Company - www.instaforex.com |
| Wave analysis of EUR / USD pair on April 22. Market activity is zero on Easter Monday Posted: 22 Apr 2019 04:32 AM PDT Wave counting analysis: With the bidding on Friday, April 19, the EUR/USD pair ended with an increase of 10 basis points. here are reasons to assume that the wave takes a full-fledged of 5-wave view and its internal wave 2 has completed its formation at the moment. If this is true, the tool will move to building an ascending wave 3 from current positions with targets located around 14 figures. However, updating the minimum of the assumed wave 2 in "s" will most likely need to clarify the current wave marking. However, the working version is the current option with an increase. The news background for today will be absent in honor of the celebration of Easter Monday. High activity from the market should not be expected today. Sales targets: 1.1177 - 0.0% Fibonacci Purchase targets: 1.1448 - 100.0% Fibonacci 1.1476 - 76.4% on the highest Fibonacci grid General conclusions and trading recommendations: The pair presumably remains within the framework of the construction of wave c and its internal wave 2 is probably completed. Thus, it is now a good opportunity to buy the pair based on the construction of wave 3 in "s". As mentioned before, I recommend buying in small lots at first and increase them as the execution is confirmed. The material has been provided by InstaForex Company - www.instaforex.com |
| Trading Plan for EUR / USD pair on 04/22/2019 Posted: 22 Apr 2019 04:22 AM PDT Big Picture: Focus will be on the News from the US. On Monday, trading will be sluggish in Europe and the United States as the celebration of Easter continues in the half of the day. On Thursday and Friday, important news on the US economy will be released - orders for durable goods on Thursday - and the first GDP report for Q1 on Friday - we expect very weak data. Important news on the US economy will be released on Thursday and Friday such as the orders for durable goods on Thursday and the first GDP report for Q1 on Friday, where we expect a very weak data. EUR/USD: the consolidation of the pair continues. We look forward to the breakthrough of the boundaries of the range and the beginning of the trend. We buy from 1.1325. We sell from 1.1180. |
| Gold production in 2019 could be a record – opinion Posted: 22 Apr 2019 04:09 AM PDT
According to the calculations of the analytical company S&P Global Market Intelligence, the volume of gold production in the current year can be impressive and reach 109.6 million ounces. Experts believe that in this case the record of 2018 will be broken when the volume of precious metal production amounted to 107.3 million ounces. According to analysts, the level of production of the yellow metal is growing for the tenth year in a row. Over the past 10 years, gold production growth has reached an impressive 40%. According to the calculations of experts, in 2019, an increase in gold production is projected at 2.3 million ounces. This may be the most significant increase over the past three years, with 50% of the increase in gold production will be in new deposits, experts say According to Christopher Galbright, an expert in the market of precious metals, the current stability in the production of the yellow metal will continue until 2022. It is expected that the new deposits, which will earn in the next five years, will be able to consistently bring 4.3 million ounces of gold per year. Such projects will be involved until 2024. In the case of a number of other promising projects, another 11.7 million ounces of precious metal can be obtained, experts believe. However, some analysts do not share this optimism. They believe that since 2021, a reduction in the production of gold in old deposits may begin. In 2022, if this process grows, we can expect a decline in production of 3 million ounces, and in 2024 the decline will reach 5 million ounces of gold, experts warn. The material has been provided by InstaForex Company - www.instaforex.com |
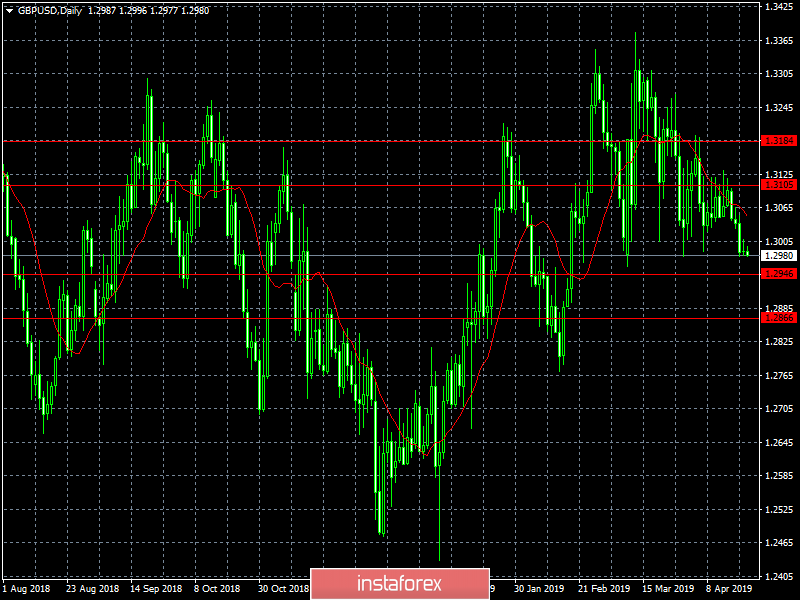
| Daily review on Indicator analysis for GBP / USD pair on April 22, 2019 Posted: 22 Apr 2019 04:07 AM PDT Trend analysis (Fig. 1). On Monday, the technical analysis gives a downward movement. The first lower target is 1.2979 on a lower fractal and then a rollback at 50.0% level (blue dashed line). Fig. 1 (daily schedule). Comprehensive analysis: - indicator analysis - down; - Fibonacci levels - down; - volumes - down; - candlestick analysis - up; - trend analysis - down; - Bollinger lines - down; - weekly schedule - down. General conclusion: On Monday, the technical analysis gives a downward movement. The first lower target is 1.2979 on a lower fractal and then a rollback at 50.0% level (blue dashed line). The material has been provided by InstaForex Company - www.instaforex.com |
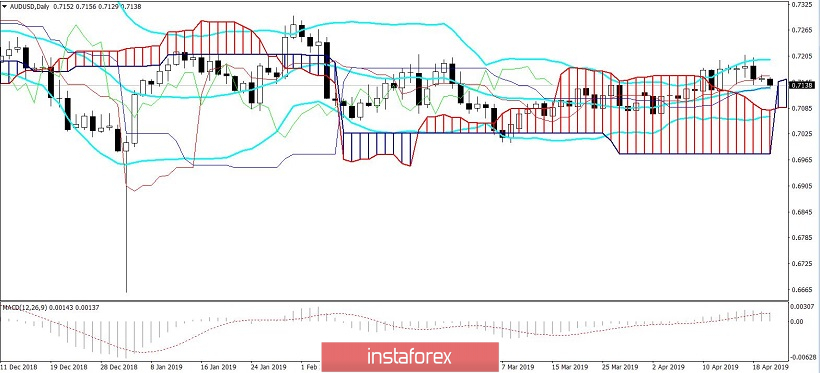
| Posted: 22 Apr 2019 04:02 AM PDT Part of the global trading floors is closed today due to the continuation of Easter holidays. A bright Monday is celebrated, which is clearly manifested in the low activity of investors. Although the United States will open tonight, it will undoubtedly revive the global financial market. Evaluating the current situation in the markets, we still believe that the overall situation of uncertainty will continue. In our opinion, this supposition will remain in force until the Fed's position and the opinions of other world central banks that depend on it regarding the prospects for monetary policies becomes truly understandable. So far, markets do not want to notice outright imbalances that manifest themselves in major economies after they are pumped with "cheap" money as a result of quantitative easing programs, which caused inadequate behavior of yield curves between short-term government bonds and long-term ones as manifested in the US. In particular, the US stock market continues to grow steadily currently, which is accompanied by a synchronous decline in market volumes. Here, it seems that the most important stimulating factor is the growth of expectations that the Fed will be forced not only to halt the process of raising interest rates but perhaps, even lowering them this year despite the slowdown of the American economy. On Monday, oil prices soared by more than 2.0% due to the position of the US Administration, which will impose sanctions on all countries buying crude oil from Iran as reported by Bloomberg. Other news such as the Venezuelan crisis, events around Libya and by OPEC+ actions aimed at reducing oil production. It will stimulate inadequate price increases for "black gold". In this case, we should expect continued growth in commodity exchange rates, although limited. With regard to the other currencies related to the major ones, we note that they will most likely remain in the range against the US dollar until trade disputes between the United States and China are resolved, as well as the position of the Fed regarding the prospects for monetary policy. Forecast of the day: The AUD/USD pair is likely to consolidate on Monday in the lateral range of 0.7135-0.7200. In case that the pair overcomes the level of 0.7135, it may continue to decline to 0.7090 in the opening of the US session. The USD/CAD pair is not responding to a sharp rise in oil prices. However, if the pair overcomes the level of 1.3355, then it can continue to drop 1.3290 during the opening of in North American trading hours. |
| Trading recommendations for the EURUSD currency pair - placement of trading orders (April 22) Posted: 22 Apr 2019 03:44 AM PDT By the end of the last trading week , the euro / dollar currency pair showed a low volatility of 19 points, where the quotation, to say the least, hung in one place. From the point of view of technical analysis, we have a temporary compression of the quotation 1.1235 / 1.1250, which occurred after the Thursday rally, where the quotation went down to the mark of 1.1226. Informational news background was absent due to the celebration of Good Friday in most countries. Today, in terms of news and events, we again have a day off Bright Monday in the UK and Europe. It is only in the United States where there are statistics on sales in the secondary housing market, and they expect a decline. United States 17:00 MSK - Sales in the secondary housing market (Mar): Prev. 5.51M ---> Forecast 5.311
Further development Analyzing the current trading chart, we see that the accumulation of 1.1235 / 1.1250 still takes place on the market, and the pullback that many are waiting for has not yet come. Traders, in turn, occupy a waiting position, tracking clear breakdown of the accumulation boundaries of 1.1235 / 1.1250 while maintaining the inertial move. - Positions for the purchase are considered in the case of a clear price fixing higher than 1.1255, with preservation of bullish interest. The primary outlook is 1.1270. - Positions for sale in the case of a clear price fixing lower than 1.1225 with preservation of bearish interest. The primary perspective is 1.1180.
Indicator Analysis Analyzing a different sector of timeframes (TF ), we see that in the short term there is an upward interest, which reflects our stagnation with the attempt to rollback. Intraday and mid-term prospects are focused on the downward course, against the backdrop of a recent rally. It should be understood that today trading volumes have been reduced, and the price, after all, is in a range of clusters, thus indicators indicators can be changeable. Weekly volatility / Measurement of volatility: Month; Quarter; Year Measurement of volatility reflects the average daily fluctuation , based on monthly / quarterly / year. (April 22, was based on the time of publication of the article) The current time volatility is 13 points. It is likely to assume that due to reduced volumes, the volatility of the day may be low. Key levels Zones of resistance: 1.1300 **; 1.1440; 1.1550; 1.1650 *; 1.1720 **; 1.1850 **; 1.2100 Support areas: 1.1180; 1.1000 * Periodic level ** Range Level The material has been provided by InstaForex Company - www.instaforex.com |
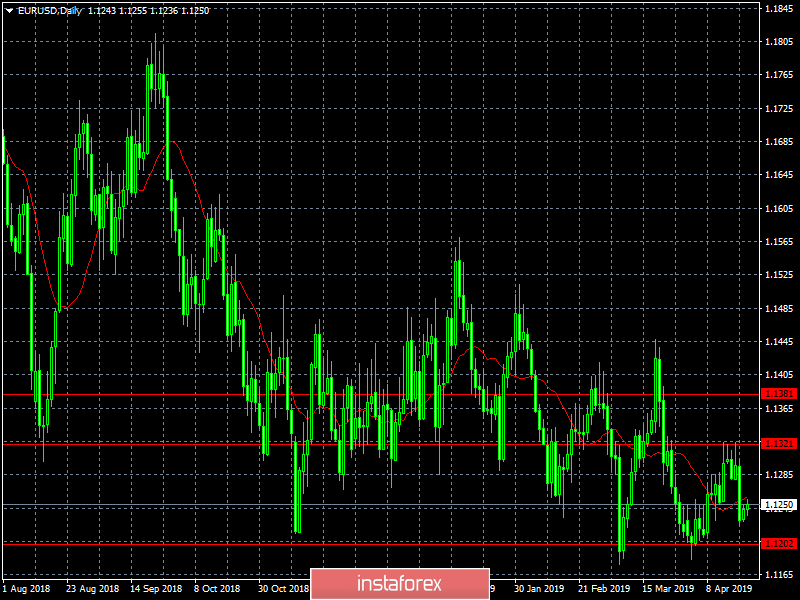
| Indicator analysis. Daily review on April 22, 2019 for the pair EUR / USD Posted: 22 Apr 2019 01:39 AM PDT On Monday, the market will continue to move down. Monday is festive, and so as the side channel. The first lower target is 1.1218. The recoiling level is 76.4% (blue dotted line).
Fig. 1 (daily schedule). Comprehensive analysis: - indicator analysis - down; - Fibonacci levels - down; - volumes - down; - candlestick analysis - up; - trend analysis - down; - Bollinger lines - down; - weekly schedule - down. General conclusion: On Monday, the market will continue to move down. Monday is festive, and so as the side channel. The first lower target is 1.1218. The material has been provided by InstaForex Company - www.instaforex.com |


| You are subscribed to email updates from Forex analysis review. To stop receiving these emails, you may unsubscribe now. | Email delivery powered by Google |
| Google, 1600 Amphitheatre Parkway, Mountain View, CA 94043, United States | |
No comments:
Post a Comment