Forex analysis review |
- GBP/CHF reversed off key resistance, expect further drop!
- NZD/USD approaching major support where we expect to see a bounce!
- EUR/JPY approaching major support, big upcoming bounce!
- The euro is likely to continue to fall, there is nowhere to wait for help
- What does the Golden Week in Japan promise to the yen?
- The greenback is gaining momentum, loonie awaits the BoC meeting, and pound sterling is waiting for positive news
- GBP/USD. April 24th. Results of the day. There are still no growth factors for the pound sterling
- EUR/USD. April 24th. Results of the day. The euro currency drops even without fundamental factors
- USD/JPY. What to expect from the Bank of Japan meeting?
- April 24, 2019 : EUR/USD Intraday technical analysis and trade recommendations.
- April 24, 2019 : GBP/USD Intraday technical analysis and trade recommendations.
- EUR and CAD: the Canadian dollar collapsed after the revision of the economic growth forecast. The euro is declining amid
- Bitcoin analysis for April 24, 2019
- Technical analysis of USD/CHF for April 24, 2019
- Technical analysis of NZD/USD for April 24, 2019
- BOC Monetary Policy Report news trading, USD/CAD analysis for 24.04.2019
- Gold analysis for April 24, 2019
- GBP / USD plan for the American session on April 24. Divergence did not allow bears to continue the decline of the pair
- EUR / USD plan for the American session on April 24. Data from the IFO did not support the euro
- Australian suffered from weak inflation, the dollar is preparing to go up
- The Australian dollar fell sharply
- Trading Plan on 04/24/2019
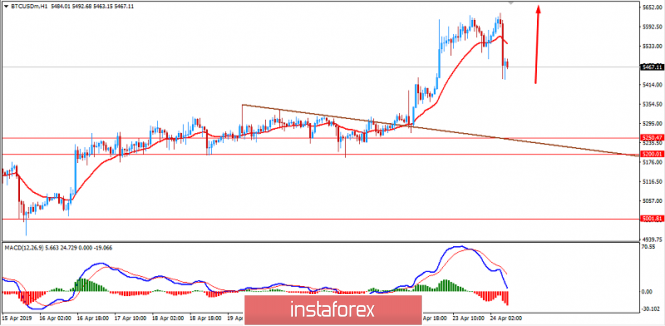
- BITCOIN to retain bullish pressure? April 24, 2019
- Fundamental Analysis of EURCAD for April 24, 2019
- EUR/USD, GBP/USD, USD/JPY. Simplified wave analysis and forecast for April 24
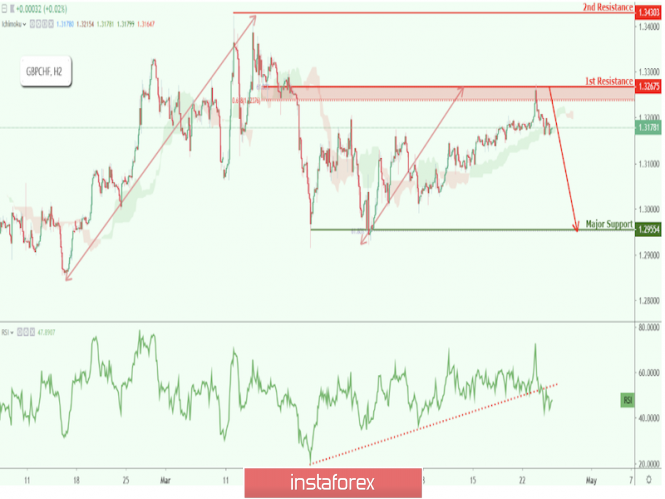
| GBP/CHF reversed off key resistance, expect further drop! Posted: 24 Apr 2019 07:29 PM PDT Entry : 1.3267 Why it's good : horizontal overlap resistance, 61.8% fibonacci retracement, 61.8% Fibonacci extension Stop Loss : 1.3430 Why it's good : horizontal swing high resistance Take Profit : 1.2955 Why it's good : horizontal swing low support, 61.8% fibonacci extension
|
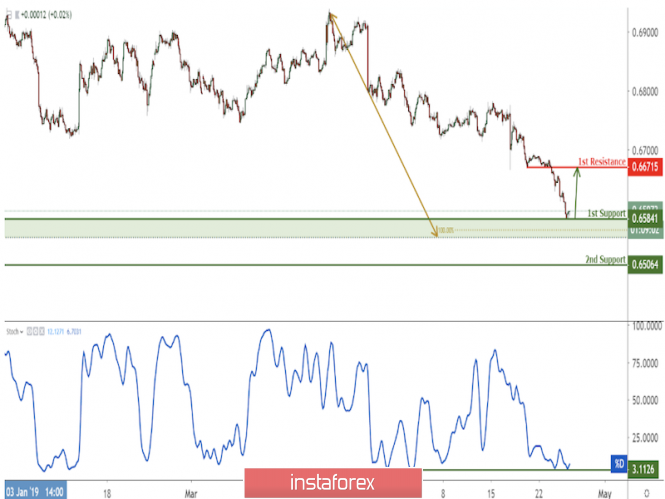
| NZD/USD approaching major support where we expect to see a bounce! Posted: 24 Apr 2019 07:27 PM PDT Entry : 0.6584 Why it's good : horizontal swing low support, long term 76.4% fibonacci retracement, long & short term 100% fibonacci extension Stop Loss : 0.6506 Why it's good : horizontal swing high resistance Take Profit : 0.6671 Why it's good : horizontal pullback resistance, 23.6% fibonacci retracement
|
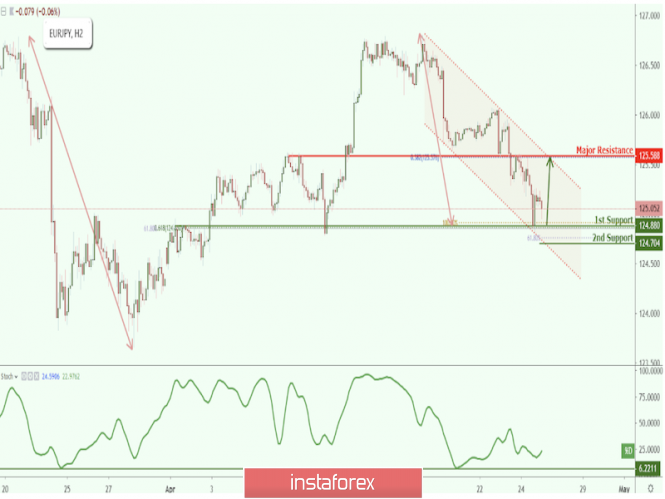
| EUR/JPY approaching major support, big upcoming bounce! Posted: 24 Apr 2019 07:26 PM PDT Entry : 124.88 Why it's good : horizontal overlap support, 61.8% fibonacci retracement, descending channel's support, 61.8% fibonacci extension Stop Loss : 124.70 Why it's good : 61.8% fibonacci extension Take Profit : 125.58 Why it's good : horizontal overlap resistance, 38.2% fibonacci retracement
|
| The euro is likely to continue to fall, there is nowhere to wait for help Posted: 24 Apr 2019 05:14 PM PDT The euro can not stand on its feet and continues to fall against the dollar. The single European currency still cannot get support. Neither the current position of the ECB, nor the incoming economic data contribute to the growth rate. The dollar, on the contrary, is growing on good news. Market participants had recently hoped that the restoration of more favorable conditions for lending in China would help increase the demand for German exports and lift the mood in the main economies of the eurozone, which in turn would have a positive effect on the euro. However, this did not happen. The pressure from trade conflicts and concerns about global protectionism negatively affect Europe's common external position and challenge further economic growth. Now the euro needs support more than ever, so it would not break down. Although the pound looks more stable against the background of the euro, by and large it has no special reasons for growth. The currency stays at a two-month low, weighed down by a large-scale dollar rally and fading hopes of a breakthrough in the negotiations of the British government and the opposition in the UK. The material has been provided by InstaForex Company - www.instaforex.com |
| What does the Golden Week in Japan promise to the yen? Posted: 24 Apr 2019 04:57 PM PDT Very soon, the Japanese markets will go on a long vacation, known as the Golden Week, which will be longer than usual this year and will last from April 27 to May 6. The memories of the January flash crash of crosses with the yen are still fresh in the memory of investors. This causes them to be alert and attempt to somehow protect their portfolios from possible fluctuations during the 10-day break. Recall that on January 3, the yen sharply rose against the US dollar, reaching almost a nine-month high around $107. The unexpected movements of the Japanese currency rate then puzzled and alarmed the traders. Moreover, such fluctuations were not limited to one currency pair. The yen showed a growth of a similar amplitude against the Australian dollar, as well as in pairs with some currencies of developing countries. The risks associated with the yen are making traders nervous over the upcoming long holidays in Japan. Practice shows that their fears are not groundless. According to Bloomberg, over the course of six of the past 10 years, the yen strengthened after the Golden Week. the Japanese currency has weakened three times and only in one case, in 2010, its course practically did not change. According to the consensus forecast of economists surveyed recently by the agency, by the end of June, the Japanese currency will rise to $110. "I do not expect a repeat of the flash crash of January 3, but we can see a smaller version of it," said Toshiya Yamauchi, general currency manager at Ueda Harlow Ltd. Several events, including the trade negotiations between Washington and Tokyo, the regular meeting of the US Federal Reserve on monetary policy and the publication of data on employment in the United States, will be held during the long spring break in Japan. This increases investor concerns about the sharp changes in the yen. "It seems that Japanese exporters are hedging early, given the narrowing of the forward discount and the widespread belief that the yen will rise during long holidays. Importers, on the other hand, refrain from trading before the holidays, since forward discounts are reduced due to the suspension of interest rate hikes by the Fed. The USD/JPY's fall in January is still fresh in memory, which is now forcing investors to place orders far from current levels," said Tomohiro Nishida from Sumitomo Mitsui Trust Bank. "The January 3 collapse occurred as a result of people accumulating long positions for the carry-trade at the end of last year on the eve of the New Year holidays. This time, there should be few longs, as the players have learned the lesson and made a profit. The USD/JPY downside game may not be successful due to the lack of carry trading. However, the yen's growth potential to $113-$114 remains during the holidays, since not all positions were closed during the USD/JPY pair's rebound following its fall on January 3. However, whatever this direction may be, the price movement will most likely not be so huge, considering that everyone is preparing for such a risk, "said Mikihiko Yoshida, spokesman for Tokai Tokyo Securities Co. "Activity is falling, as fund managers do little before the holidays. Japanese investors are not adding to long positions on USD/JPY, even though excessive concerns about a slowdown in global growth have disappeared, " according to June Kato, a specialist at Shinkin Asset Management. The material has been provided by InstaForex Company - www.instaforex.com |
| Posted: 24 Apr 2019 04:49 PM PDT After a long Easter weekend, traders resumed their activity, which led to a rather firm strengthening of the US currency. The latter rose on the eve against all major currencies, except for the Japanese yen, which found support from local government bonds and resistance near the 112 mark. The dollar index reached its highest level since June 2017 amid the release of a report on new home sales growth in the US in March to a 16-month high. These data followed recent positive news on retail sales and exports, which eased concerns about a sharp slowdown in the US economy, analysts say. "The dollar is gaining momentum, and we are seeing some downward trend in the euro as a whole," said Min Chang from Silicon Valley Bank. For the eurozone, the outlook remains negative, as the Bundesbank believes that economic growth in the region may fall short of expectations. After the EUR/USD fell to the bottom near the level of 1.1190, it again rose above the level of 1.1200, however, due to the continuing demand for the dollar, it is still under pressure. According to the preliminary data of the Directorate General for Economic and Financial Affairs of the European Commission, the consumer confidence index in the eurozone was -7.9 points in April against -7.2 points in March. Analysts had expected the indicator to be at the level of -7 points. "Consumers across Europe have become less optimistic about the prospects for the development of the economy of the currency bloc, which is an unexpected deterioration in sentiment and threatens to put pressure on the already weak economic growth in the region," reports The Wall Street Journal. Among the G10 currencies, the pound sterling suffered the smallest losses against the US dollar, despite the fact that it sank to a two-month low. British Prime Minister Theresa May is still eager to hold another vote on the "divorce" agreement with the European Union, which could happen next week, according to The Financial Times. The fact that the British Parliament can at any time agree to a customs union with the EU, apparently, forces the GBP/USD "bears" to exercise caution. It is assumed that in the short term, the pair will remain in the range of 1.28-1.33, and a decrease in its quotations will serve as a pretext for purchases that will become relevant if strong data on business activity in the manufacturing sector of Britain, as well as the appearance of hawkish notes in the rhetoric of the Bank of England. Since the beginning of the month, the USD/CAD pair was trapped in a narrow trading range of 1.32-1.34, and the breakdown of its upper border on Tuesday is an indicator of investors' expectations. The results of the next meeting of the Bank of Canada's monetary policy will be announced today. In March, the regulator pointed to increased uncertainty about the timing of interest rate increases in the future. Central bank officials were worried about consumer spending and inflation. Seven weeks have passed, and this concern might have eased due to the recovery in retail sales and rising consumer inflation. However, this may not be enough for the financial institution to abandon its "dovish" rhetoric. If at today's press conference, the management of the Bank of Canada continues to signal a slowdown in the country's economy and focuses on general uncertainty, the USD/CAD pair will rise to the level of 1.35. If optimistic statements are heard, it will pull down the pair to the level of 1.3330. |
| GBP/USD. April 24th. Results of the day. There are still no growth factors for the pound sterling Posted: 24 Apr 2019 04:29 PM PDT 4-hour timeframe The amplitude of the last 5 days (high-low): 38p - 74p - 29p - 23p - 91p. Average amplitude for the last 5 days: 51p (44p). On Wednesday, April 24, the British pound sterling began the weakest round of an upward correction and has almost completed the critical line. New important data on the topic of Brexit is still there. Therefore, the current correction is purely technical. The only macroeconomic report of today - the net borrowing of the public sector in the UK - turned out to be weaker than expected, but at the same time had no effect on the course of trading. Compared to yesterday, the volatility has decreased, which is logical, given the lack of important news. Therefore, yesterday's tumble seems like it occurred because a major player has entered the market with purchases of the US dollar. In general, as we have repeatedly mentioned, the pair's trend continues to be downward, and only a fall can be predicted in the current situation. Thus, the rebound in prices from the Kijun-Sen line may just provoke a resumption of the downward movement. The most awaited news from the British Parliament concerns the possible resignation of Theresa May. As already reported, some members of the Conservative Party are ready to announce a new vote of no confidence in the prime minister. Theresa May's resignation could lead to a stronger selling of the pound, at least in the short term. What can provide support in the coming months to the pound sterling is difficult to imagine. It is difficult to assume what can support the pound sterling in the coming months. Due to Brexit, macroeconomic indicators in the UK are falling, which implies that a rate increase by the Bank of England is out of the question. Therefore, upward corrections are possible, but the downward trend is likely to continue. Trading recommendations: The GBP/USD currency pair started to adjust. Thus, sell orders with targets of 1,2902 and 1,288 remain relevant at the moment after the current correction, that is, after the price rebound from the Kijun-sen or after the MACD indicator turns down. Long positions with small lots are recommended to be considered not earlier than when the Kijun-sen line has been crossed with a target level of 1,3005 and the Senkou span B line. However, bulls may need fundamental support, which still does not exist. In addition to the technical picture, one should also take into account the fundamental data and the time of their release. Explanation of the illustration: Ichimoku indicator: Tenkan-sen - the red line. Kijun-sen - the blue line. Senkou Span A - light brown dotted line. Senkou Span B - light purple dotted line. Chikou Span - green line. Bollinger Bands indicator: 3 yellow lines. MACD Indicator: Red line and histogram with white bars in the indicator window. The material has been provided by InstaForex Company - www.instaforex.com |
| EUR/USD. April 24th. Results of the day. The euro currency drops even without fundamental factors Posted: 24 Apr 2019 04:13 PM PDT 4-hour timeframe The amplitude of the last 5 days (high-low): 45p - 78p - 19p - 27p - 69p. Average amplitude for the last 5 days: 48p (41p). The third trading day of the week for the EUR/USD pair ends with the resumption of a downward movement and an update of yesterday's low. Today, traders have not received any important macroeconomic information again; nevertheless, the moment when yesterday's low was updated and a re-test of the level of 1.1200 is very indicative. Since this time the pair did not rebound far enough from this level. Therefore, the chances of overcoming the level of 1.1200 grows, and with them there is a likelihood that the European currency will further fall against the US dollar, which has been brewing for several months. The most interesting part in this story is yet to come. The US Federal Reserve has stopped raising rates, and most likely there will be no monetary tightening in 2019. This was exactly what Donald Trump wanted, who believed that the US dollar was growing mainly because of Jerome Powell's aggressive and too "hawkish" policies. However, as we can see, the public announcement regarding the refusal of hikes for 2019 did not really help the euro currency or the pound sterling. Both currencies continue to decline in the long term. If the pound sterling falls mainly due to Brexit, then the euro currency does not have such a serious pressure factor. Here, most likely, the overall market propensity to buy US dollars is based on the better economic situation in America than in the EU. From a technical point of view, the pair has overcome the support level of 1.1205 and, accordingly, it can continue the downward movement to the second support level of 1.1167. Trading recommendations: The EUR/USD pair resumed its downward movement and overcame the level of 1.1205. A rebound from this area is still likely, but now the chances of continuing the downward movement are increasing. Thus, short positions with the target of 1.1167 are relevant. It is recommended to consider purchase orders in small lots with a target of 1.1248 and the Senkou span B line not earlier than when the price is consolidated above the Kijun-sen line. In this case, the initiative will go into the hands of bulls for some time. In addition to the technical picture, one should also take into account the fundamental data and the time of their release. Explanation of the illustration: Ichimoku indicator: Tenkan-sen - the red line. Kijun-sen - the blue line. Senkou Span A - light brown dotted line. Senkou Span B - light purple dotted line. Chinkou Span - green line. Bollinger Bands indicator: 3 yellow lines. MACD Indicator: Red line and histogram with white bars in the indicator window. The material has been provided by InstaForex Company - www.instaforex.com |
| USD/JPY. What to expect from the Bank of Japan meeting? Posted: 24 Apr 2019 03:51 PM PDT Two weeks ago, the dollar/yen pair occupied a price level of 111.70-112.10, after which the daily price chart started to resemble a flat line. Despite the phlegmatic price fluctuations, the USD/JPY actually stands still in anticipation of a powerful information. Traders even ignored the general strengthening of the dollar in the market, although in the other dollar pairs the greenback significantly strengthened their positions. Such stress tolerance is explained by a contradictory fundamental background. On the one hand, the demand for the yen was not reduced due to the increase in tensions around Iran - the Japanese currency still enjoys the status of a defensive asset. On the other hand, the growth of Chinese indicators, as well as progress in the US-China trade negotiations, remain interested in risk. Although the political conflict between Tehran and Washington can be developed, the market believes in the power of diplomacy. In 2013, Iran already threatened to block the Strait of Hormuz, but then it did not realize its intentions. In addition, the yen's growth is constrained by the activity of carry-traders, although this factor is more likely due to the "thin" post-holiday market. In other words, the current system of checks and balances have so far allowed traders of the USD/JPY pair to trade in a narrow range flat for two weeks, ignoring the sharp increase in the dollar index. But tomorrow's event may break this idle: we will find out the results of the April meeting of the Bank of Japan. According to the general opinion of experts, following a two-day meeting, the Japanese regulator will leave the parameters of monetary policy in its previous form. However, it is impossible to talk about this with 100 percent certainty after the events of three years ago. The Bank of Japan unexpectedly, without any warnings and "preludes", lowered the interest rate to a negative area. The piquancy of the situation was added by the fact that a few days before the central bank members' meeting, Haruhiko Kuroda assured the market that there was no intention to soften the conditions of monetary policy. Although since then the Japanese regulator has not presented similar surprises anymore, the "sediment has remained". And with the latest disappointing releases, the risk of making unexpected decisions increases in many ways. So, lately, Kuroda has increasingly mentioned that the regulator can take "further steps" to achieve the target level of inflation. This means that the Bank of Japan can expand the incentive program and lower the rate again. Let me remind you that the March consumer price index was at the forecast level, that is, at around 0.5%. On the one hand, this is a fairly good result, since from December to February this indicator was at the level of 0.2%. On the other hand, the growth rates are not impressive: for example, last year the indicator fluctuated around 1.3-1.4%. Core inflation reached the level of 0.8% with the forecast of growth to 0.7%. Since December last year, this indicator has been fluctuating in the range of 0.7% -0.8%, therefore, it is possible to speak of a "positive trend" here quite arbitrarily. Moreover, the consumer price index, excluding prices for food and energy, has shown stagnation - for the past three months, the indicator has reached 0.4%. Such figures obviously do not contribute to the tightening of the rhetoric of the Japanese central bank. However, weak inflation is not the only problem of the Japanese economy. The remaining releases are also disappointing. In particular, industrial output fell to 0.7% (with a growth forecast of 1.4%), household spending fell to -2% (with a decline forecast to -0.5%), and business confidence index fell to 40%. , 5 points. All this suggests that Japan's GDP growth rate in the first quarter will disappoint: at least, many experts are already warning about it. Despite this "bunch" of negativity, the Bank of Japan is unlikely to change the parameters of monetary policy tomorrow, although Haruhiko Kuroda recently made the probability of lowering the interest rate further into a negative area. He did not specify the temporary guidelines, but warned that such a scenario is quite likely. In my opinion, tomorrow the head of the central bank will again announce this thesis, thereby putting pressure on the yen. In addition, the Japanese regulator may reduce its own forecast for the growth of key indicators (primarily, we are talking about GDP and inflation). Thus, the results of the April meeting of the Bank of Japan are unlikely to please bears of the USD/JPY pair. There were no reasons for optimism: moreover, the latest macroeconomic releases help to soften the position of the central bank in general and Kuroda in particular. The technical picture of USD/JPY also speaks in favor of the upward movement. On the daily chart, it is located above the Kumo cloud of the Ichimoku Kinko Hyo indicator and above all its lines. A bullish "Parade of ines" signal indicates the potential for further price growth. In addition, the pair is located between the middle and upper lines of the Bollinger Bands indicator. This also indicates bullish sentiment among traders. The nearest target of the upward movement can still be considered the level of 112.60 - this is the resistance level and the upper line of the Bollinger Bands indicator on the D1 timeframe. Stop-loss can be placed in the support level area - this is the middle line of the Bollinger Bands indicator, which corresponds to the mark of 111.70. The material has been provided by InstaForex Company - www.instaforex.com |
| April 24, 2019 : EUR/USD Intraday technical analysis and trade recommendations. Posted: 24 Apr 2019 10:57 AM PDT
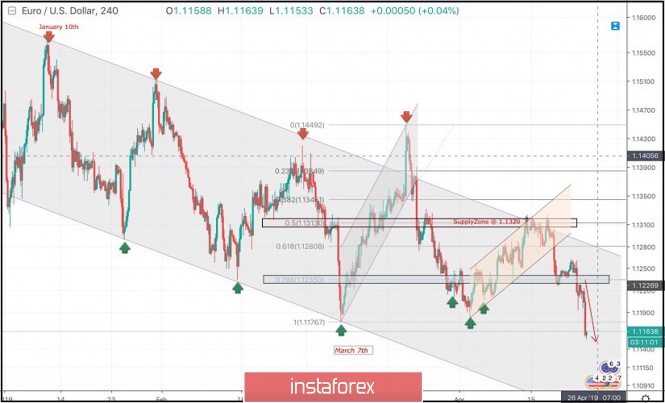
On January 10th, the market initiated the depicted bearish channel around 1.1570. Since then, the EURUSD pair has been moving within the depicted channel with slight bearish tendency. On March 7th, recent bearish movement was demonstrated towards 1.1175 (channel's lower limit) where significant bullish recovery was demonstrated. On March 18, a significant bullish attempt was executed above 1.1380 (the upper limit of the Highlighted-channel) demonstrating a false/temporary bullish breakout. On March 22, significant bearish pressure was demonstrated towards 1.1280 then 1.1220. Few weeks ago, a bullish Head and Shoulders reversal pattern was demonstrated around 1.1200. This enhanced further bullish advancement towards 1.1300-1.1315 (supply zone) where recent bearish rejection was being demonstrated. Short-term outlook turned to become bearish towards 1.1280 (61.8% Fibonacci) followed by further bearish decline towards 1.1235 (78.6% Fibonacci). For Intraday traders, the price zone around 1.1235 (78.6% Fibonacci) stood as a temporary demand area which paused the ongoing bearish momentum for a while before bearish breakdown could be executed two days ago. Conservative traders were advised to wait for a bullish pullback towards the newly-established supply zone around 1.1235 for a valid SELL entry. On the long-term, bearish persistence below 1.1235 enhances further bearish decline towards 1.1170 then 1.1115 if enough bearish momentum is expressed. Trade recommendations : A valid SELL entry was suggested around 1.1235 upon Yesterday's bullish pullback. TP levels to be located around 1.1170 and 1.1115. SL should lowered to 1.1197 to offset the associated risk. The material has been provided by InstaForex Company - www.instaforex.com |
| April 24, 2019 : GBP/USD Intraday technical analysis and trade recommendations. Posted: 24 Apr 2019 10:47 AM PDT
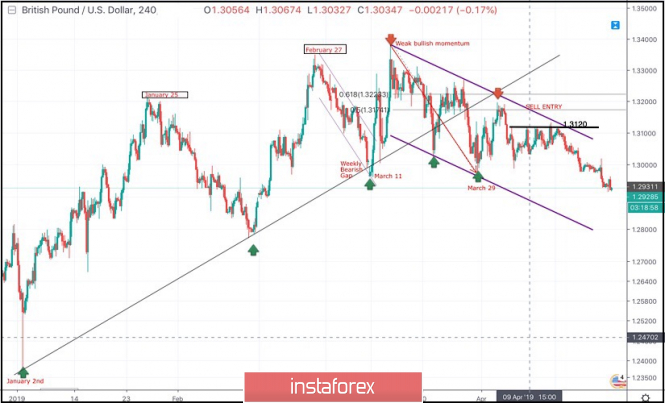
On January 2nd, the market initiated the depicted uptrend line around 1.2380. A weekly bearish gap pushed the pair below the uptrend line (almost reaching 1.2960) before the bullish breakout above short-term bearish channel was achieved on March 11. Shortly after, the GBPUSD pair demonstrated weak bullish momentum towards 1.3200 then 1.3360 where the GBPUSD failed to achieve a higher high above the previous top achieved on February 27. Instead, the depicted recent bearish channel was established. Significant bearish pressure was demonstrated towards 1.3150 - 1.3120 where the depicted uptrend line failed to provide any bullish support leading to obvious bearish breakdown. On March 29, the price levels of 1.2980 (the lower limit of the depicted movement channel) demonstrated significant bullish rejection. This brought the GBPUSD pair again towards the price zone of (1.3160-1.3180) where the upper limit of the depicted bearish channel as well as the backside of the depicted uptrend line came to meet the pair. Bearish rejection was anticipated around the mentioned price levels (1.3150-1.3180). However, the GBPUSD bullish pullback failed to pursue towards the mentioned zone. Instead, significant bearish rejection was demonstrated earlier around the price level of 1.3120. Since then, Short-term outlook has turned into bearish towards 1.2900, 1.2850 then 1.2800 where the lower limit of the depicted channel comes to meet the GBPUSD pair. Trade Recommendations: Any bullish pullback towards 1.3120-1.3140 should be considered for another SELL entry. TP levels to be located around 1.3100, 1.3020 then 1.2950 - 1.2920. S/L to be located above 1.3170. The material has been provided by InstaForex Company - www.instaforex.com |
| Posted: 24 Apr 2019 07:39 AM PDT The British pound reacted with growth in the first half of the day against the US dollar after the publication of the report, according to which the net borrowings of the UK public sector remained at a fairly low level in the fiscal year ending in March, which coincides with the strategy of the Minister of Finance. Back in the early fiscal year, Philip Hammond gave the fellowship to keep borrowing low, and he fulfilled it. According to data, for 12 months to March this year, the government's borrowings amounted to 24.7 billion pounds, which is 17.2 billion pounds less than in the previous financial year. Let me remind you that last year, the UK national debt amounted to 1.8 trillion pounds or 83.1% of GDP. Economists had expected loans of 22.8 billion pounds. Tax revenues for 12 months increased by 5%, while expenses only by 3%. As for the technical picture of the GBPUSD pair, the trade continues to be conducted in a narrow side channel with a bearish advantage. After sellers today failed to cope with yesterday's support level in the area of 1.2915, there is a small upward correction, which now rests on the resistance of 1.2950. Its breakthrough will lead to larger growth of the trading instrument and an update of the maximum of 1.3015. The European currency continued to decline in pair with the US dollar after the publication of reports, which indicated a decrease in the sentiment of German companies in April this year. Especially the mood worsened among manufacturers. According to the IFO German Institute, the IFO business sentiment index in April 2019 fell to 99.2 points against the March value of 99.7 points. Economists had expected the index to be 99.9 points in April. The IFO President noted that the German economy continues to lose momentum, which causes a number of concerns. On the one hand, the export-oriented industry continues to be in a recession, but support is provided by the domestic economy, which is doing quite well. The index of expectations of companies also fell after a slight increase in March As for the technical picture of the EURUSD pair, the update of the last day's minimum keeps the market on the side of the euro sellers, which can lead to the update of the lows in the area of 1.1170 and 1.1120. The Canadian dollar collapsed today after the Bank of Canada left the one-day interest rate target unchanged at 1.75%, and said that the soft policy of interest rates is still justified. The regulator also noted that it closely monitors household spending, the oil market, and international trade policy. Serious pressure on the Canadian dollar was formed immediately after the Canadian regulator revised the forecast for GDP growth in 2019 to 1.2% from 1.7%. The material has been provided by InstaForex Company - www.instaforex.com |
| Bitcoin analysis for April 24, 2019 Posted: 24 Apr 2019 06:34 AM PDT Technical picture:
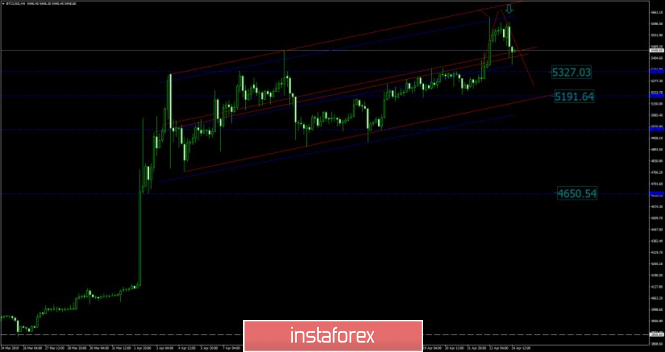
According to the H4 time-frame, BTC did exactly what we expected yesterday. BTC did reject from the upper diagonal of the upward channel at the price of $5.626. Our first downward target at the price of $5.365 has been met. We are expecting more downside.
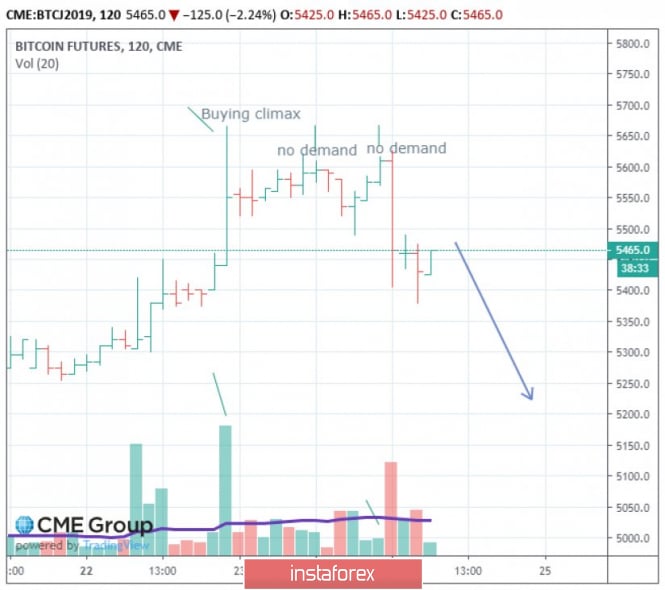
On the Futures market we found buying climax in the background, which is sign of the weakness and big warning for buyers. After the climatic action, there was no buying interest and we got few no demand bars on the 2H time-frame, which is another sign of the weakness. Watch for selling opportunities. Next downward targets are set at the price of $5.192 and $4.650. The material has been provided by InstaForex Company - www.instaforex.com |
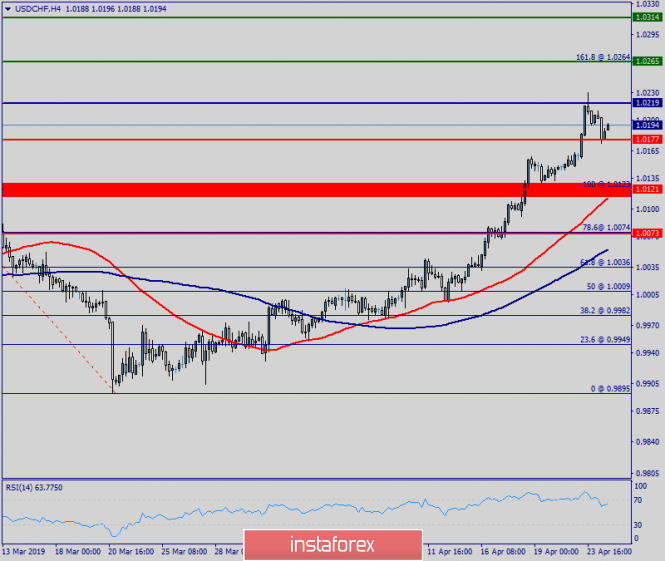
| Technical analysis of USD/CHF for April 24, 2019 Posted: 24 Apr 2019 06:20 AM PDT The USD/CHF pair continues moving in a bullish trend from the support levels of 1.0123 and 1.0177. Currently, the price is in an upward channel. This is confirmed by the RSI indicator signaling that the pair is still in a bullish trend. As the price is still above the moving average (100), immediate support is seen at 1.0177. Consequently, the first support is set at the level of 1.0177. So, the market is likely to show signs of a bullish trend around 1.0177. In other words, buy orders are recommended above the level of 1.0177 with the first target at the level of 1.0265. Furthermore, if the trend is able to breakout through the first resistance level of 1.0265, we should see the pair climbing towards the point of 1.0314. It would also be wise to consider where to place a stop loss; this should be set below the second support of 1.0123 . The material has been provided by InstaForex Company - www.instaforex.com |
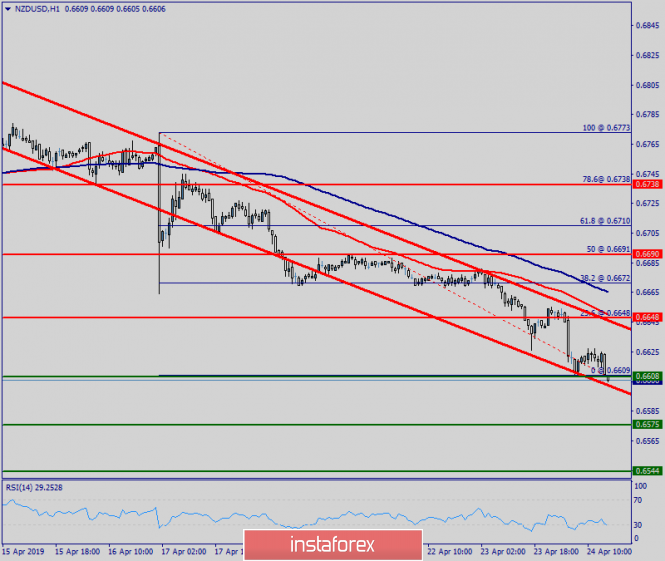
| Technical analysis of NZD/USD for April 24, 2019 Posted: 24 Apr 2019 06:14 AM PDT The NZD/USD pair is showing signs of weakness following a breakout of the lowest level of 0.6648. On the H1 chart. the level of 0.6648 coincides with 23.6% of Fibonacci, which is expected to act as minor support today. Since the trend is below the 23.6% Fibonacci level, the market is still in a downtrend. But, major resistance is seen at the level of 0.6690. Furthermore, the trend is still showing strength above the moving average (100). Thus, the market is indicating a bearish opportunity below the above-mentioned support levels, for that the bearish outlook remains the same as long as the 100 EMA is headed to the downside. Therefore, strong resistance will be found at the level of 0.6690 providing a clear signal to buy with a target seen at 0.6575. If the trend breaks the minor resistance at 0.6575, the pair will move downwards continuing the bearish trend development to the level 0.6544. The material has been provided by InstaForex Company - www.instaforex.com |
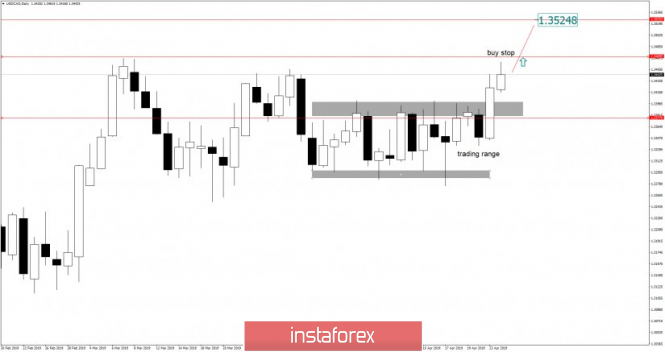
| BOC Monetary Policy Report news trading, USD/CAD analysis for 24.04.2019 Posted: 24 Apr 2019 06:01 AM PDT USD/CAD is trading near the critical resistance at the price of 1.3466. The background suggests further upward price and potential new highs.
We want to suggest play for the incoming Bank of Canada Monetary Policy Report. According to the Daily time-frame there was the upward breakout of the 2-week rectangle pattern (sideways base), which is sign that buyers are in control. Our advice is to place pending buy stop order at 1.3470 with target at 1.3523 and stop at 1.3380. You want to go in the direction of the overall trend and the momentum. Second play can be if the USD/CAD drop on the news, to watch for buying at 1.3400 with the target at 1.3523 and stop at 1.3333. The material has been provided by InstaForex Company - www.instaforex.com |
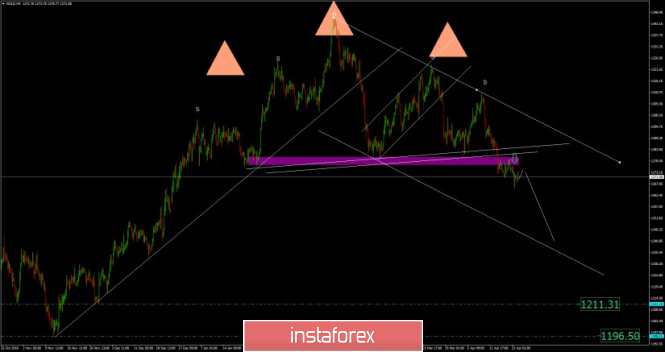
| Gold analysis for April 24, 2019 Posted: 24 Apr 2019 05:37 AM PDT Gold has been trading sideways in past 20 hours. Gold price made new low yesterday at $1.266.50 and we still expect more downside. As long as the key short-term resistance at the price of $1.281.00 we are bearish.
According to the H4 time-frame, we found more acceptance below the key support cluster (purple rectangle) at the price of $1.280.00, which is sign that sellers are in big control on the Gold. The 4-month long complex head and shoulders is dominating the background that sellers are very active on the Gold. There is no any serious indication of potential reversal and the price action suggests more downside. Gold price made series of the lower lows and lower highs and it is trading inside of the downward channel, which is clear indication of the downtrend. Our recommendation: We are bearish from $1.275.00 but we will add after every decent upward correction structure more selling position. Our advice is to watch for selling positions only. The downward targets are set at $1.211.30 and $1.196.50. The material has been provided by InstaForex Company - www.instaforex.com |
| Posted: 24 Apr 2019 05:31 AM PDT To open long positions on the GBP / USD pair, you need: Pound buyers took advantage of the morning support level around 1.2909, after the update of yesterday's low and formed divergence on the MACD indicator then returned to the market. The task for the second half of the day will be a breakthrough and consolidation above 1.2948 resistance, which will lead to a new rising GBP / USD wave with the update of the highs around 1.2985 and 1.3017, where I recommend taking profits. In the case of a repeated decline of the pound to the minimum of the day, it is best to open long positions from 1.2916 only if a false breakdown is formed or to rebound from the level of 1.2888. To open short positions on the GBP / USD pair, you need: As long as the bears are keeping the pair below 1.2948 resistance, the probability of a further decrease in the pound remains rather high. The formation of the next false breakout on this range will be a signal to open short positions, which will again lead the GBP / USD pair to the support area of 1.2916. Its breakdown will open the opportunity to update the minimums of 1.2888 and 1.2855, where I recommend to fix the profit. If the growth scenario is above 1.2948 in the second half of the day, it is best to return to short positions on a rebound from the maximum of 1.2985 and 1.3017. Indicator signals: Moving averages Trade is conducted below 30 and 50 moving averages, which indicates the preservation of the bearish nature of the market. Bollinger bands The volatility of the Bollinger Bands indicator is very low, which does not give signals to enter the market. Description of indicators MA (moving average) 50 days - yellow MA (moving average) 30 days - green MACD: fast EMA 12, slow EMA 26, SMA 9 The material has been provided by InstaForex Company - www.instaforex.com |
| EUR / USD plan for the American session on April 24. Data from the IFO did not support the euro Posted: 24 Apr 2019 05:25 AM PDT To open long positions on EUR / USD pair, you need: Weak reports from the IFO did not support the euro, however, the buyers did not stand aside, after it managed to form new support around 1.1195 and prevented the yesterday's minimum update. The challenge for the North American session will be a breakthrough and consolidation above the resistance of 1.1225, which will lead to the formation of a new upward correction with an update of the maximum of 1.1247 and 1.1262, where I recommend taking profits. In the case of a second EUR/USD decline in the second half of the day to the support area of 1.1195, long positions from this level are best to look at a false breakdown or buy a rebound from a larger range, which is located in the 1.1175 area. To open short positions on EUR / USD pair, you need: Bears require the formation of a false breakdown in the area of 1.1225, where the moving averages are also concentrated, which will keep the pair in a side channel and leave the market on the side of euro sellers. The main task for the second half of the day will be a breakthrough and consolidation below the support of 1.1195, which will lead to a new wave of EUR/USD sales to the area of 1.1175 and 1.1149 minimums, where I recommend taking profits. f the growth scenario is higher than 1.1225, you can take a closer look at short positions after updating the resistance of 1.1247. Indicator signals: Moving averages Trading is below 30 and 50 moving averages, which indicates the bearish nature of the market. Bollinger bands The volatility of the Bollinger Bands indicator is very low, which does not give signals to enter the market. Description of indicators MA (moving average) 50 days - yellow MA (moving average) 30 days - green MACD: fast EMA 12, slow EMA 26, SMA 9 Bollinger Bands 20 The material has been provided by InstaForex Company - www.instaforex.com |
| Australian suffered from weak inflation, the dollar is preparing to go up Posted: 24 Apr 2019 05:15 AM PDT
The Australian dollar was knocked down by lower than expected inflation rates. This has reinforced the prospect of a lower interest rate, while the US dollar continues to feel more than confident within the 22-month high reached during the previous session. The dollar has strengthened thanks to strong data on housing in the US — another indicator showing that the US economy is much superior to competitors. This optimism encourages investors to buy the dollars in recent weeks. It remains to wait until Friday when the most important data on GDP for the first quarter will be published. According to most experts, the US GDP will show strong growth, which will push the dollar even higher. Consider in more detail the situation with the Australian. Given the significant decline over the past 24 hours, we can expect a small rebound due to profit taking, but in general, the outlook for the currency is weak. Plus, there are too many AUD sellers on the market. The euro weakened by 0.1 percent to 1.12165 dollars but holds above Tuesday's lows of 1.1192 dollars. Although the German business climate index was lower than forecast, it had little effect on the already weaker single currency. The euro cannot rise, as negative sentiment persists after the disappointing PMI data, and only short positions keep it above the annual low. The currency can be saved by more positive economic data, good political news and higher yield of government bonds. |
| The Australian dollar fell sharply Posted: 24 Apr 2019 05:15 AM PDT
On Wednesday, April 24, experts recorded a rapid decline in the Australian dollar. It suddenly fell after the publication of data on the consumer price index in the country. The slowdown in inflation also contributed to the decline in the cost of AUD. According to Nick Twidale, Chief Operating Officer of Rakuten Securities Australia, in the event of increased sales of AUD on the London Stock Exchange, the Australian currency may become even cheaper and fall below 70 US cents. The expert is confident that in the near future, we should expect increased pressure on the "Australian". At the moment, the price of the Australian dollar fell by 0.9% to $ 0.7037. Analysts believe this is the lowest rate since March 11 this year. The catalyst for the fall was the publication of data on the consumer price index in Australia for the first quarter of 2019. The Green Continent also recorded a slowdown in inflation, which had a negative impact on the AUD rate. In the current situation, pressure on the regulator is increasing with respect to maintaining a soft monetary policy with the possibility of further lowering interest rates. |
| Posted: 24 Apr 2019 03:07 AM PDT The big picture: We are waiting for the start of the EURUSD trend. There is quite a bit of time before the trend develops until the summer lull in the market. The EUR/USD rate has formed a close consolidation. From the point of view of the foundation, important data will be released on Thursday and the report on US GDP for the 1st quarter on Friday. We are ready to buy euros from 1.1325. We are ready to sell the euro from 1.1180. |
| BITCOIN to retain bullish pressure? April 24, 2019 Posted: 24 Apr 2019 02:57 AM PDT Bitcoin sank impulsively lower after a jump above $5,500 with strong bullish non-volatile momentum recently. BTC is trading sideways after reaching a 6-month high. The price is expected to create further upward pressure in the coming days. BTC steady rally created a Cup and Handle bullish pattern on the daily chart. Bullish momentum in the coming days can be measured in technical Analysis. The overall trend is bullish, non-volatile, and impulsive that indicates steady bullish pressure in the near future. Despite the current dip below $5,500 on the intraday H1 chart, this price move is assumed as a correctional decline. This correction will be followed by a climb higher towards $6,000 price area in the coming days. The dynamic level of 20 EMA which was restraining Bitcoin for a certain period has been been broken. As long as the price remains below $5,500, BTC is going to trade with higher volatility, making corrections. SUPPORT: 5,000, 5,250 RESISTANCE: 5,500, 6,000 BIAS: BULLISH MOMENTUM: VOLATILE Intraday Perspective:
|
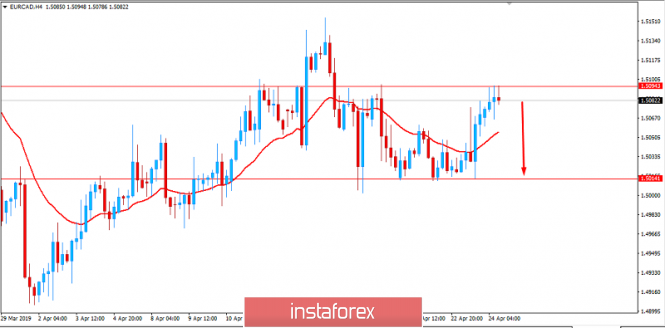
| Fundamental Analysis of EURCAD for April 24, 2019 Posted: 24 Apr 2019 02:49 AM PDT The EUR/CAD pair has been trading between 1.50 and 1.51 recently. It is likely to consolidate around this area. Meanwhile, the Canadian currency supported by today's BOC statement may regain momentum in the coming days. The loonie has been struggling to resist the single currency lately as the weak Employment reports affected the economy and discouraged the CAD buyers. The Bank of Canada is expected to hold policy steady for the rest of this year, with calls for the next hike in early 2020 resting on a knife's edge, a Reuters poll showed, the latest dulling of rate expectations for a major central bank. The Canadian economy has taken a hit from the mandatory production cut of oil – its biggest export – a slowdown in the housing market and wilting business sentiment over worries surrounding the US-China trade war. All economists polled said the BoC will hold rates at 1.75 percent at its meeting today and about 60 percent of them say they will stay there through to the end of this year. On the other hand, Europe is facing an economic slowdown as well as Brexit. Germany's ZEW economic sentiment survey, a key gauge of investor confidence, showed an increase last week. The reading had been in negative territory for the past 12 months and climbed into positive territory in April 2019. The Eurozone's ZEW indicator also improved to 4.5 from -2.5. It is also a positive sign. During the last meeting, the ECB mentioned that its focus would be to ensure the continued sustained conjunction of inflation close to 2% over the medium term. The leading indicator is important for traders and investors to measure market sentiment. The euro area's real Gross Domestic Product rose by 0.2% in the fourth quarter of 2018, following an increase of 0.1% in the Q3. Last Week, the Consumer Price Index remained unchanged of 1.4% along with the Core CPI at 0.8%. The French Flash Service PMI rose from 49.1 to 50.5, while the German Flash Manufacturing PMI came out at 44.5 undershooting the forecast of 45.2. The Spanish Unemployment rate is in the spotlight this week. It is anticipated to remain unchanged at 14.5%. As of the current scenario, CAD will have more chances to gain momentum over EUR if the upcoming economic reports and events turn out to be positive for the Canadian economy. Now, let us look at the technical view. The price is currently retreating from the 1.5100 resistance area with a strong bearish momentum which is expected to lead the price lower towards 1.50 support area in the coming days. Though the price has been quite volatile earlier, breaking below 1.50 will trigger strong bearish bias or even a long-lasting bearish trend. As far as the price remains below the 1.51 area with a daily close, the bearish bias is forecast to continue.
|
| EUR/USD, GBP/USD, USD/JPY. Simplified wave analysis and forecast for April 24 Posted: 24 Apr 2019 02:40 AM PDT EUR/USD The downward wave structure continues to form on the euro chart from March 20. The first 2 parts are formed in its structure. In the final part (C), an internal zigzag is formed. Forecast: Before the final breakthrough down the price, it is necessary to work out a counter rollback. The maximum calculated level of the rise is within the resistance zone. Recommendations: Given that the upcoming price growth goes against the trend direction of the main wave, euro purchases are risky. At the same time, a sharp increase in volatility cannot be ruled out. In transactions, it is worth reducing the lot and operating with the smallest TF. Completion of the rollback will be a good starting point for opening short positions. Resistance zones: - 1.1295 / 1.1325 Support zones: - 1.1220 / 1.1190 GBP/USD As seen on the chart of the pound, a complex bearish wave develops, which takes the place of correction in a larger wave formation. The final part is formed in the structure. The rollback phase yesterday was over. Forecast: Until the end of the week, the main vector of the price movement of the pound will be a downward move. On small TF quotes, the pair formed the first part of the upward rollback, the completion of which is worth waiting for in the upcoming sessions. Recommendations: The upcoming rate rise is expected to be no further than the upper level of the resistance zone. Price fluctuations today can create very good conditions for the opening of transactions for the sale of the instrument. The active phase of the decline is possible at the end of the day or tomorrow. Resistance zones: - 1.2950 / 1.2980 Support zones: - 1.2850 / 1.2820 USD/JPY As seen on the chart of the yen, a bullish wave is formed with very high movement potential from March 35. For analysis and trading, its last section, dated April 10, is of interest. In the structure of this wave, the first 2 parts (A + B) are fully completed. Forecast: Since yesterday, a distinct reversal pattern has been formed on the chart of the pair, preceding the start of intensive price growth. A downward pullback is formed, which can stretch over the entire current day. Reversal and the beginning of growth are more likely tomorrow. Recommendations: The pair's sales are irrelevant. In the area of settlement support, it is recommended to monitor the signals of instrument purchase generated on your vehicle. A sharp increase in volatility cannot be ruled out before a change of course. Resistance zones: - 112.90 / 113.20 - 112.00 / 112.30 Support zones: - 111.70 / 111.40 Explanations to the figures: Waves in the simplified wave analysis consist of 3 parts (A – B – C). The last unfinished wave is analyzed. Zones show areas with the highest probability of reversal. The arrows indicate the wave marking according to the method used by the author, the solid background is the formed structure, the dotted ones are the expected movements. Note: The wave algorithm does not take into account the duration of tool movements over time. The material has been provided by InstaForex Company - www.instaforex.com |
| You are subscribed to email updates from Forex analysis review. To stop receiving these emails, you may unsubscribe now. | Email delivery powered by Google |
| Google, 1600 Amphitheatre Parkway, Mountain View, CA 94043, United States | |


No comments:
Post a Comment