
Forex analysis review |
- April 26, 2019 : EUR/USD Intraday technical analysis and trade recommendations.
- April 26, 2019 : GBP/USD short-term bullish outlook is about to be confirmed.
- Bitcoin analysis for April 26, 2019
- Analysis of Gold for April 26, 2019
- USD/JPY analysis for April 26, 2019
- Results of the day for GBP / USD pair on April 26. Theresa May is actively negotiating with the Labor Party
- The US economy is surprisingly powerful and the dollar is ready for takeoff!
- EUR/USD. April 26th. Results of the day. US GDP in the first quarter of 2019 unexpectedly increased by 3.2%
- Technical analysis of GBP/USD for April 26, 2019
- GBP / USD plan for the American session on April 25. Pound sellers remain in the market
- EUR / USD plan for the European session on April 26. Traders are waiting for an important report on US GDP
- CAD/JPY to push higher after hawkish BOC statement: April 26, 2019
- Greenback is still strong but if you suddenly get tired of strengthening, you can go on a holiday
- The crisis is on the verge as global trade volumes have sunk significantly
- Selling EUR/USD and GBP/USD on growth: Eurocurrency has unenviable prospects
- Technical analysis of NZD/USD for April 26, 2019
- Trading Plan for EUR / USD pair on 04/26/2019
- Technical analysis of AUD/USD for April 26, 2019
- The dollar is preparing to withdraw against the euro and the yen
- Trading recommendations for the EURUSD currency pair - prospects for further movement
- Simplified wave analysis and forecast for EUR/JPY and Gold on April 26
- Trading recommendations for the GBPUSD currency pair - prospects for further movement
- Indicator analysis. Daily review on April 26, 2019 for the pair GBP / USD
- Review of EUR / USD and GBP / USD pairs on 04/26/2019: Not everything goes according to plan
- Indicator analysis. Daily review on April 26, 2019 for the pair EUR / USD
| April 26, 2019 : EUR/USD Intraday technical analysis and trade recommendations. Posted: 26 Apr 2019 07:50 AM PDT
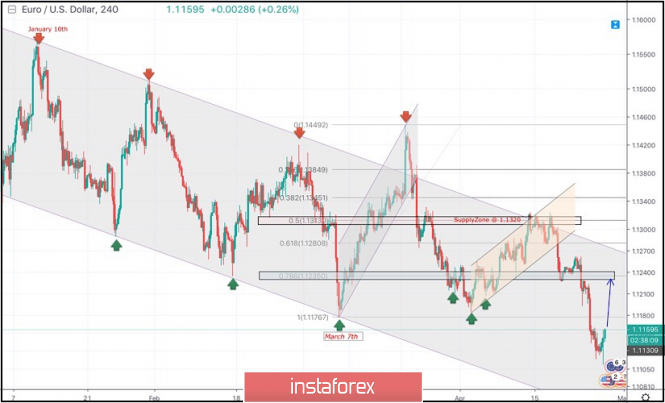
On January 10th, the market initiated the depicted bearish channel around 1.1570. Since then, the EURUSD pair has been moving within the depicted channel with slight bearish tendency. On March 7th, recent bearish movement was demonstrated towards 1.1175 (channel's lower limit) where significant bullish recovery was demonstrated. On March 18, a significant bullish attempt was executed above 1.1380 (the upper limit of the Highlighted-channel) demonstrating a false/temporary bullish breakout. On March 22, significant bearish pressure was demonstrated towards 1.1280 then 1.1220. Few weeks ago, a bullish Head and Shoulders reversal pattern was demonstrated around 1.1200. This enhanced further bullish advancement towards 1.1300-1.1315 (supply zone) where recent bearish rejection was being demonstrated. Short-term outlook turned to become bearish towards 1.1280 (61.8% Fibonacci) then 1.1235 (78.6% Fibonacci). For Intraday traders, the price zone around 1.1235 (78.6% Fibonacci) stood as a temporary demand area which paused the ongoing bearish momentum for a while before bearish breakdown could be executed few days ago. Conservative traders were advised to wait for a bullish pullback towards the newly-established supply zone around 1.1235 for a valid SELL entry. On the long-term, bearish persistence below 1.1235 enhances further bearish decline towards 1.1170 then 1.1115 if enough bearish momentum is expressed. The current price levels are quite risky for having new sell orders. That's why, conservative traders should be waiting for another bullish pullback towards 1.1230-1.1250 for a valid SELL entry. Trade recommendations : For those who had SELL entries around 1.1235 upon the recent bullish pullback, Remaining TP levels should remain located around 1.1115 and 1.1050. SL should lowered to 1.1170 to secure their profits. The material has been provided by InstaForex Company - www.instaforex.com |
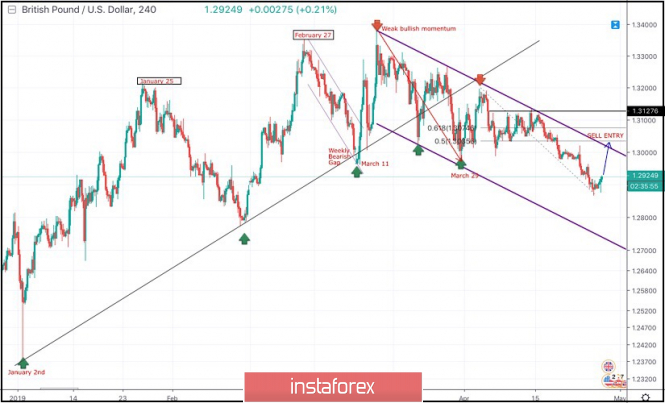
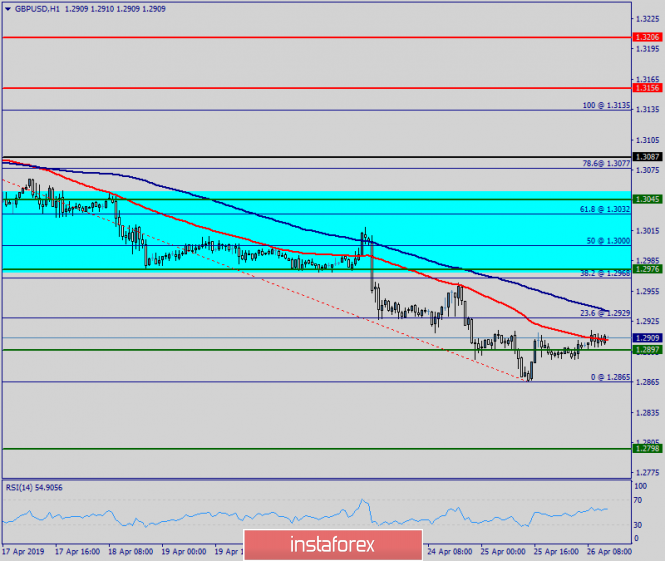
| April 26, 2019 : GBP/USD short-term bullish outlook is about to be confirmed. Posted: 26 Apr 2019 07:36 AM PDT On January 2nd, the market initiated the depicted uptrend line around 1.2380. On March 11, a weekly bearish gap pushed the pair below the uptrend line (almost reaching 1.2960) before the bullish breakout above short-term bearish channel was achieved. Shortly after, the GBPUSD pair demonstrated weak bullish momentum towards 1.3200 then 1.3360 where the GBPUSD failed to achieve a higher high above the previous top achieved on February 27. Instead, the depicted recent bearish channel was established. Significant bearish pressure was demonstrated towards 1.3150 - 1.3120 where the depicted uptrend line failed to provide any bullish support leading to obvious bearish breakdown. On March 29, the price levels of 1.2980 (the lower limit of the depicted movement channel) demonstrated significant bullish rejection. This brought the GBPUSD pair again towards the price zone of (1.3160-1.3180) where the upper limit of the depicted bearish channel as well as the backside of the depicted uptrend line demonstrated significant bearish rejection. Since then, Short-term outlook has turned into bearish with intermediate-term bearish targets projected towards 1.2900, 1.2800 and 1.2750 where the lower limit of the depicted channel comes again to meet the GBPUSD pair. Trade Recommendations: Conservative traders should be waiting for a bullish pullback towards 1.3035-1.3070 for a valid SELL entry. TP levels to be located around 1.2950, 1.2905 and 1.2800 and S/L to be located above 1.3100. The material has been provided by InstaForex Company - www.instaforex.com |
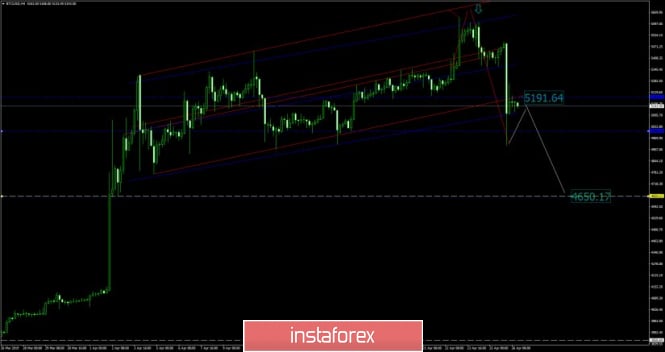
| Bitcoin analysis for April 26, 2019 Posted: 26 Apr 2019 07:25 AM PDT BTC did sold off from the key resistance line (upper diagonal of the channel). BTC did test the level of $4.920 and there is potential for more downside and potential test of $4.650.
Red lines -upward overbought channel White horizontal line – key support trendline BTC sold off strongly and it stopped at the lower diagonal of the channel at $5.100. Anyway, since the momentum is on the downside and that buying looks risky, we advise you to watch for potential selling opportunities if you see potential bearish flag in creation. Bearish flag would confirm downward continuation and potential test of $4.650. Resistance is seen at the price of $5.491 and $5.628. The material has been provided by InstaForex Company - www.instaforex.com |
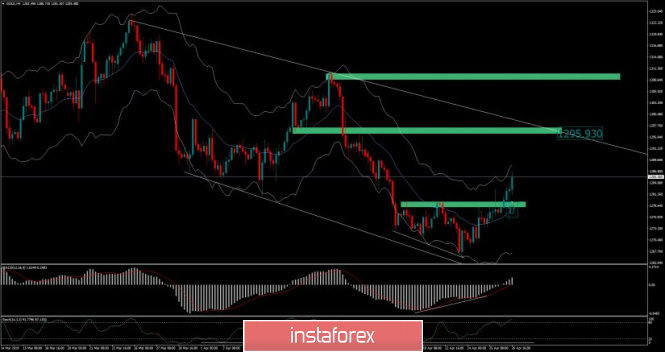
| Analysis of Gold for April 26, 2019 Posted: 26 Apr 2019 07:18 AM PDT Gold has been reacting from bullish divergence on loosing momentum on the downside. The momentum is strong on the upside and we are advising you to watch only for buying opportunities.
Green rectangle – Short-term resistance, which became key support Orange rectangle – Resistance based on price action Red rectangle – Resistance 2 based on price action Gold did rejection of the 20 EMA on the H4 time-frame on that way confirming the further short-term upside. Key resistance at $1.279 is broken and next resistance levels are seen at the price of $1.295 and $1.310. The Stochastic oscillator made new bullish wave and for now there are no signs of momentum drop on the upside. Watch for buying opportunities with the targets at $1.295 and $1.310. The material has been provided by InstaForex Company - www.instaforex.com |
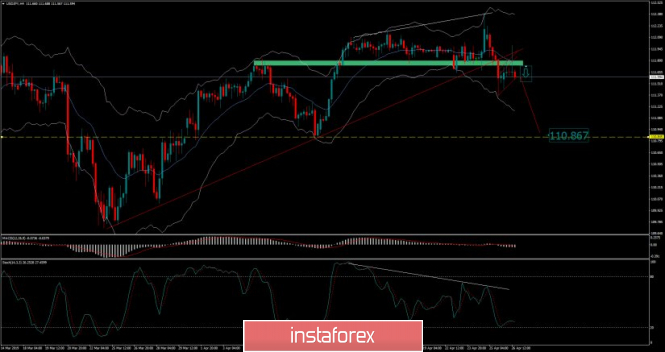
| USD/JPY analysis for April 26, 2019 Posted: 26 Apr 2019 06:58 AM PDT USDJPY has created fake breakout of the resistance 112.13 ins the background plus a bearish divergence, which are signs that buyers lost momentum and sellers started to distribute positions. We expect further downside.
Upward redline - major support trendline (broken) White line – bearish divergence Green rectangle – decision level support (broken) USD/JPY is trading lower on the wings of fake breakout of resistance and bearish divergence. Most recently, the resistance at the price of 111.80 held successfully and bearish flag got created. The medium line (EMA) of the Keltner channel is acting like resistance and the bearish flag got even more power for potential drop. Trading recommendation: We sold USDJPY from 111.58 with target at 110.87. Protective stop is placed at 111.95. The material has been provided by InstaForex Company - www.instaforex.com |
| Posted: 26 Apr 2019 06:42 AM PDT 4-hour timeframe The amplitude of the last 5 days (high-low): 29p - 23p - 91p - 76p - 51p. Average amplitude for the last 5 days: 54p (59p). On Friday, April 26, the British pound also began to adjust, yet at the same time, the volatility of the instrument dropped significantly. Thus, we can expect for a complete correction to the Kijun-Sen line. But even after its completion, it is rather inconvenient to retrain such a weak movement in spite of the downtrend. In the meantime, information appeared on what the UK government has been doing in recent days. It turns out that Theresa May and her team are in full swing in negotiations with the Labor Party. In principle, this is not news but since Brexit is delayed for 6 months, few people expected such zeal from the prime minister right now. On the other hand, there is nothing left for Theresa May. The European Union has already notified that it is not going to conduct any new negotiations on the "deal", it means that the only option to adopt the relevant law is to collect a sufficient number of votes in parliament at a vote on an agreement with the EU. Thus, we can already assume that we will see another vote on the very same "deal". Most likely, it will be taken this time since now, Theresa May will not bring it up for discussion until she is sure that it will get enough votes. There is also information that the prime minister wants to make a "deal" before the first meeting of the European Parliament of the new convocation. In general, if the "deal" is approved by the parliament, it can support the British pound. Moreover, he may even start to go up in the near future, as traders may again start buying a pound based on expectations of a positive completion of the three-year Brexit procedure. Trading recommendations: The GBP/USD currency pair has started an upward correction. Thus, sell orders remain relevant with targets of 1.2888 and 1.2846 but they should be opened only after the completion of the current correction. Longs in small lots are recommended to be considered after overcoming the line Kijun-sen with the first goal line of Senkou Span B. In addition to the technical picture, traders should also take into account the fundamental data and the time of their release. Explanation of the illustration: Ichimoku indicator: Tenkan-sen - the red line. Kijun-sen - the blue line. Senkou Span A - light brown dotted line. Senkou Span B - light purple dotted line. Chikou Span - green line. Bollinger Bands indicator: 3 yellow lines. MACD Indicator: Red line and histogram with white bars in the indicator window. The material has been provided by InstaForex Company - www.instaforex.com |
| The US economy is surprisingly powerful and the dollar is ready for takeoff! Posted: 26 Apr 2019 06:35 AM PDT Now the dollar will not hold anything! In the first quarter, US economic growth accelerated. The GDP grew by 3.2 percent year on year, as reported by the Ministry of Commerce. Growth was spurred by increased public investment, which offset a sharp slowdown in consumer and commercial spending. The report should allay concerns about the recession caused by weak economic data at the turn of the year. Economists had forecast GDP growth of 2 percent. In July, the US economy celebrated 10 years of continuous growth. However, the Fed is likely to ignore the jump and focus on reducing domestic demand, which grew by only 1.3 percent. This has been the slowest rate since the second quarter of 2013, after rising 2.6 percent in the fourth quarter. Apparently, the Fed will not change its solution to stop a three-year-old campaign on the stiffening of money and credit policy. Exports rose and imports declined, which resulted in a small balance deficit. Trade tensions between the United States and China led to sharp fluctuations in the trade deficit, while exporters and importers are trying to act proactively in the context of the tariff war between the two economic giants. Consumer spending, which accounts for more than two-thirds of US economic activity, has slowed. Moderation in spending reflected a reduction in purchases of cars and other goods, which is probably due to the government's 35-day halt. Business expenses fell sharply with an increase of only 0.2 percent, which was the lowest since the third quarter of 2016. Expenses were constrained by low costs for agricultural machinery and office furniture. The material has been provided by InstaForex Company - www.instaforex.com |
| Posted: 26 Apr 2019 06:29 AM PDT 4-hour timeframe The amplitude of the last 5 days (high-low): 19p - 27p - 69p - 84p - 45p. Average amplitude over the last 5 days: 45p (55p). As we expected in the morning review, the EUR/USD currency pair began to adjust at trading on Friday, April 26. So far, the correction is very weak, and after the release of the report on GDP, the US dollar rushed down but very soon returned to its original positions. Thus, if the whole reaction of the market is not a published report, then we once again draw the attention of traders that the fundamental events now do not have a proper impact on the movement of the currency pair. Thus, the technical factors are now more important, which means that after the completion of the current round of correction, we can expect a resumption of the downward trend. Most likely, it will happen next week. Monday, as is often happens, can be quite boring, although several reports on this day will be published both in the European Union and in the States. The target for the corrective movement now is the critical line Kijun-Sen. And we recommend determining the completion of the correction by turning the MACD indicator down. No new news on the trade war between the US and the EU has been received in recent days. Thus, in general, the fundamental background is even absent, if we do not take into account macroeconomic reports, which this week was just a couple of pieces. The pair ends the week and the month with the important overcoming of the level of 1.1200, which opens the way down. The worst thing for the euro is that now it is even difficult to assume that it can support it in the medium or long term. Trading recommendations: The EUR/USD pair has begun to adjust, as indicated by the MACD indicator. Thus, sales orders with targets at 1.1107 and 1.1091 remain relevant, but these and other targets will be given the opportunity sooner next week. It is recommended to consider buy orders in small lots for the purpose of the Senkou Span B line not earlier than fixing the price above the critical line. In this case, the initiative will go into the hands of bulls for some time. In addition to the technical picture should also take into account the fundamental data and the time of their release. Explanation of the illustration: Ichimoku indicator: Tenkan-sen - the red line. Kijun-sen - the blue line. Senkou Span A - light brown dotted line. Senkou Span B - light purple dotted line. Chinkou Span - green line. Bollinger Bands indicator: 3 yellow lines. MACD Indicator: Redline and histogram with white bars in the indicator window. The material has been provided by InstaForex Company - www.instaforex.com |
| Technical analysis of GBP/USD for April 26, 2019 Posted: 26 Apr 2019 06:22 AM PDT |
| GBP / USD plan for the American session on April 25. Pound sellers remain in the market Posted: 26 Apr 2019 05:58 AM PDT To open long positions on the GBP / USD pair, you need: Pound buyers cannot find a good level of support from which an upward correction could be built. At the moment, the task of the bulls is to breakdown and consolidate above the resistance of 1.2900, which will lead to an increase in the pound to the area of resistance at 1.2929, where I recommend taking profits. In case the price further reduces, it is best to consider a long position after the formation of a false breakdown in the region of 1.2867 or rebound from a larger minimum of 1.2812. To open short positions on the GBP / USD pair, you need: Bears will try to prevent the growth of the pound above the resistance of 1.2899 and the formation of a false breakdown after correction in the second half of the day, which will lead to another reduction of the GBP/USD pair to the low of 1.2867. The main task of the pound sellers is to fix below this range with the update of the level of 1.2812, where I recommend fixing the profit. In case that the growth is above the resistance of 1.2899, you can sell the pound on a rebound from the maximum of 1.2929. Moving averages Trade is conducted below 30 and 50 moving averages, which indicates the preservation of the bearish nature of the market. Bollinger bands In the case of growth, the upper limit of the Bollinger Bands indicator around 1.2924 will act as resistance from which you can sell a pound for a rebound. Description of indicators MA (moving average) 50 days - yellow MA (moving average) 30 days - green MACD: fast EMA 12, slow EMA 26, SMA 9 Bollinger Bands 20 The material has been provided by InstaForex Company - www.instaforex.com |
| Posted: 26 Apr 2019 05:48 AM PDT To open long positions on EUR / USD pair, you need: The euro buyers returned to the market as expected after the support level of 1.1122 was updated, which I paid attention to in my morning forecast. At the moment, the main task of the bulls will be a breakthrough and consolidation above the resistance of 1.1150, which was formed in the first half of the day. Only after that, you can count on a larger upward correction with a test of the upper limit, perhaps at the new side channel of 1.1177, where I recommend fixing profits. When the euro drops to the area of 1.1122, it is best for long positions to return on a rebound from 1.1079. To open short positions on EUR / USD pair, you need: Bears coped with the morning task and got to the support of 1.1122. At the moment, an unsuccessful attempt to consolidate at 1.1150 will be a new signal to open short positions in order to re-update the minimum of 1.1122 and break through to it, which will lead the euro major pair to the support area of 1.1079, where I recommend taking profits. With the growth of EUR/USD above 1.1150 resistance, it is possible to open short positions on a rebound from the maximum of 1.1177, which can act as the upper limit of the new side channel. Indicator signals: Moving averages Trading is below 30 and 50 moving averages, which indicates the bearish nature of the market. Bollinger bands In case of growth, the upper border of the Bollinger Bands indicator in the 1.1170 area will act as resistance, from which you can sell the euro for a rebound. Description of indicators MA (moving average) 50 days - yellow MA (moving average) 30 days - green MACD: fast EMA 12, slow EMA 26, SMA 9 Bollinger Bands 20 The material has been provided by InstaForex Company - www.instaforex.com |
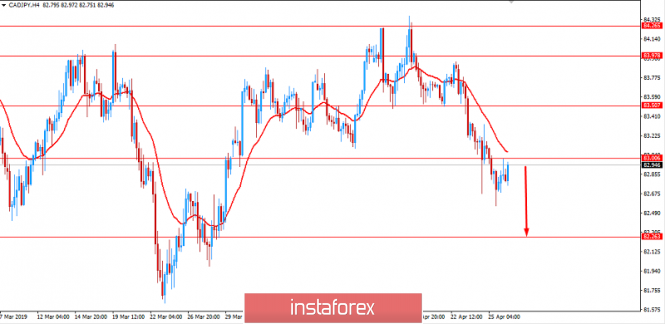
| CAD/JPY to push higher after hawkish BOC statement: April 26, 2019 Posted: 26 Apr 2019 05:43 AM PDT JPY has been stronger against CAD since the bounce off 84.50 level which pushed the price lower by more than 100 pips. However, the Canadian currency managed to offset losses as the Bank of Canada provided an optimistic outlook for the upcoming development. The loonie is expected to maintain gains in the coming days. The Bank of Canada has raised the interest rate five times since July 2017, although it kept the dovish stance on the back of the global trade concerns, slumping oil sector and a weaker housing sector. These factors dented the Canadian economic growth. According to BOC Governor Stephen Poloz, the economic slowdown caused by external effects is expected to be temporary and the worst-case scenario has already become invalid. Now its time to proceed forward, he said. According to the Bank of Canada's estimates, the neutral range for the interest rate is between 2.25 and 3.25 percent. The overnight interest rate is currently at 1.75 percent. During this week's monetary policy meeting, the BOC decided to keep the interest rate unchanged at 1.75%. The corresponding statement was dovish. The BOC outlined that the global economic growth slowed more than anticipated. The bank expected the growth to pick up from the second quarter of 2019 while the housing activity and employment income were expected to be stabilized. The bank's forecast of the real GDP growth is 1.2% in 2019 and around 2% in 2020 and 2021. The core inflation expectations are just close to 2% are likely to be unchanged. According to the BOC, the labor market seems to be healthy amid wage increases. On the JPY side, the BOJ intends to maintain the current extremely low levels of short- and long-term interest rates for an extended period of time. The bank decided to keep the interest rate unchanged and planned to purchase the Japanese government bonds (JGBs) in order to ensure that 10-year JGB yields remain at around 0%. The BOJ once again projected a moderate economic expansion with weaker exports due to global economic slowdown. The labor market is expected to be stronger while the inflation rate is likely to remain unchanged in the long run. The ultimate target for CPI is seen at 2%. The Core Consumer Price Index was published last week. It showed a better than expected result of 0.8%. Furthermore, the revised industrial production dropped from 1.4% to 0.7% while the All Industry Activity index dropped to -0.6%. At the same time, the unemployment rate missed the expectation this week while the retail sales increased to 1.0%. On the positive side, the trade balance came in at -0.18T, whereas the forecast was -30T. However, the last month's reading was revised lower to 0.03T. The mixed data from Japan is making the market volatile and corrective. As of the current scenario, JPY is expected to lose momentum against CAD, but any positive economic reports from Japan can lead to certain volatility and indecision in the process. Now let us look at the technical view. After a break below 83.00 area with a daily close, the price is currently quite corrective and volatile. The pair is set to retest the resistance at 83.00 before progressing lower with the target at 82.00 and 80.00 which is the support area. As the price remains below 85.00 area with a daily close, the bearish bias is expected to continue further.
|
| Greenback is still strong but if you suddenly get tired of strengthening, you can go on a holiday Posted: 26 Apr 2019 05:00 AM PDT In recent days, a strong US dollar has set the tone for the foreign exchange market. The USD index reached its maximum this week for the first time in 23 months. According to experts, the growth of the US currency against its main competitors in the G10 was made possible, thanks to a significant change in investor sentiment. Until recently, market participants were confident that the US economy would seriously slow down due to bad weather, as well as 35-day "shutdown" and an increase in borrowing costs. Hopes for an early end to trade conflicts and the restoration of China's GDP, it would seem that interest in risky assets returned but the disappointing statistics on the eurozone and the rest of the world forced investors to turn their eyes back to the "American". It was because of the deterioration of the economic indicators of the eurozone that the Credit Agricole Bank was forced to abandon its forecast for the strengthening of the euro to $1.24 in the long term. At the beginning of the year, we sincerely believed that further progress in the trade negotiations between Washington and Beijing would help restore investors' appetite for risky assets while weakening the position of the greenback would reduce the attractiveness of this currency for investment. Even though the Fed's interest rate expectations have changed towards its decline and the risk attitude improved, the slowdown in the euro zone's economic growth and the ECB's softening position on monetary policy played against the euro", Credit Agricole representatives said. The bank gave the recommendation to open a position to buy the single European currency on January 11, when it was trading at $1.1525. Since then, the euro fell by more than 3%. On the eve of the EUR / USD pair, it fell to an almost 2-year low. The series of positive stats continues for the United States is supporting the dollar. As it became known yesterday, the volume of orders for durable goods in the US expanded by 2.7% in March against a decline of 1.1% a month earlier and a forecast of increased by 0.7%. Today, there will be a preliminary assessment of the US GDP for the first quarter. It is assumed that if the figure exceeds 2%, then we should expect further strengthening of the greenback and the fall of the EUR/USD pair to the support level of 1.1115. Otherwise, you need to wait for the pair to rebound and the beginning of the upward correction, whose immediate goal will be the resistance level of 1.1190. In addition, it is possible that more or less decent US GDP growth is already priced in, which is why the "buy on rumor, sell on facts" strategy may work, especially since players will want to take profits before the weekend. The material has been provided by InstaForex Company - www.instaforex.com |
| The crisis is on the verge as global trade volumes have sunk significantly Posted: 26 Apr 2019 04:28 AM PDT According to Bloomberg, world trade is declining at a rapid pace over the past 11 years since the 2008 financial crisis. The slowdown of the global economy is getting more and more evident, experts say. Between December 2018 and February 2019, the decline in world trade was almost 2%. The last time such a sharp peak of the experts recorded was in May 2009. According to analysts, what happened was affected by trade conflicts that the US unleashed around the world in 2018, as well as a fall in demand amid a general economic slowdown. Currently, Europe is on the verge of recession despite all of the incentives of the ECB. At the same time, the German economy, the leader of the European region is also experiencing significant fluctuations. According to experts, the recent rally in stock markets, including emerging markets, only confirms the fact that the financial segment operates in isolation from the real economy. The low stock market activity allows market makers to manipulate indices at their discretion. Experts believe that the actions of the Central Bank can positively affect the situation but now the regulator has a lull. The super-soft policy of world regulators has led to the growth of the debt "bubble", which has reached a large scale, they added. In this regard, any tightening of monetary policy will provoke an explosion and the consequences of which will be very difficult to eliminate. The material has been provided by InstaForex Company - www.instaforex.com |
| Selling EUR/USD and GBP/USD on growth: Eurocurrency has unenviable prospects Posted: 26 Apr 2019 04:08 AM PDT The future of the single European currency remains extremely uncertain. Slowing economic growth in the eurozone against the background of general uncertainty, which has not disappeared anywhere from the markets but only increases more and more. It may cause the ECB to resume asset buying under the name of quantitative easing (QE). On Thursday, ECB Vice President Luis de Gindos at a Reuters Breakingviews event in New York said that "we closed our quantitative easing program at the end of last year, but ... this is something that we can use again if necessary." His words indicate that the regulator is stymied by the lack of inflation, (currently at the level of 1.4%) and weak GDP growth, which fell to 1.1% on an annualized basis, according to final data for the fourth quarter. In fact, we can say that the ECB will have to resort to either direct purchases of government bonds, as well as corporate bonds in an attempt to stimulate an increase in inflationary pressure and economic growth in the region. In our opinion, it will be extremely difficult for the bank to solve this problem, since in recent months the risks of dumping the global economy into recession with subsequent crisis phenomena have noticeably increased and without external demand for European products on the world market, it will be extremely difficult for the eurozone economy to recover. Given this, we believe that the euro currency will have an "unenviable" future. Most likely, it will continue to remain under pressure, adjusting the US dollar upwards from time to time. It is likely that in the future the main currency pair will test the level of 1.0000, as in the conditions of the impending new economic crisis. The demand for dollar assets and the American currency itself will only grow as an asset. Forecast of the day: The EUR/USD pair remains under pressure in the wake of the risk that the ECB will resume the euro-zone economic stimulus programs and the pair may rebound to 1.1165. If this happens, we consider it possible to sell it from this mark, as well as from the level of 1.1145, if it does not cross it with the local target of 1.1100. The GBP/USD pair can also be adjusted upwards to 1.2925. We consider it necessary to sell it from this mark or after crossing the level of 1.2880 with the local target of 1.12800. |
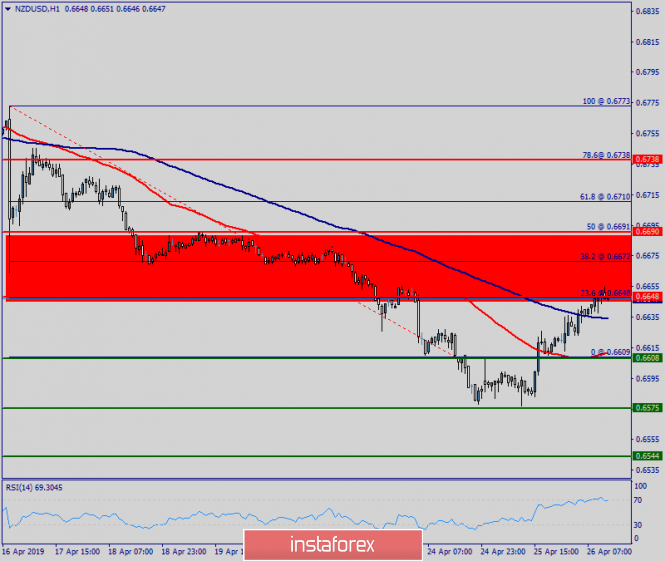
| Technical analysis of NZD/USD for April 26, 2019 Posted: 26 Apr 2019 03:32 AM PDT The NZD/USD pair is showing signs of weakness following a breakout of the lowest level of 0.6648. On the H1 chart. the level of 0.6648 coincides with 23.6% of Fibonacci, which is expected to act as minor support today. Since the trend is below the 23.6% Fibonacci level, the market is still in a downtrend. But, major resistance is seen at the level of 0.6690. Furthermore, the trend is still showing strength above the moving average (100). Thus, the market is indicating a bearish opportunity below the above-mentioned support levels, for that the bearish outlook remains the same as long as the 100 EMA is headed to the downside. Therefore, strong resistance will be found at the level of 0.6690 providing a clear signal to buy with a target seen at 0.6575. If the trend breaks the minor resistance at 0.6575, the pair will move downwards continuing the bearish trend development to the level 0.6544. The material has been provided by InstaForex Company - www.instaforex.com |
| Trading Plan for EUR / USD pair on 04/26/2019 Posted: 26 Apr 2019 03:28 AM PDT The big picture: There is a downtrend signal for the EUR/USD pair. Orders for durable goods in the USA came out unexpectedly strong at +2.7%. This caused a new drop in the euro against the dollar. Technically, the euro is ready for a big fall after a six-month treading in the range of 1.1200-1.1500 up to 1.0600 and even lower. The zero rate policy of the ECB adds pessimism against the euro. We keep selling from 1.1223. The first reading of US GDP for Q1 will be released on Friday at 13:30 London time (GMT+1). In case of strong data, the euro will continue to fall. |
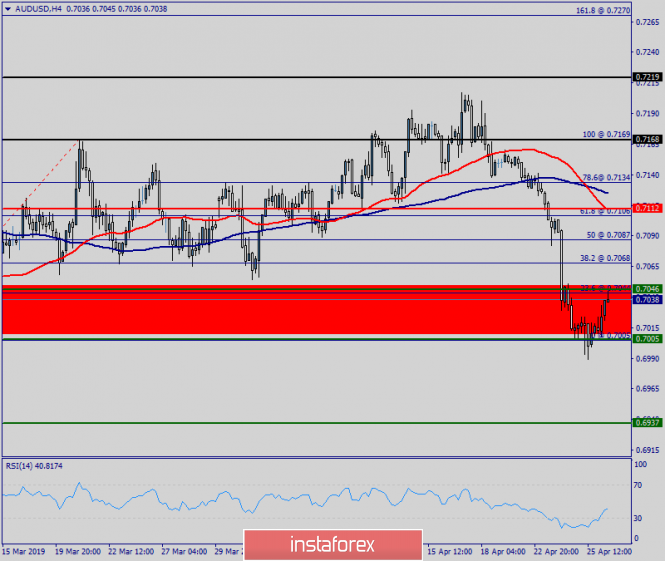
| Technical analysis of AUD/USD for April 26, 2019 Posted: 26 Apr 2019 03:23 AM PDT |
| The dollar is preparing to withdraw against the euro and the yen Posted: 26 Apr 2019 03:13 AM PDT
The euro is marking time near 22-month lows, as traders are not yet showing any particular activity. Markets are waiting for data on US GDP, which should confirm the strength of the leading global economy and push the dollar even higher. In general, the currency markets are calm, most of the major pairs are stuck in narrow trading ranges. However, it seems like a calm before the storm. New orders for the production of capital goods in the US in March rose to a maximum of 8 months. These and other recent data eased concerns about a sharp slowdown in the growth of the world's largest economy. It is expected that US GDP in the first quarter grew by 2 percent year on year. This week's breakout in the EUR/USD pair below $ 1.1200 was largely a dollar history. However, over the next few days, attention may again shift to Europe, where elections are expected in Spain, the credit issues of Italy and possible economic reforms in France. The Bank of Japan has told investors that it will keep interest rates at an ultra-low level for at least another year in order to remove any doubts about its commitment to the ultra-light policy. The yen has not changed much against the dollar, but the situation will change soon. Next week, the data on the Chinese index of business activity and the report on employment in the non-agricultural sector of the United States will be published, it is expected that both indicators will be quite good. This can be added to the next round of trade negotiations between the US and China, which can further raise the risk sentiment. Thus, the market is likely to expect another growth of the dollar against the yen to 113.00 yen. |
| Trading recommendations for the EURUSD currency pair - prospects for further movement Posted: 26 Apr 2019 02:46 AM PDT For the last trading day, the euro / dollar currency pair showed volatility below the average daily 44 points, but this did not stop the bears to keep the leadership in the market. From the point of view of technical analysis, we see a rapid decline during the entire trading week, where the quotation almost without difficulty overcame a number of important levels that kept the quotation. It is theoretically possible to continue the descending move, but so far only overheating of short positions is visible, where there is already stagnation. The information background did not have any harsh statements, but the news flow contained data on the volume of orders for durable goods (mar m / m) in the USA, where they expected a growth of 0.7%, but as a result received more rapid jump of 2.7%. Today, in terms of the economic calendar, we have data on US GDP for Q1, where a slowdown is expected from 2.2% to 2.0%, which could put pressure on the dollar. The upcoming trading week in terms of the economic calendar is replete with statistics and events. The most current data is displayed below. Tuesday EU 12:00 MSK - GDP (y / y): Prev. 1.1% EU 12:00 MSK - Unemployment (mar): Prev. 7.8% ---> Forecast 7.8% United States 17:00 MSK - Index of pending sales in the real estate market (m / m) (Mar): Prev. -1.0% ---> Forecast 1.0% Wednesday United States 15:15 MSK - Change in the number of people employed in the non-farm sector from ADP (Apr): Prev. 129K ---> Forecast 175K United States 17:00 MSK - Manufacturing Business Index (PMI) from ISM (Apr): Prev. 55.3 ---> Forecast 55.0 United States 21:30 MSK - FOMC Press Conference Thursday EU 11:00 MSK - Manufacturing Business Index (PMI) (Apr): Prev. 47.8 ---> Forecast 47.8 United States 15:30 MSK - Basic orders for durable goods (m / m) (Mar): Prev. -0.1% ---> Forecast 0.2% Friday EU 12:00 MSK - Consumer Price Index ( CPI) (y / y) (Apr): Prev. 1.4% ---> Forecast 1.5% United States 15:30 MSK - Change in the number of people employed in the non-agricultural sector (Apr): 196K ---> Forecast 180K United States 15:30 MSK - Unemployment rate (Apr): Prev. 3.8% ---> Forecast 3.8% United States 17:00 MSK - Non-manufacturing Business PMI (PMI) from ISM (Apr): 56.1 ---> Forecast 57.2 These are preliminary and subject to change. Further development Analyzing the current trading chart, we see that the quote felt a certain point of support in the face of the value of 1.1120, where, together with oversoldness, a stagnation of two-digit doji-type candles formed. It is likely to assume that, against the background of oversold and US statistics coming out today, we can see a long-awaited pullback towards the previously passed level of 1.1180. In any case, traders carefully analyze the current foothold, in case the bearish interest does not subside and we see just a pullback with stagnation. Indicator Analysis Analyzing a different sector of timeframes (TF ), we see that in the short term, a rising interest has arisen against the background of stagnation with a rollback. Intraday and mid-term perspectives also maintain a downward interest against the general background of the market. Weekly volatility / Measurement of volatility: Month; Quarter; Year Measurement of volatility reflects the average daily fluctuation, based on monthly / quarterly / year. (April 26 was based on the time of publication of the article) The current time volatility is 23 points. In case of support from the continuation of the news background, volatility may increase. Key levels Zones of resistance: 1.1180; 1,1300 **; 1.1440; 1.1550; 1.1650 *; 1.1720 **; 1.1850 **; 1.2100 Support areas: 1.1080 *; 1.1000 ***; 1,0850 ** * Periodic level ** Range Level The material has been provided by InstaForex Company - www.instaforex.com |
| Simplified wave analysis and forecast for EUR/JPY and Gold on April 26 Posted: 26 Apr 2019 02:31 AM PDT Simplified wave analysis and forecast for EUR/JPY and Gold on April 26 EUR/JPY The dominant trend direction of the cross since the beginning of the year is directed upwards. The last short-term wave counts from March 22, forming the beginning of the final part (C) of the main wave. In this model, from April 12, the price forms a corrective part (B). Large-scale support has been achieved. Forecast On the M15/M30 chart, the beginning of the hidden correction was formed, which lacks the final rise. Today there is a high probability of the general flat mood of the movement. The current price rise is expected no further than the calculated resistance. Recommendations There are no signals of the fast change in the day trend, so buying a pair is quite risky and can be used when trading only during trading sessions. For longer trades at the end of the current correction, it is necessary to track the sell signals of the instrument. Resistance zones: - 124.80 / 125.10 Support zones: - 123.80 / 123.50 Gold The direction of the price trend in recent weeks was set by the downward wave of March 35, which in the larger bearish wave became the final part (C). The price is within the boundaries of a strong support zone for the senior TF. Forecast: The price rise, which began on April 23, has a small reversal potential, which may grow after the upcoming pullback. The reversal and change of the price movement vector are likely in the next day. Recommendations: In the area of settlement support, trading in the style of "intraday" should start tracking the signals of the sale. Supporters of a longer trade are recommended to refrain from entering the market until the confirmation of the change in the direction of the international trend.Resistance zones: - 1285.0 / 1290.0 Support zones: - 1270 / 1265.0 Explanations for the figures: Waves in the simplified wave analysis consist of 3 parts (A – B – C). The last unfinished wave is analyzed. Zones show areas with the highest probability of reversal. The arrows indicate the wave marking according to the method used by the author, the solid background is the formed structure, the dotted ones are the expected movements. Attention: Wave algorithm does not take into account the duration of tool movements over time. The material has been provided by InstaForex Company - www.instaforex.com |
| Trading recommendations for the GBPUSD currency pair - prospects for further movement Posted: 26 Apr 2019 02:06 AM PDT For the last trading day, the pound / dollar currency pair again showed a low volatility of 50 points, as a result of having stagnation. From the point of view of technical analysis, we see that after the inertial move, the quotation found a periodic pivot of 1.2865, where, against the background of general overheating of short positions, it formed a stagnation with an estimated correction. The information background, in principle, did not have any harsh statements regarding the UK & EU divorce process. The only thing that took off was the statement made by French President Emmanuel Macron on the subject of disagreement between the countries of France and Germany on Brexit, but it had no effect on the general market background. "We do not have absolute agreement on the issue of UK exit from the EU. At some point, it will need to be found, " explained Macron. The news background had data on the volume of orders for durable goods (mar m / m) in the United States, where it was expected to grow 0.7%. However, as a result, it received a more rapid jump by 2.7%. Today, in terms of the economic calendar, we have data on US GDP for Q1, where a slowdown is expected from 2.2% to 2.0%, which could put pressure on the dollar. The upcoming trading week in terms of the economic calendar is replete with statistics and events, where we will see the meeting of the Bank of England and the Fed. The most current events are displayed below. Monday 17:00 MSK - Speech by the head of the Bank of England Carney Tuesday United States 17:00 MSK (Mar): Prev. Index of pending sales in the real estate market (m / m) (Mar) -1.0% ---> Forecast 1.0% Wednesday United Kingdom 11:30 Moscow time. - Manufacturing Business Index (PMI) (Apr): Prev. 55.1 United States 15:15 MSK - Change in the number of people employed in the non-farm sector from ADP (Apr): Prev. 129K ---> Forecast 175K United States 17:00 MSK - Manufacturing Business Index (PMI) from ISM (Apr): Prev. 55.3 ---> Forecast 55.0 United States 21:30 MSK - FOMC Press Conference Thursday United Kingdom 11:30 Moscow time. - Index of Business Activity in the construction sector (Apr) 49.7 ---> Forecast 49.8 14:30 Moscow time - Bank of England meeting followed by Kearney England performance United States 15:30 MSK - Basic orders for durable goods (m / m) (Mar): Prev. -0.1% ---> Forecast 0.2% Friday United Kingdom 11:30 Moscow time. - Index of business activity in the services sector (Apr): 48.9 ---> Forecast 50.9 United States 15:30 MSK - Change in the number of people employed in the non-agricultural sector (Apr): 196K ---> Forecast 180K United States 15:30 MSK - Unemployment rate (Apr): Prev. 3.8% ---> Forecast 3.8% United States 17:00 MSK - Non-manufacturing Business PMI (PMI) from ISM (Apr): 56.1 ---> Forecast 57.2 These are preliminary and subject to change. Further development Analyzing the current trading chart, we see a correction attempt, but so far we only have a small pullback with the border of 1.2915. It is likely to assume that the pair, after all, is overheated by short positions, and a pullback followed by a correction is a rather realistic scenario. Traders consider such a campaign, if the price is fixed above 1.2920, then the move to 1.2935-1.2960 is possible. At the same time, traders carefully analyze the recent pivot point, in case the bearish interest persists and we head to the main pivot point 1.2770. Indicator Analysis Analyzing a different sector of timeframes (TF ), we see that in the short term, a rising interest was born against the background of a rollback. Intraday and mid-term perspective preserves downward interest against the general background of the market. Weekly volatility / Measurement of volatility: Month; Quarter; Year Measurement of volatility reflects the average daily rate. (April 26 was based on the time of publication of the article) The current time volatility is 28 points. If supported by the continuation of the news background, volatility may increase. Key levels Zones of resistance: 1.2920 * 1.3000 **; 1.3220 *; 1,3300 **; 1.3440; 1.3580 *; 1.3700 Support areas: 1.2770 (1.2720 / 1.2770) **; 1.2620; 1,2500 *; 1.2350 **. * Periodic level ** Range Level The material has been provided by InstaForex Company - www.instaforex.com |
| Indicator analysis. Daily review on April 26, 2019 for the pair GBP / USD Posted: 26 Apr 2019 01:51 AM PDT On Friday, technical analysis gives an upward movement. The first upper target of 1.2942 is the rolling level of 14.6% (yellow dotted line).
Fig. 1 (daily schedule). Comprehensive analysis: - indicator analysis - up; - Fibonacci levels - up; - volumes - up; - candlestick analysis - up; - trend analysis - down; - Bollinger lines - up; - weekly schedule - down. General conclusion: On Friday, technical analysis gives an upward movement. The first upper target of 1.2942 is the rolling level of 14.6% (yellow dotted line). The material has been provided by InstaForex Company - www.instaforex.com |
| Review of EUR / USD and GBP / USD pairs on 04/26/2019: Not everything goes according to plan Posted: 26 Apr 2019 01:49 AM PDT The dollar not only suggests itself a correction but still climbs into the eyes. However, with each new day, it is deposited in an increasingly distant box and reinforces the already excessive overbought of the dollar. Although yesterday, unlike the previous days, the growth of the dollar was quite justified because despite the increase in the number of applications for unemployment benefits. Their number increased by 34 thousand due to an increase in the number of initial applications by 33 thousand and repeated per 1 thousand. The volume of orders for durable goods increased by 2.7% and this is almost three and a half times more than predicted. Hence, the further weakening of the single European currency is quite understandable. Yet, the fact that the pound almost stood still and the partners of Theresa May for the Conservative Party are guilty, whose demands to the "Iron Lady 2.0" stumped all those who were not involved. Few people understand how to get out of such a situation at all since their desire is to see a plan of action for the Prime Minister's resignation, which naturally is an indication of the exact date of such a significant event. After all, in essence, this means that Theresa May is extremely difficult to negotiate with Jeremy Corbin on the Brexit issue. She is in limbo and so with this ill-fated Brexit. It's completely incomprehensible to everyone. Nevertheless, today we can see the long-awaited correction for the dollar. The trigger should be preliminary data on the United States GDP for the first quarter, which may show a slowdown in economic growth. Indeed, the US economy did not accelerate weakly and it showed an increase of as much as 3.0% at the end of last year. This is very much for the United States and everyone understands that this growth cannot last forever. Moreover, there are many signs of a clear deterioration in the economic situation, especially if you closely monitor stocks that have been growing for more than a year. These are clear signs of the growing crisis of overproduction and in an amicable way, the American economy needs to cool slightly to reduce tensions. Hence, the single European currency has good chances to grow to 1.1200. The political battles between Theresa May and of course, the conservatives are extremely exciting but the real state of the economy of the United States is somewhat more important than the next series of the popular television series. Thus, the pound will rise following the euro with the benchmark of 1.2950. |
| Indicator analysis. Daily review on April 26, 2019 for the pair EUR / USD Posted: 26 Apr 2019 01:43 AM PDT On Friday, the bears will begin to record weekly earnings, and the market will roll back up. The first upper target is 1.11467 - the rolling level of 23.6% (yellow dotted line).
Fig. 1 (daily schedule). Comprehensive analysis: - indicator analysis - up; - Fibonacci levels - up; - volumes - up; - candlestick analysis - up - trend analysis - down; - Bollinger lines - up; - weekly schedule - down. General conclusion: On Friday, the bears will begin to record weekly earnings, and the market will roll back up. The first upper target is 1.11467 - the rolling level of 23.6% (yellow dotted line). The material has been provided by InstaForex Company - www.instaforex.com |


| You are subscribed to email updates from Forex analysis review. To stop receiving these emails, you may unsubscribe now. | Email delivery powered by Google |
| Google, 1600 Amphitheatre Parkway, Mountain View, CA 94043, United States | |
No comments:
Post a Comment