
Forex analysis review |
- Nikkei approaching resistance, potential drop!
- XAU/USD approaching support, potential bounce!
- NZD/USD approaching support, potential bounce!
- Fractal analysis of major currency pairs on April 4
- EUR/USD: China and the United States on the verge of a deal, Britain asks to delay Brexit
- The critical moment for Brexit - now!
- The players believed in the euro, but the signal was "bearish"
- April 3, 2019 : EUR/USD Intraday technical analysis and trade recommendations.
- Elliott wave analysis of GBP/JPY for April 3, 2019
- Elliott wave analysis of EUR/JPY for April 3, 2019
- Bitcoin analysis for April 03, 2019
- Sunny day for the dollar seems to be nearing sunset
- GBP/USD analysis for April 03, 2019
- USD/JPY analysis for April 03, 2019
- EURUSD: the euro strengthened against the background of good data on PMI in the service sector and retail sales, but further
- The growth of oil can only cancel force majeure
- GBP / USD: plan for the American session on April 3. Weak activity in the service sector has limited the upward potential
- April 3, 2019 : GBP/USD Intraday technical analysis and trade recommendations.
- Gold does not believe Central banks
- Technical analysis of USD/CHF for April 03, 2019
- Technical analysis of NZD/USD for April 03, 2019
- Brexit and EUR: Theresa May expects a new postponement for Brexit, and the euro is trying to form an upward correction
- GBP/USD. April 3. The trading system. "Regression Channels". The European Union proposes to postpone Brexit to 2020
- EUR/USD. April 3. The trading system. "Regression Channels". Macroeconomic statistics from the United States continues to
- Analysis of EUR/USD divergence for April 3. The euro turned around the previous low
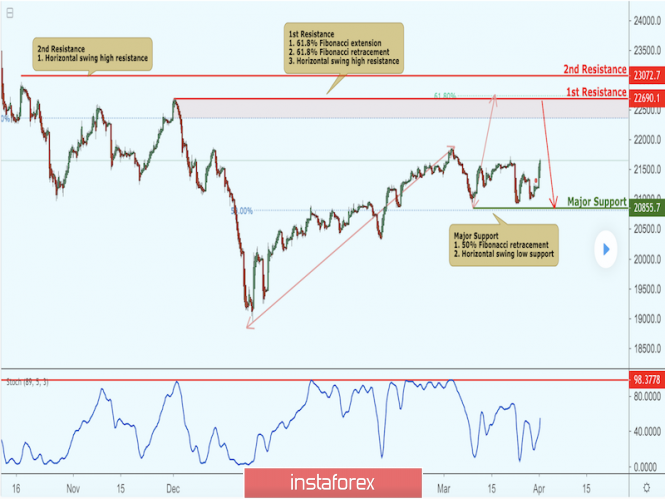
| Nikkei approaching resistance, potential drop! Posted: 03 Apr 2019 06:50 PM PDT Nikkei is approaching our first resistance at 22630.1 (horizontal swing high resistance, 61.8% Fibonacci retracement , 61.8% Fibonacci extension ) where a strong drop might occur below this level pushing price down to our major support at 20855.7 (50% Fibonacci retracement , horizontal swing low support). Stochastic (21,5,3) is also approaching resistance where we might see a corresponding drop in price. Trading CFDs on margin carries high risk. Losses can exceed the initial investment so please ensure you fully understand the risks.
|
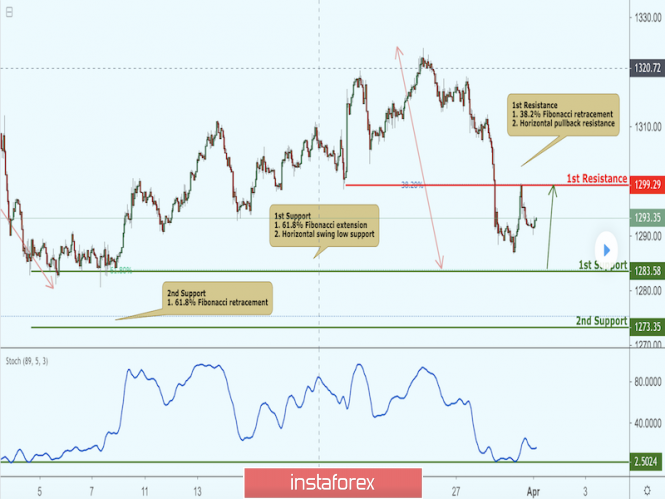
| XAU/USD approaching support, potential bounce! Posted: 03 Apr 2019 06:48 PM PDT XAUUSD is approaching our first support at 1283.58 (horizontal swing low support, 61.8% Fibonacci extension ) where a strong bounce to our major resistance at 1299.29 (horizontal pullback resistance, 38.2%Fibonacci retracement ) might occur. Stochastic is also approaching support where we might see a corresponding bounce in price. Trading CFDs on margin carries high risk. Losses can exceed the initial investment so please ensure you fully understand the risks.
|
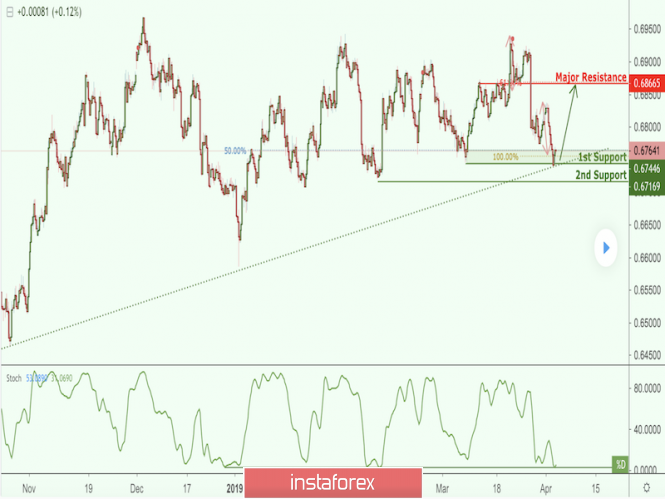
| NZD/USD approaching support, potential bounce! Posted: 03 Apr 2019 06:46 PM PDT NZDUSD is approaching our first support at 0.6744 (long term ascending support line, horizontal swing low support, 50% Fibonacci retracement , 100% Fibonacci extension ) where a strong bounce might occur above this level to our major resistance at 0.6866 (horizontal overlap resistance, 61.8% Fibonacci retracement ). Stochastic is also approaching support. Trading CFDs on margin carries high risk. Losses can exceed the initial investment so please ensure you fully understand the risks.
|
| Fractal analysis of major currency pairs on April 4 Posted: 03 Apr 2019 06:02 PM PDT Forecast for April 4: Analytical review of H1-scale currency pairs: For the euro / dollar pair, the key levels on the H1 scale are: 1.1327, 1.1307, 1.1282, 1.1259, 1.1227, 1.1210, 1.1180 and 1.1134. Here, the price has issued the initial conditions for the upward movement of April 2. Short-term ascending movement is expected in the range of 1.1259 - 1.1282. The breakdown of the latter value will allow us to count on the movement to the level of 1.1307. For the potential value for the top, we consider the level of 1.1327. After reaching which, we expect a rollback to the bottom. Short-term downward movement is possible in the range of 1.1227 - 1.1210. Hence, there is a probability of a reversal to the top. Meanwhile, the breakdown of the level 1.1210 will have to develop the downward structure. In this case, the first potential target is 1.1180. The main trend is the formation of initial conditions for the top of April 2. Trading recommendations: Buy 1.1260 Take profit: 1.1280 Buy 1.1284 Take profit: 1.1305 Sell: 1.1227 Take profit: 1.1211 Sell: 1.1208 Take profit: 1.1189 For the pound / dollar pair, the key levels on the H1 scale are: 1.3373, 1.3314, 1.3271, 1.3210, 1.3135, 1.3103 and 1.3051. Here, we are following the development of the ascending structure from March 29. Continuation of the movement to the top is expected after the breakdown of 1.3210. In this case, the target is 1.3271. Meanwhile, in the range of 1.3271 - 1.3314 we expect a short-term upward movement, as well as consolidation. For the potential value for the top, we consider the level of 1.3373. Upon reaching this level, we expect a rollback to the bottom. Short-term downward movement is possible in the range of 1.3135 - 1.3103. The breakdown of the latter value will lead to a prolonged correction. Here, the target is 1.3051. This level is a key support for the top. The main trend is the upward structure of March 29. Trading recommendations: Buy: 1.3210 Take profit: 1.3270 Buy: 1.3274 Take profit: 1.3312 Sell: 1.3135 Take profit: 1.3105 Sell: 1.3100 Take profit: 1.3055 For the dollar / franc pair, the key levels on the H1 scale are: 1.0065, 1.0040, 1.0023, 0.9996, 0.9975, 0.9961 and 0.9938. Here, we continue to follow the development of the ascending structure of March 27. At the moment, the price is in the correction. Continuation of the movement to the top is expected after the breakdown of 0.9996. In this case, the goal is 1.0023. Meanwhile, in the range of 1.0023 - 1.0040, there is a short-term upward movement, as well as consolidation. For the potential value for the top, we consider the level of 1.0065. After reaching which, we expect consolidation, as well as a rollback to the bottom. Consolidated movement is possible in the range of 0.9975 - 0.9961. Breaking the last value will lead to a prolonged correction. Here, the target is 0.9938. This level is a key support for the top. The main trend is the ascending structure of March 27, the stage of correction. Trading recommendations: Buy: 0.9998 Take profit: 1.0020 Buy: 1.0025 Take profit: 1.0038 Sell: 0.9975 Take profit: 0.9964 Sell: 0.9958 Take profit: 0.9942 For the dollar / yen pair, the key levels on the scale are: 112.69, 112.26, 112.05, 111.69, 111.45, 111.19, 111.00 and 110.67. Here, we are following the development of the ascending structure of March 25. Short-term upward movement is expected in the range of 111.45 - 111.69. The breakdown of the last value should be accompanied by a pronounced upward movement. Here, the goal is 112.05. Meanwhile, in the range of 112.05 - 112.26, there is a price consolidation. For the potential value for the top, we consider the level of 112.69. After reaching which, we expect a rollback to the bottom. Short-term downward movement is possible in the range of 111.19 - 111.00. The breakdown of the latter value will lead to a prolonged correction. Here, the goal is 110.67. This level is a key support for the upward structure. The main trend: the ascending structure of March 25. Trading recommendations: Buy: 111.47 Take profit: 111.66 Buy: 111.72 Take profit: 112.05 Sell: 111.19 Take profit: 111.03 Sell: 110.98 Take profit: 110.70 For the Canadian dollar / US dollar pair , the key levels on the H1 scale are: 1.3381, 1.3349, 1.3329, 1.3300, 1.3257, 1.3229 and 1.3189. Here, we continue to follow the development of the downward structure of March 28. At the moment, the price is in the correction zone. Continuation of the movement to the bottom as an impulse is expected after the breakdown 1.3300. In this case, the target is 1.3257. Meanwhile, in the range of 1.3257 - 1.3229, there is a short-term downward movement, as well as consolidation. For the potential value for the bottom, we consider the level of 1.3189. After reaching this level, we expect a rollback to the top. Consolidated movement is possible in the range of 1.3329 - 1.3349. The breakdown of the latter value will lead to a prolonged correction. Here, the target is 1.3381. This level is a key support for the downward structure of March 28. The main trend is the downward structure of March 28, the stage of correction. Trading recommendations: Buy: Take profit: Buy: 1.3351 Take profit: 1.3380 Sell: 1.3300 Take profit: 1.3260 Sell: 1.3255 Take profit: 1.3230 For the Australian dollar / US dollar pair , the key levels on the H1 scale are: 0.7202, 0.7183, 0.7153, 0.7131, 0.7106, 0.7092, 0.7074 and 0.7048. Here, we are following the formation of the ascending structure from April 2. Continuation of the movement to the top is expected after the breakdown of 0.7131. In this case, the goal is 0.7153, and consolidation is near this level. The breakdown of the level of 0.7155 will lead to the development of a pronounced movement. Here, the target is 0.7183. For the potential value for the top, we consider the level of 0.7202. After reaching which, we expect a consolidation, as well as a rollback to the bottom. Short-term downward movement is possible in the range of 0.7106 - 0.7092. The breakdown of the last value will lead to a prolonged correction. Here, the goal is 0.7074. This level is a key support for the top. The main trend is the formation of initial conditions for the top of April 2. Trading recommendations: Buy: 0.7131 Take profit: 0.7150 Buy: 0.7155 Take profit: 0.7180 Sell: 0.7106 Take profit: 0.7093 Sell: 0.7090 Take profit: 0.7077 For the euro / yen pair, the key levels on the H1 scale are: 126.75, 126.27, 125.93, 125.43, 125.01, 124.78 and 124.44. Here, we are following the development of the March 28 upward cycle. Continuation of the movement to the top is expected after the breakdown of 125.45. In this case, the goal is 125.93. Meanwhile, in the range of 125.93 - 126.27, there is a short-term upward movement, as well as consolidation. For the potential value for the top, we consider the level of 126.75. After reaching which, we expect a rollback to the bottom. Short-term downward movement is possible in the range of 125.01 - 124.78. The breakdown of the latter value will lead to a prolonged correction. In this case, the goal is 124.44. This level is a key support for the top. The main trend is the upward cycle of March 28. Trading recommendations: Buy: 125.45 Take profit: 125.90 Buy: 125.95 Take profit: 126.20 Sell: 125.00 Take profit: 124.80 Sell: 124.75 Take profit: 124.50 For the pound / yen pair, the key levels on the H1 scale are: 149.76, 148.87, 148.20, 147.24, 146.51, 146.09, 145.66 and 144.93. Here, we are following the development of the ascending structure from March 29. Continuation of the movement to the top is expected after the breakdown of 147.24. In this case, the goal is 148.20. The breakdown of which, in turn, will allow us to count on the movement to the level of 148.87. Moreover, we expect consolidation near this value. For the potential value for the top, we consider the level of 149.76. From which, we expect a rollback to the bottom. Short-term downward movement is possible in the range of 146.51 - 146.09. The breakdown of the latter value will lead to a prolonged correction. Here, the goal is 145.66. This level is a key support for the upward structure. Its breakdown will have to form the initial conditions for the downward cycle. In this case, the first potential target is 144.93. The main trend is the upward structure of March 29. Trading recommendations: Buy: 147.30 Take profit: 148.20 Buy: 148.25 Take profit: 148.80 Sell: 146.50 Take profit: 146.15 Sell: 146.05 Take profit: 145.68 The material has been provided by InstaForex Company - www.instaforex.com |
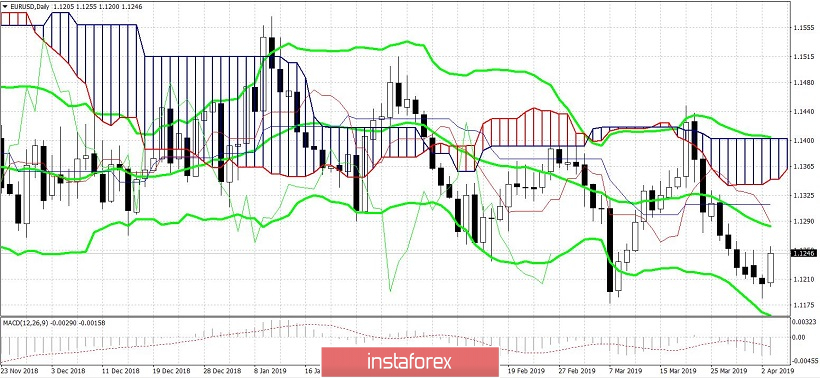
| EUR/USD: China and the United States on the verge of a deal, Britain asks to delay Brexit Posted: 03 Apr 2019 03:49 PM PDT Today, the euro-dollar pair shows a pronounced correctional growth. The correction is due to many reasons, and not all of them are related to the US currency. Good data on the growth of the PMI index in Europe, as well as encouraging news about Brexit prospects inspired EUR/USD bulls, after which the price moved away from the level of annual lows. Although there are no prerequisites for a large-scale recovery of the pair, today's dynamics suggests that the downward path is also given to the bears with great difficulty. In addition, many experts warn that the pair has formed a low around 1.1180, so short positions in this price area are quite risky. The main driving force behind the EUR/USD's growth for today has become the external fundamental background: China and Brexit. Macroeconomic statistics now plays a minor role, but today's PMI figures in the services sector looked too contrasted relative to similar indicators in the production sector. Let me remind you that at the end of March, indicators of production growth in key EU countries turned out to be much worse than expected, that they put strong pressure on the single currency. Today there is a mirror situation. In particular, the German index is gradually increasing since December of last year, being above the 50th mark, which indicates growth in production. In February, this figure unexpectedly jumped to 55.3 points, which surprised the market a lot, and continued to grow in March. And although today there was a slight increase relative to the previous month, the trend speaks for itself. In France, the situation is somewhat worse. In December, the French business activity index fell below the 50 mark, registering the deteriorating situation in the services sector. And this month, it also remained below the key target - but - contrary to the pessimistic forecasts of experts, the indicator showed a modest increase to 49.1 points. But Spain and Italy were surprised by the erratic growth of the index: the Italian figure rose by three points at once (from 50.4 to 53.1), and the Spanish - by two points (from 54.5 to 56.8 points). In the euro area as a whole, business activity in the services sector increased by five tenths of a point relative to the February values, exceeding the forecasts of most experts. The market managed to break the habit of any positive news from the eurozone, so today's release provided indirect support for the single currency. Moreover, the American counterpart of this index (the ISM index for the non-production sphere) is much worse than expected today: instead of the projected increase of 58 points, it barely reached 56: this is the worst result since last July. The dollar index slumped again to 96.6 points, making it possible for the EUR/USD pair to remain in the middle of the 12th figure. And yet the main springboard for the pair's corrective growth has become, I repeat, the external fundamental background. Today, in one of the most influential American publications, an article was published under a blaring headline: "The United States and China have almost agreed on a trade deal." According to the information of journalists, the countries are very close to concluding a historic agreement, however, there are still unresolved issues, and a contact group of negotiators are working on it. In particular, we are talking about the requirement of Beijing to remove US duties worth $250 billion. Washington refused to comply with this request, and now the parties are working on a scenario of gradually easing sanctions pressure. The White House, in turn, wants China to guarantee fulfillment of the agreements reached. According to the interlocutors of the publication, it is quite difficult to create such a mechanism, and at the moment there is no solution to this problem. Summarizing the above, informed sources concluded that the transaction is 90% ready, but the remaining uncoordinated issues are the most complex. According to insiders, if these issues are agreed, then the leaders of China and the US can sign a deal in the coming weeks. Otherwise, the negotiation process will be extended at least until July. But the market did not go into the details and jumped at the encouraging headline. The dollar index has stopped its growth, and the risk appetite has increased in many ways. The fundamental picture of the day was supplemented with news regarding Brexit prospects. And although it is still far from being final, the subtotals allowed traders to take a breath. "Hard" Brexit is not on the agenda again: the British prime minister is trying to get further delay in order to conclude a political agreement with the Laborites. If the parties agree on leaving the country as part of the EU customs union, then the softest version of Brexit will be realized. And although such a scenario actually looks unlikely, traders were optimistic about this turn of events. Now the main actions will take place in Brussels, where the leaders of the European Union countries will decide whether to give the British one more chance to force them to participate in the elections to the European Parliament. According to preliminary data, representatives of many EU countries are against a short-term delay. But negotiations on this issue have just begun, so their results are difficult to predict. However, for the single currency in this context, another thing is important: the probability of implementing hard Brexit on April 12 has decreased greatly, which allows EUR/USD bulls to switch to other fundamental factors. Technically, the pair's situation has not changed. For bulls, it is important not to fall below the bottom line of the Bollinger Bands indicator on the daily chart (1.1180), while the bears have the opposite task – to gain a foothold in the 11th figure. If the sellers do not have enough strength to decline, then a corrective pullback to the boundaries of the 13th figure is quite likely, where the middle line of the Bollinger Bands indicator coincides with the Tenkan-sen line on the daily chart. The material has been provided by InstaForex Company - www.instaforex.com |
| The critical moment for Brexit - now! Posted: 03 Apr 2019 03:49 PM PDT There are negotiations between Prime Minister May and opposition leader Corbyn right now in Britain, regarding a new attempt to reach an agreement on Brexit. What's new today? Prime Minister May said yesterday that she was ready to make big concessions to the opposition - up to preserving Britain in a customs union with the EU ("soft Brexit") - if they succeed in conducting an agreement through Parliament. This can provide a result. In the event of a deal and a majority in Parliament, the pound and euro will be able to show impressive growth. The material has been provided by InstaForex Company - www.instaforex.com |
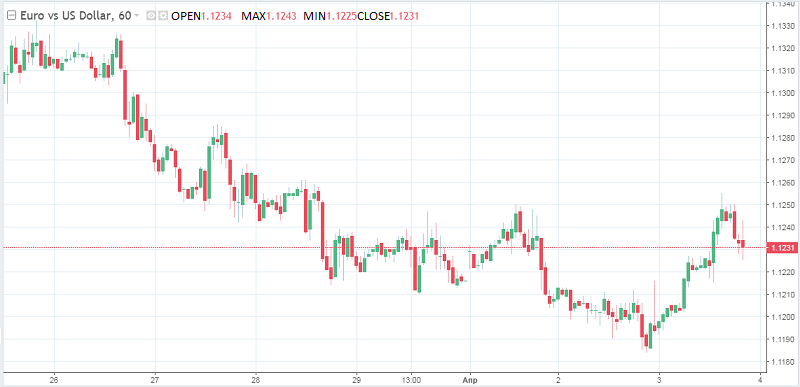
| The players believed in the euro, but the signal was "bearish" Posted: 03 Apr 2019 03:49 PM PDT The euro stopped a six-day decline and increased due to the fact that market participants believed in it. Improving the mood for risky assets is supported by optimism about the deal between the US and China and strong data for China and the eurozone. The euro is rising, while German bonds are falling, and the 10-year yield has risen briefly above zero. The dollar missed the initiative, the EUR/USD pair added 0.45% at $ 1.1252 on Wednesday. The ability to stay above the March lows led to triggering trailing stops, with a huge number being placed above $1.1250. This information was shared with Bloomberg by two traders from Europe. Purchasing manager indices for the services sector in March surpassed all four major economies in the region. In this regard, some concerns over the decline in production have softened. Bear slope Meanwhile, strategists who write for Bloomberg, warned that the general signal for the euro remains bearish for the long term. It is worth recalling the deeply negative real yield, the high level of debt and the stubbornly slow growth of the region's economy. Factors that could protect the euro, are frankly little, so the currency will weaken in the coming months. The exception is that the euro will be used as a safe-haven in times of stress due to the region's current account surplus and relatively low currency volatility. However, the current account surplus slightly decreases. Additional pressure on the single currency will come from parliamentary elections in the European Union in May and early elections in Spain. Political tensions in France and Italy will also add pressure on the euro. Brexit consequences for Europe Now they are actively discussing the possible consequences of an exit without a deal. This is dangerous not only for Britain itself, but also for Europe and the world economy as a whole. Investors are forced to admit that the "hard" scenario next week is not only not excluded, but also quite possible. Goldman Sachs tried to describe the economic effect of Brexit 2.5 years after the referendum. The picture turned out, to put it mildly, alarming. So, during the week after the referendum, the UK economy lost 2.4% of GDP, or about 600 million pounds. Most of these losses relate to business investment, so the bank is inclined to believe that experts underestimated the effect of political uncertainty. Brexit every 2.5 years is a major stimulant for the UK markets and investments. In the first quarter of this year, growing uncertainty reduced investment growth by 5% in quarterly terms. Major investments (airplanes, trains, and equipment) and services (hotels and restaurants) are most severely affected, heightening the threat of recession in the European industrial sector. Another shock As noted by the bank, risky assets in the world markets were affected by the referendum's results, especially in Europe. Since an exit without a deal would be another shock, then this situation may happen again. The "soft" scenario next week will support the UK economy. With a random exit, the European economy will suffer negative consequences for several years. The strengths of the ECB are not limitless Of course, the regulator is able to remove the painful symptoms of the initial shock in the financial market. In this case, it will resume buying bonds and reduce the profitability of Italian securities. However, the ECB is unlikely to cope with a third recession over the past 10 years. Worst of all, the central bank is already backing down, retreating from its plans to tighten policies and promising that it would keep low rates until the end of this year. It turns out that the regulator has a limited arsenal of tools to mitigate the consequences of a negative scenario. The material has been provided by InstaForex Company - www.instaforex.com |
| April 3, 2019 : EUR/USD Intraday technical analysis and trade recommendations. Posted: 03 Apr 2019 09:14 AM PDT
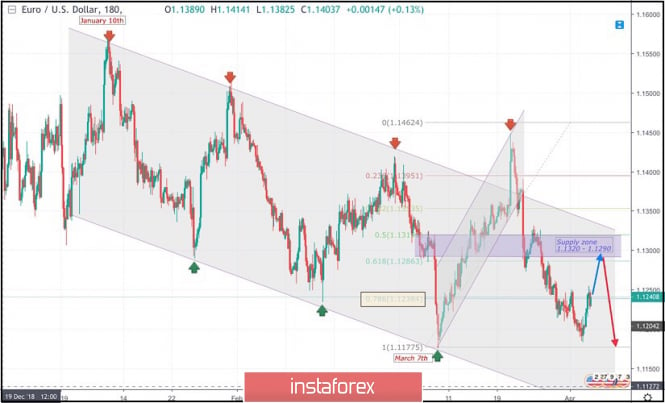
On January 10th, the market initiated the depicted bearish channel around 1.1570. The bearish channel's upper limit managed to push price towards 1.1290 then 1.1235 before the EUR/USD pair could come again to meet the channel's upper limit around 1.1420. Shortly after, the recent bearish movement was demonstrated towards 1.1175 (channel's lower limit) where significant bullish recovery was demonstrated on March 7th. Bullish persistence above 1.1270 enhanced further bullish advancement towards 1.1290-1.1315 (the Highlighted-Zone) which failed to provide adequate bearish pressure. On March 18, a bullish breakout attempt was executed above 1.1327 (the upper limit of the Highlighted-zone). This enhanced further bullish movement towards 1.1450 demonstrating a false bullish breakout above the upper limit of the depicted movement channel. On the other hand, On March 22, significant bearish pressure was demonstrated around 1.1380 leading to the current bearish decline towards 1.1220 then 1.1220. The short term outlook for EURUSD pair remains bearish towards 1.1170 and 1.1120. Bearish persistence below 1.1235 (Fibonacci 78.6%) is mandatory to pursue towards the next mentioned bearish targets. Otherwise, a bullish breakout above 1.1235 would initiate another bullish pullback towards 1.1280-1.1320 where a better SELL entry can be offered. Trade recommendations : Conservative traders should wait for another bullish pullback towards 1.1280-1.1320 for a low-risk SELL entry. TP levels to be located around 1.1200, 1.1170 and 1.1120. SL to be located above 1.1350. The material has been provided by InstaForex Company - www.instaforex.com |
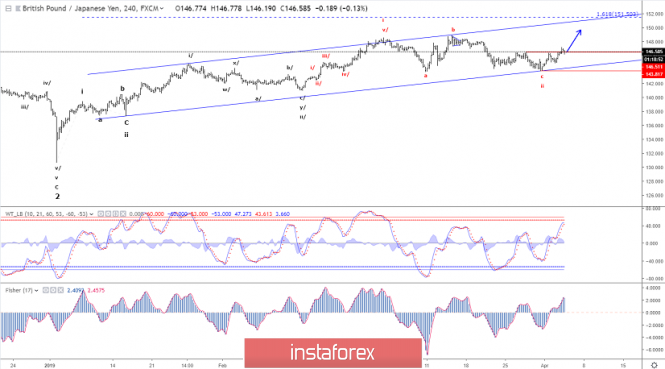
| Elliott wave analysis of GBP/JPY for April 3, 2019 Posted: 03 Apr 2019 08:53 AM PDT
GBP/JPY has broken back above resistance at 145.50 indicating more upside pressure towards 148.50 and 151.50 as the target. Support is now seen at 145.90 with key support at 144.90 which should be able to protect the downside for the next move higher towards 148.50. Only an unexpected break below support at 144.90 will confuse the short term picture. R3: 148.50 R2: 148.10 R1: 147.50 Pivot: 147.18 S1: 146.16 S2: 145.52 S3: 144.90 Trading recommendation: We bought GBP at 146.51 and we will move our stop higher to 144.80. The material has been provided by InstaForex Company - www.instaforex.com |
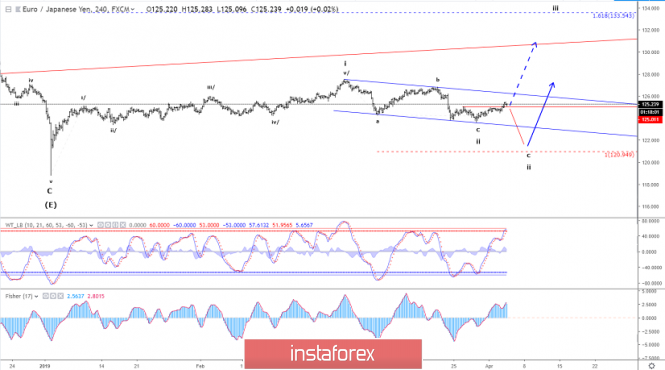
| Elliott wave analysis of EUR/JPY for April 3, 2019 Posted: 03 Apr 2019 08:48 AM PDT
EUR/JPY has spiked to just above the 125.27 target. A break below support at 124.52 is now needed to confirm that the corrective rally from 123.65 is complete and renewed downside pressure should be expected towards 123.65 and 122.07 and ideally closer to 120.95 before a low should be expected and a turn higher should be expected. Only a direct break above 126.17 will shift the focus back towards the upside and a rally to 127.50 and above. R3: 126.17 R2: 125.70 R1: 125.27 Pivot: 124.95 S1: 124.75 S2: 124.56 S3: 124.12 Trading recommendation: We are short EUR from 124.25 with our stop placed at 126.20 The material has been provided by InstaForex Company - www.instaforex.com |
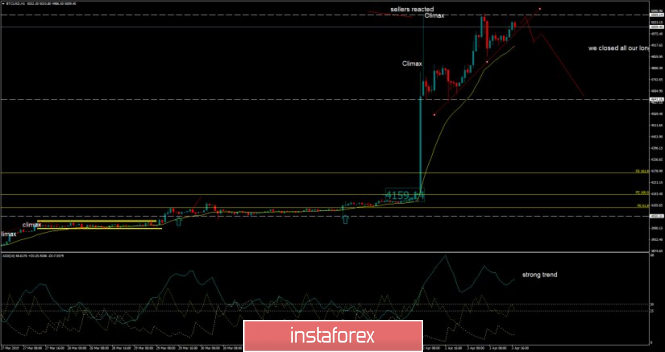
| Bitcoin analysis for April 03, 2019 Posted: 03 Apr 2019 07:52 AM PDT BTC has been trading upward. The price re-visited the resistance at $5.070 and BTC got rejected. Seems like buyers lost power and that most of buyers exited their positions.
According to the H1 time-frame, we found very high reading at 48 on the ADX indicator, which is sign that trend and momentum are still strong. Anyway, because of the climatic actions in the background and the re-test of the high at $5.070 buying looks very risky. In our opinion it is better to play for potential downside correction in case that you see the breakout of the upward trendline. Downward target is set at $4.641. Watch for buying opportunities only if you see breakout of the $5.070 and successful re-test. The material has been provided by InstaForex Company - www.instaforex.com |
| Sunny day for the dollar seems to be nearing sunset Posted: 03 Apr 2019 07:43 AM PDT Over the past year, the greenback has been strengthened mainly due to the divergence in the economic growth of the United States and the rest of the world, as well as trade conflicts, and the monetary tightening of the Fed. However, the upward trend in the USD index may be questionable when neither the Fed nor the White House is against the weakening of the US currency. The picture for the dollar is not entirely rosy in the light of the fact that Washington and Beijing can sign an agreement on ending the trade war. The gradual restoration of European and Chinese GDP will make it possible to count on the dispersal of the global economy. In addition, it is possible that in order to achieve the goal of raising the country's GDP by 3% under the conditions of the "fading" effect of the tax reform and the Fed will have to at least reduce the federal funds rate. According to HSBC experts, instead of simply reducing the rate, the regulator can launch a new asset purchase program. In such conditions, the US currency will be forced to weaken. "The best days for greenback this year seem to be over," experts at Morgan Stanley said. According to their estimates, the dollar could drop by 6% by the end of the year against the background of a slowdown in the US economy and a softening of the Fed's position. "We think that the dollar has peaked in the current cycle and may be cheaper than the market expects. The weakening of the "American", in turn, will help reduce the attractiveness of investments in dollar assets, "representatives of the financial institution said. The material has been provided by InstaForex Company - www.instaforex.com |
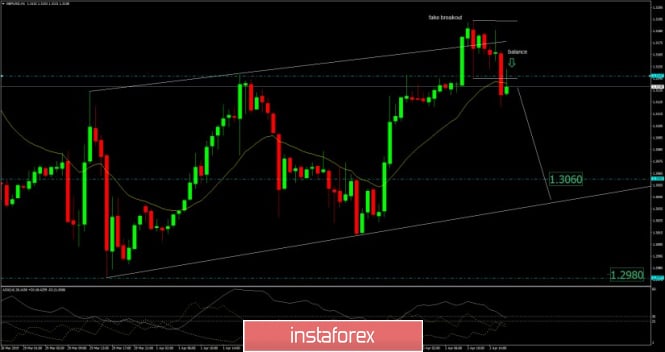
| GBP/USD analysis for April 03, 2019 Posted: 03 Apr 2019 07:41 AM PDT GBP/USD has been trading upwards. The price tested the level of 1.3194. Anyway, we found that there can be potential trap for buyers and that the bullish movement wasn't strong enough.
According to the H1 time-frame, we found that there is the fake breakout of the resistance at the price of 1.3147, which is sign that buyers don't have enough power to sustain the breakout. Most recently, there is the down breakout of the 5-hour balance, which is another sign of the GBP weakness. Resistance level is seen at the price of 1.3194 and the support levels are seen at 1.3060 and 1.2980. Trading recommendation: We sold GBP from 1.3138 with targets at 1.3060 and 1.2980. Protective stop is placed at 1.3205. The material has been provided by InstaForex Company - www.instaforex.com |
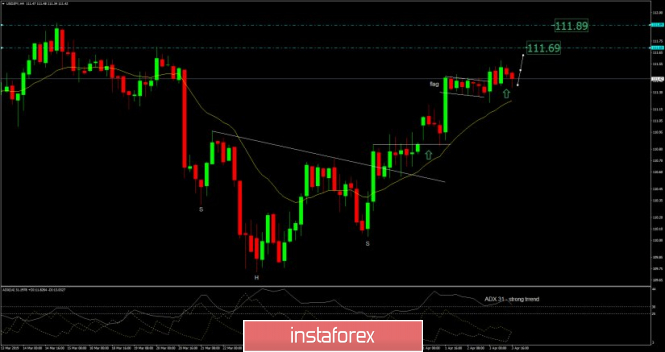
| USD/JPY analysis for April 03, 2019 Posted: 03 Apr 2019 07:23 AM PDT USD/JPY has been trading upwards as we expected. The price tested the level of 111.58. We are still expecting more upside on USD/JPY.
According to the H4 time-frame, USD/JPY is still in the robust short-term upward trend and our expectation is that price will head towards the resistance levels at 111.70 and 111.90. ADX reading is at 31, which is another sign that trend is strong. Price is also trading above the 20-exponential moving average (yellow line) and most recently we got the breakout of the bullish flag. Support level is seen at the price of 111.20. Trading recommendation: We are still holding our long position from 110.95 with the secured stop lose on breakeven but we added another smaller long position from 111.40 and with the protective stop at 111.10. The material has been provided by InstaForex Company - www.instaforex.com |
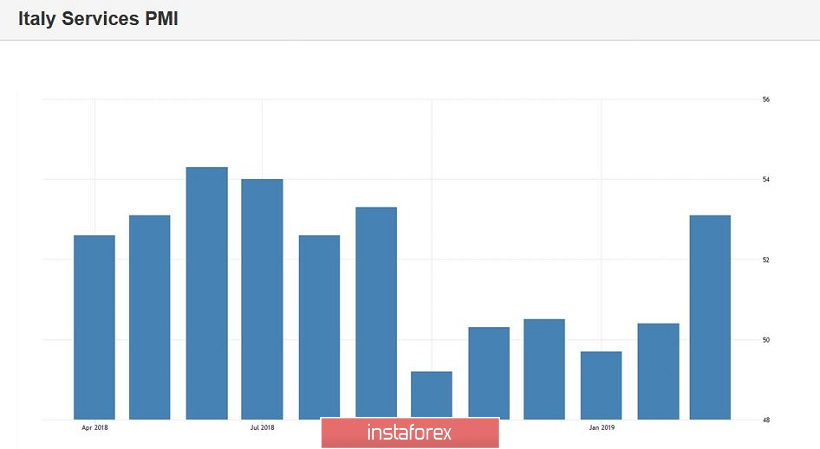
| Posted: 03 Apr 2019 06:59 AM PDT The data released in the first half of the day on activity in the services sector of the eurozone countries supported the European currency, which managed to strengthen its position against the US dollar, however, as the day before, the growth was temporary. According to the report of the company Markit, the PMI Purchasing Managers Index for Italy rose to 53.1 points in March, while in February it was 50.4 points. Economists had expected the index to rise to 50.7 points in March. The IHS Markit noted that the positive dynamics of the activity of service companies can help pull the economy out of the recession. The same indicator for Germany also pleased investors. According to the data, the PMI Purchasing Managers Index for Germany's service sector rose to 55.4 points in March, while in February it was 55.3 points. Economists did expect the index to decline to 54.9 points. But France "pumped up" with its indicator for the service sector, which in March fell below 50 points, indicating its decline. According to the report, the PMI Purchasing Managers Index for France in March was 49.1 points, while in February it stood at 50.2 points. Economists did expect a larger fall of the indicator to the level of 48.7 points. Good performance in the eurozone countries managed to lead to an increase in the overall index for the eurozone services sector, which rose to 53.3 points in March against 52.8 points in February. It was predicted to decrease to 52.7 points. As for the composite index, based on recent data on eurozone PMI in the manufacturing sector and the service sector, in March there was a decline to 51.6 points against 51.9 points in February. Let me remind you that a value above 50 indicates an increase in activity. All this once again suggests that the downside risks for the eurozone economy are only increasing. Data on retail sales in the euro area also supported the euro, but some are not enough to positively affect the overall situation in the European economy. According to the data, retail sales in the eurozone in February of this year grew by only 0.4% compared with January. Compared to the same period in 2018, retail sales increased by 2.8%. Economists had forecast retail sales to increase by only 0.2% in February. Retail sales in the eurozone in January were revised to 0.9% after falling 1.4% in December 2018. As for the technical picture of the EURUSD pair, it generally remained unchanged. The buyers of risky assets, though close to the upper border of a wide side channel, but all that was able to push it a few points. Now the main trade will unfold in the range of 1.1185-1.1250 with a middle in the area of 1.1218. Only a break of 1.1250 will lead to new highs in the area of 1.1290 and 1.1330. The material has been provided by InstaForex Company - www.instaforex.com |
| The growth of oil can only cancel force majeure Posted: 03 Apr 2019 06:53 AM PDT The dynamics of oil is optimistic and prices are convincingly going up. The American WTI is trading above $60 a barrel and Brent is close to $70 a barrel. Hedge funds and other financial managers have increased their long positions in black gold. Net long for six major contracts was increased by 37 million barrels for the week of March 26. It is noted that the expansion of pure long on WIT and Brent was due rather to the growth of adding new long positions rather than closing short ones. Hedge funds have stepped up to open a buy position after a pause in March for a number of reasons. A period of relaxation for 8 importers of Iranian oil is coming to an end and therefore, market participants are worried that America will not extend the exemptions for these countries. An argument for the growth of oil was the first estimates of a new decline in production by OPEC + members in March. Both planned reductions and extraordinary circumstances have played their part. By the end of March, Russia reduced production by 0.18 Mb/d, which is lower than the promised figure. At the same time, many OPEC + countries have exceeded their obligations. It is curious how much Venezuela has reduced. Preliminary data showed that average production was just under 1 Mb/d. Equally interesting is the similar information from Saudi Arabia set the tone for OPEC+ and showed maximum production cuts compared to the end of last year, which in connection with the upcoming IPO. Information about the largest Ghawar oil field in the world in Saudi Arabia became an unexpected engine of price growth. Bloomberg reported, the production here is a maximum of 3.8 Mb/d, which is far below market expectations and previously announced by Saudi Aramco itself. Previously, it was about 5 Mb/d and EIA completely estimated production at Gavar at 5.8 Mb/d. It turns out that now the largest oil whale is inferior in performance to American fields Permian. After a serious deterioration in production rates, oil market traders will be concerned with some caution about the estimates that the country can easily increase production to 12 Mb/d, in principle. Meanwhile, the Saudis have something to brag about except for Ghawar. Oil is supported by optimistic data on the industrial sector of China, as well as the declared progress in trade negotiations between the US and China. Oil surveys have reached a strong technical resistance and can slow down for a while so that the big players can regroup their positions. In general, interest in shopping now can only cancel the major force. The material has been provided by InstaForex Company - www.instaforex.com |
| Posted: 03 Apr 2019 06:50 AM PDT To open long positions on GBP/USD you need: Traders bought a pound against the background of optimism associated with Brexit, but a weak report on the service sector in the UK returned bears to the market and limited growth. At the moment, only the formation of a false breakdown in the intermediate support area of 1.3151 will be a signal to buy GBP/USD. However, the optimal scenario for opening long positions will be the test of the minimum of 1.3112 and 1.3072. The task of the bulls in the afternoon will be a breakthrough and consolidation above the resistance of 1.3192, which will lead the pair to a maximum in the area of 1.3227 and 1.3261, where I recommend fixing the profits. To open short positions on GBP/USD you need: Traders ignored the fact that the service activity index showed a slowdown, which is a very disturbing signal. The repeated support test of 1.3151 may lead to a larger downward correction in the pound in order to update the lows in the area of 1.3112 and 1.3072, where I recommend fixing the profit. In the scenario of the pound growth above the resistance of 1.3193 in the second half of the day, it is best to consider new short positions on the rebound from the high of 1.3227 and 1.3261. Indicator signals: Moving Averages Trading is conducted above 30-day and 50-medium moving, which indicates the formation of a bullish market. Bollinger bands The break of the average border of the Bollinger Bands indicator in the area of 1.3151 will lead to a larger sale of the pound with the test of its lower border in the area of 1.3112. Description of indicators
|
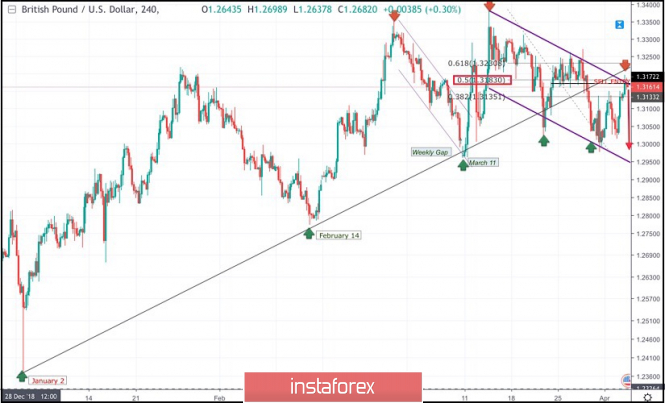
| April 3, 2019 : GBP/USD Intraday technical analysis and trade recommendations. Posted: 03 Apr 2019 06:29 AM PDT
On January 2nd, the market initiated the depicted uptrend line around 1.2380. This uptrend line managed to push price towards 1.3200 before the GBP/USD pair came to meet the uptrend again around 1.2775 on February 14. Another bullish wave was demonstrated towards 1.3350 before the bearish pullback brought the pair towards the uptrend again on March 11. A weekly bearish gap pushed the pair slightly below the trend line (almost reaching 1.2960) before the bullish breakout above short-term bearish channel was achieved on March 11. Bullish persistence above 1.3060 allowed the GBPUSD pair to pursue the bullish momentum towards 1.3130, 1.3200 then 1.3360 where the recent bearish pullback was initiated towards the uptrend again. On March 25, bullish persistence above 1.3250 was needed for confirmation of a bullish Flag pattern. However, significant bearish pressure was demonstrated below 1.3250 demonstrating a false bullish breakout above 1.3200 (the upper limit of the depicted bearish channel). Hence, the short term outlook turned to become bearish towards 1.3150 - 1.3120 where the depicted uptrend line failed to provide any immediate bullish support leading to obvious bearish breakdown. By the end of last week, the price levels of 1.3020-1.3000 (the lower limit of the depicted movement channel) demonstrated significant bullish rejection. This brought the GBPUSD pair again towards the price zone of (1.3160-1.3180) where the upper limit of the depicted bearish channel as well as the backside of the depicted uptrend line are located. Bearish rejection should be anticipated around the current price levels (1.3160-1.3180) as long as no bullish breakout above 1.3200 is achieved. Trade Recommendations: Intraday traders should can have a valid SELL entry around the current price zone (1.3160-1.3180). SL to be located above 1.3200. TP levels to be located around 1.3100 and 1.3020. The material has been provided by InstaForex Company - www.instaforex.com |
| Gold does not believe Central banks Posted: 03 Apr 2019 05:29 AM PDT After a stormy start, gold fans were forced to hold their horses. The US dollar was not as weak as investors expected it after the change in the Fed's outlook, and the US stock market was marked by the best quarterly result since 2009 and the best beginning of the year since 1998. The increase in global risk appetite is not the most favorable background for bulls in XAU/USD. The precious metal is considered to be a safe-haven asset, and the de-escalation of the trade conflict between Washington and Beijing and the associated rally of the world stock market clipped its wings. From a fundamental point of view, the current consolidation of gold is fully justified. First, investors prefer not to force events on the eve of an important report on the state of the US labor market in March. As a rule, employment statistics are perceived as a kind of hint about further actions by the Fed. Secondly, the precious metal is affected by a group of heterogeneous factors: on the one hand, the fall in the yield of Treasury bonds gives it a helping hand, on the other - the strengthening of the dollar and the growth of stock indices, on the contrary, drown the analyzed asset. As a result, futures froze in the short-term trading range of $1280-1300 per ounce. Despite the blurred ending, the first quarter, the first quarter can be brought to "bulls" on XAU/USD in an asset. Gold closed in the green zone, and ETF reserves rose by 38 tons. Central banks continued to be active, led by a regulator from Russia. In February, its reserves rose by 1 million ounces - the best result since November. According to the World Gold Council, in 2008, the Central Bank of the Russian Federation bought 274 tons of ingots, which is equivalent to $ 11 billion at average prices. Russia's share in the procurement of all regulators is 40%, in global demand for precious metals - 6%. For the first time in history, the scale of gold purchases by the Central Bank exceeded the production volumes in the country. The share of precious metals in gold and foreign exchange reserves increased to 20%, while the share of the US dollar decreased from 46% to 22%. Dynamics of purchases and gold mining in Russia Obviously, Moscow's actions are aimed at reducing dependence on the United States in the context of economic sanctions by diversifying dollar assets into gold and yuan. If other countries follow the same path, then the demand for US currency will seriously suffer, which is a bullish factor for XAU/USD. In general, the external background is moderately favorable for the analyzed asset. The slowdown in global GDP and the pigeon rhetoric of central banks are pushing down bond yields. As we move up the risks of correction of global stock indices grow. It is difficult to imagine that in the face of disappointing macroeconomic statistics, an increasing likelihood of completion of the economic cycle and recession in the US, the S & P 500 could go north indefinitely. Unless the Fed, under pressure from the White House, starts cutting rates. In this situation, the dollar will weaken, which the bulls on XAU/USD will immediately use. Technically, the inability of gold to break above resistances by 50% and 61.8% of the CD wave increases the risks of activating the 5-0 pattern. For this, the "bears" need a confident assault of support at $1280 per ounce. The material has been provided by InstaForex Company - www.instaforex.com |
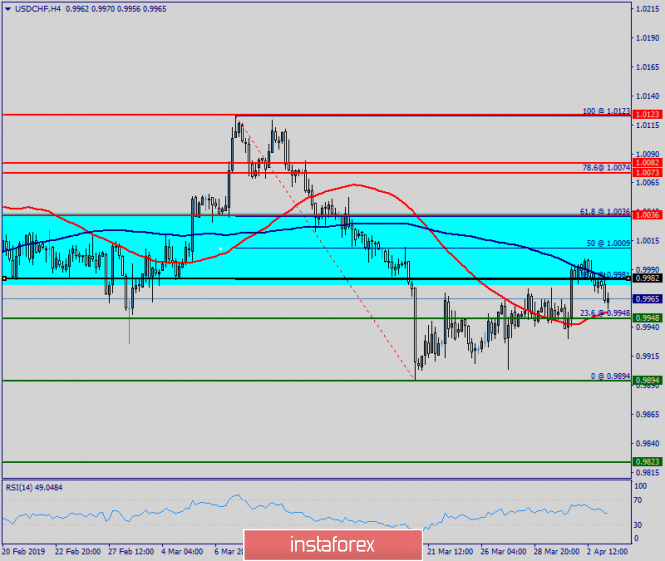
| Technical analysis of USD/CHF for April 03, 2019 Posted: 03 Apr 2019 04:45 AM PDT Overview: The USD/CHF pair continues moving in a bullish trend from the support levels of 0.9895 and 0.9948. Currently, the price is in an upward channel. This is confirmed by the RSI indicator signaling that the pair is still in a bullish trend. As the price is still above the moving average (100), immediate support is seen at 0.9948 coinciding with a golden ratio (23.6% of Fibonacci). Consequently, the first support is set at the level of 0.9948. So, the market is likely to show signs of a bullish trend around 0.9948. In other words, buy orders are recommended above the golden ratio (0.9948) with the first target at the level of 0.9983. Furthermore, if the trend is able to breakout through the first resistance level of 0.9983, we should see the pair climbing towards the double top (1.0036) to test it. It would also be wise to consider where to place a stop loss; this should be set below the second support of 0.9895. The material has been provided by InstaForex Company - www.instaforex.com |
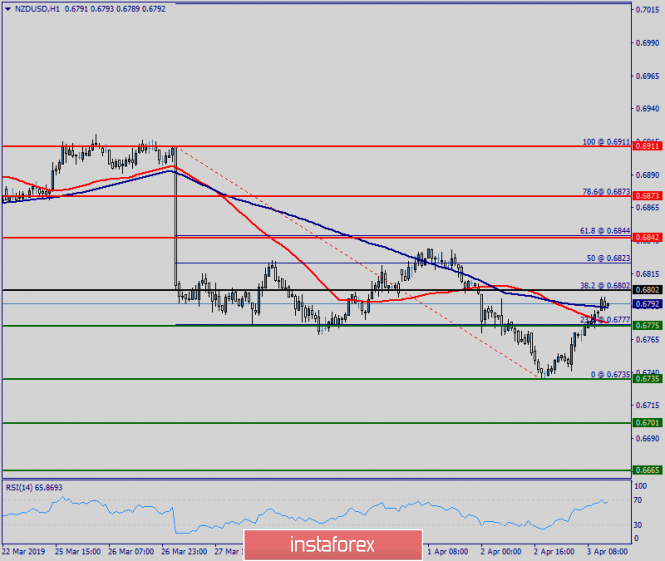
| Technical analysis of NZD/USD for April 03, 2019 Posted: 03 Apr 2019 04:34 AM PDT The NZD/USD pair is showing signs of strength following a breakout of the highest level of 0.6765. On the H1 chart. the level of 0.6765 coincides with 23.6% of Fibonacci, which is expected to act as minor support today. Since the trend is above the 23.6% Fibonacci level, the market is still in an uptrend. But, major support is seen at the level of 0.6735. Furthermore, the trend is still showing strength above the moving average (100). Thus, the market is indicating a bullish opportunity above the above-mentioned support levels, for that the bullish outlook remains the same as long as the 100 EMA is headed to the upside. Therefore, strong support will be found at the level of 0.6735 providing a clear signal to buy with a target seen at 0.6842. If the trend breaks the minor resistance at 0.6842, the pair will move upwards continuing the bullish trend development to the level 0.6911 in order to test the double top. The material has been provided by InstaForex Company - www.instaforex.com |
| Posted: 03 Apr 2019 03:53 AM PDT The British pound strengthened its position in pair with the US dollar and continues to update highs against the background of yesterday's statements made by British Prime Minister Theresa May. She announced her intention to apply for an additional delay of Brexit. This was done under the pretext of coordination with the opposition Labor Party of the country's exit plan from the European Union. During the presentation, May said that the UK needs a longer delay for Brexit, adding that the time for debate and disagreement was over. The Prime Minister wants to have time to agree on a plan for leaving the EU with the Labor Party, which should include an agreement on Brexit. Only this will allow counting on the approval of the agreement by the Parliament. May also noted that she would try to get the approval of the Parliament before the elections in Europe, which will be held on May 22. Yesterday's data on a weak PMI purchasing managers index for the UK construction sector put only temporary pressure on the pound. According to the report, construction PMI in March 2019 amounted to 49.7 points against 49.5 points in February. Finding an index below the key level of 50 indicates that activity in the sector continues to decline. Today, we expect an important report on the service sector, which could lead to a sharp increase in the volatility of the pound. In the case of weak indicators, the pressure on the GBPUSD pair may return. The European currency slightly regained its position against the US dollar after the release of a weak inflation report. According to the data, PPI eurozone producer price index in February of this year grew by only 0.1% compared with January and 3.0% compared with February 2018. Economists had forecast that producer prices in the eurozone would rise by 0.1% and 3.1%, respectively. As for the basic index excluding energy, it remained unchanged in February compared with January and grew by only 1.2% year-on-year. Weak inflation is another reason to take the time to raise interest rates in the eurozone, which almost no one talks about already. Data on the US economy also leave more questions than the answer. An important indicator such as the demand for durable goods in the United States has declined, which is a bad sign. Although the fall was due to a sharp decline in orders for civil aircraft, orders for goods with a service life of at least three years in February decreased by 1.6% compared with January and amounted to 250.58 billion US dollars. Economists had expected orders to decline by 2.1% in February. The US Department of Commerce also reported that orders for civilian aircraft dropped immediately by 31%. According to the Retail Economist-Goldman Sachs, the index of sales in US retail chains fell by 1.2% from March 24 to 30 compared to the previous week. Compared to the same period of the previous year, sales increased by 0.9%. Retail Economist noted that sales have remained almost unchanged over the past two months. Let me remind you that on Monday, data from the US Department of Commerce came out, where retail sales declined, indicating a drop in consumer activity. As for the technical picture of the EURUSD pair, further growth is required to keep above the support level of 1.1215, from which the bulls will try to build a new upward wave of risky assets growth, with the maximum in the area of 1.1270 and 1.1330. When returning to the support level of 1.1215, buyers will take the initiative only after retesting the low of this month in the 1.1185 area, or already from the larger support areas of 1.1120 and 1.1035. The material has been provided by InstaForex Company - www.instaforex.com |
| Posted: 03 Apr 2019 03:53 AM PDT 4-hour timeframe Technical details: The upper linear regression channel: direction - up. The lower linear regression channel: direction - down. Moving average (20; smoothed) - sideways. CCI: 78.4502 From a fundamental point of view, the GBP/USD currency pair failed to continue the logical downward movement and returned to the area above the moving average line. In the meantime, the whole Brexit procedure was on the verge of another transfer. This time, we are talking about next year. Theresa May herself wants to postpone Brexit to a date no later than May 22, in order not to participate in the elections to the European Parliament, and to spend the time gained in negotiations with the opposition forces with the aim of obtaining approval for at least some version of Brexit. The news that the country's withdrawal from the EU may be postponed is not perceived positively by the markets for the first time. It seems that the markets consider any transfer to be a postponement of the implementation of the "tough" Brexit scenario, as well as an increase in the possibility of holding a second referendum, or the refusal of Brexit in general. However, whatever the outcome of May's negotiations with the EU or with the Labor Party, in fact, the UK now has only one way – to organize new votes and hope that the majority will still be formed. However, if the last time the Parliament voted for all Brexit options in a row, several scenarios did not get just a few votes, which gives hope for their adoption in future votes. However, it is precisely these options that should be put on the agenda. In general, the pound received another temporary respite, and Brexit – a new portion of uncertainty. Nearest support levels: S1 - 1.3123 S2 - 1.3062 S3 - 1.3000 Nearest resistance levels: R1 - 1.3184 R2 - 1.3245 R3 - 1.3306 Trading recommendations: The pair GBP/USD has fixed above the moving. Therefore, purchase orders with targets at 1.3184 and 1.3245 have become relevant again. Until a new negative has been received from Britain, the pound may strengthen for some time. Short positions will become relevant only after the price is fixed back below the moving with the first target at 1.3062. Today in the UK, it is worth paying attention to the publication of the index of business activity in the services sector. In addition to the technical picture should also take into account the fundamental data and the time of their release. Explanations for illustrations: The upper linear regression channel is the blue lines of the unidirectional movement. The lower linear channel is the purple lines of the unidirectional movement. CCI is the blue line in the indicator regression window. The moving average (20; smoothed) is the blue line on the price chart. Murray levels - multi-colored horizontal stripes. Heikin Ashi is an indicator that colors bars in blue or purple. The material has been provided by InstaForex Company - www.instaforex.com |
| Posted: 03 Apr 2019 03:53 AM PDT 4-hour timeframe Technical details: The upper linear regression channel: direction - down. The lower linear regression channel: direction - down. Moving average (20; smoothed) - down. CCI: -8.6153 On Wednesday, April 3, the currency pair EUR/USD began to be adjusted. Moreover, the correction began at the wrong time, which would be more logical. Yesterday, reports on orders for long-term goods in the United States frankly failed, and the trend of weak macroeconomic statistics from America is beginning to alarm us. The main indicator for February fell by 1.6%, excluding transport edged up 0.1% (below the forecast), excluding the defense of 1.9%. However, the strengthening of the euro has begun tonight, and not yesterday at the American trading session. The fact that traders do not respond to disappointing statistics from the States indicates that sales of the pair are now preferable. It will be possible to expect a more or less serious strengthening of the euro not earlier than overcoming the moving average line. Today, the euro area is scheduled to publish retail sales for February with a forecast of + 2.3% y / y. If in reality, the increase will be smaller, then the euro may once again fall down. In America today, indices of business activity in the services sector Markit and ISM will be published, as well as a composite IDA. In addition, there will be a report on the change in the number of workers in the private sector. They can also support the US dollar. By the way, we state the fact that for the eighth time traders failed to overcome the area of 1.1200 - 1.1270, this time the fall stopped near the lower boundary of this area. Nearest support levels: S1 - 1.1200 S2 - 1.1169 Nearest resistance levels: R1 - 1.1230 R2 - 1.1261 R3 - 1.1292 Trading recommendations: The EUR/USD currency pair has begun to adjust. Thus, it is now recommended to wait for the completion of the correction and resume trading for a fall with the targets at 1.1200 and 1.1169. Buy positions are recommended to be considered no earlier than fixing the pair above the moving with the first targets at 1.1261 and 1.1292. In this case, the trend in the instrument will change to ascending, and the euro will have chances for strengthening. In addition to the technical picture should also take into account the fundamental data and the time of their release. Explanations for illustrations: The upper linear regression channel is the blue lines of the unidirectional movement. The lower linear regression channel is the purple lines of the unidirectional movement. CCI - blue line in the indicator window. The moving average (20; smoothed) is the blue line on the price chart. Murray levels - multi-colored horizontal stripes. Heikin Ashi is an indicator that colors bars in blue or purple. The material has been provided by InstaForex Company - www.instaforex.com |
| Analysis of EUR/USD divergence for April 3. The euro turned around the previous low Posted: 03 Apr 2019 03:53 AM PDT 4h As seen on the 4-hour chart, the EUR/USD pair performed a reversal in favor of the European currency after the formation of the bullish divergence at the MACD indicator and began to grow in the direction of the retracement level of 76.4% (1.1241). The rebound of the pair from this level will allow traders to expect a reversal in favor of the US currency and a resumption of the fall in the direction of the Fibo level of 100.0% (1.1177). Closing the course of the pair above the Fibo level of 76.4% will increase the chances of continued growth in the direction of the retracement level of 61.8% (1.1281). The Fibo grid is built on the extremums from March 7, 2019, and March 20, 2019. Daily As seen on the 24-hour chart, the pair closed below the retracement level of 127.2% (1.1285), which makes it possible to count on a further drop in quotations in the direction of the next retracement level of 161.8% (1.0941). However, it still confuses the previous low of the pair, which will not be easy to pass. Near this low, we can expect a reversal of the pair in favor of the euro currency and the resumption of growth. If there are no problems with its passage, then the chances of falling will increase. The Fibo grid is based on the extremums from November 7, 2017, and February 16, 2018. Trading advice: Buy deals on EUR/USD pair can be opened with the target at 1.1241 since a bullish divergence was formed. The stop-loss order should be placed below the level of 1.1177. New purchases – after closing above the level of 1.1241. Sell deals on EUR/USD pair can be opened with the target at 1.1177 if the pair rebounds from the retracement level of 76.4%. The stop-loss order should be placed above the level of 1.1241. The material has been provided by InstaForex Company - www.instaforex.com |


| You are subscribed to email updates from Forex analysis review. To stop receiving these emails, you may unsubscribe now. | Email delivery powered by Google |
| Google, 1600 Amphitheatre Parkway, Mountain View, CA 94043, United States | |
No comments:
Post a Comment