
Analyst Articles – Forex News 24 |
- Crude Oil Price Boosted as Middle East Tensions Escalate
- Australian Elections Preview – How Will Markets React?
- S&P 500 Trend Eyes Support, US Auto Tariff Delay Cheer Fades in Asia
- EURUSD Carves Bearish Series Amid Failure to Break May Opening Range
- S&P 500 Firms, EURUSD and USDCAD Waver on Flood of Trade War Rumors
- US TIC Flows Show Appettite for Debt Decreased Amid Trade Tensions
- AUDUSD Rate at Risk Ahead of Aussie Jobs Data, RBA Cut Bets
- Retail Traders Conflicted as Index Rebounds
- Traders Remain Net-Long Since May 06
- Metal Pauses at Resistance as Trade Wars Cool
| Crude Oil Price Boosted as Middle East Tensions Escalate Posted: 16 May 2019 01:55 AM PDT Hits: 11 Crude Oil Price Chart and Analysis:
The Brand New DailyFX Q2 2019 Trading Forecast and Guides are Available to Download Now!! CFTC Crude Oil Speculative Net PositionsHow to Trade Oil: Crude Oil Trading Strategies & Tips. Increased tension between the US and Iran in the Middle East continues to underpin the price of oil as fears grow of supply disruptions and outages. On Wednesday the US issued a travel warning and ordered all non-emergency diplomatic staff to leave Iraq after four ships were attacked of the UAE cost earlier in the week. In addition, a drone attack on a Saudi pipeline was claimed by Houthi rebels, stoking fears further. Also Wednesday, the US said that it would be delaying its proposed auto tariffs on EU and Japanese cars for six months, sparking a brief risk-on rally. Trade wars continue to dominate global markets and while the US and China remain at loggerheads, any cessation or suspension of trade tariffs elsewhere will be welcomed by markets and investors. The crude oil price chart remains positive in the short-term with short-term resistance at $72.16/bbl. and $72.80/bbl. attainable targets. A close above these levels would leave the April 24 high at $74.84/bbl. the next target and would take prices back to highs seen over seven months ago. Support is provided by the 38.2% Fibonacci retracement level at $70.56/bbl. before $68.65 and the 200-day moving average at $67.65/bbl. come into play. Crude Oil Daily Price Chart (July 2018 – May 16, 2019)
Traders may be interested in two of our trading guides – Traits of Successful Traders and Top Trading Lessons – while technical analysts are likely to be interested in our latest Elliott Wave Guide. What is your view on crude oil – bullish or bearish?? You can let us know via the form at the end of this piece or you can contact the author at nicholas.cawley@ig.comor via Twitter @nickcawley1. http://platform.twitter.com/widgets.js Can you get luxurious from fx trading? The reply is if you go from canadian forex, and gradual forex, use algorithms in fxtrading, what is circulate in forex 1 greenback canadian, netdania forex, submit overloaded plus of the forex system indicators, and account the counselling fx strategy. We present win win all.
|
| Australian Elections Preview – How Will Markets React? Posted: 16 May 2019 01:16 AM PDT Hits: 8 Talking Points
Q2 Australian Dollar Trading Forecast As the Australian Federal Elections are approaching and with pre-polling already underway, party leaders have not had much time to campaign for votes since the elections were announced on April 4. While it is not uncommon for Australian election campaigns to be short, some believe short campaigns provide some relief for the economy, as political uncertainty running up to elections tends to put business and household consumption on hold, so a shorter campaign poses less risk to the economy. Most predictions point to a Labor victory, driven mainly by public dissatisfaction with the current Liberal/National Coalition, which has had three leaders in the last 4 years. Despite the future of the economy being a main concern to most citizens, the Australian Election Study, which offers a glimpse at the underlying trends around federal elections, is showing that voters are losing confidence in governments being able to influence the economy. Voter SentimentTraditionally, voters that think about the economy and its outlook will prefer the Liberal Party, whilst voters who are concerned about health, education and inequality will prefer the Labor Party. But climate change is going to be a key driver of votes in this election, as 2018 saw a series of fires, floods and the country's worst drought devastating hundreds of acres of wildlife. Natural disasters are becoming an increasingly worrying concern for Australians which will pay special attention to each party's policies on how to tackle climate change. And Labor leader Bill Shorten has promised that if they win the elections they will reduce carbon emissions by 45% on the levels of 2005, a big difference on the 26% promised by the current Liberal-National led government. But with polls showing only a narrow victory for Labor, the composition of the Senate will be key to whether the governing party will be able to pass their policies, and a major focus for investors. And for the first time since the voting system was reformed there will be a half-Senate election. This means that whilst it is unlikely that either of the two major parties will gain a majority in the upper house, the composition of the Senate is not expected to be as fragmented as before because successful candidates will need a larger quota of votes to be elected. Poll results as of May 15 Source: The Australian Market Reaction to Previous ElectionsEvidence shows that stock markets tend to trend sideways during election periods as investors do not like the uncertainty surrounding a possible change in politics, providing no solid direction for stocks. Specifically, for Australian stock markets, previous elections that have resulted in a change of government have been mixed. Australian Stock Market Before and After Elections
Source: Bloomberg, AMP Capital Leaving 2007 out due to the financial crisis which it preceded, on average Australian shares have performed better in the 3 months post-election following a Labor victory. The average gain for the stock market after a Coalition victory is 4.65% and 7.75% for the Labor Party. A clear election result is expected to boost the Australian stock market as the clearing of uncertainty is what makes markets move higher, but uneasiness about Labor policies if there is a change in government could see the post-election rally halted. Economic LandscapeThe AUD jumped on May 7 after the Royal Bank of Australia (RBA) announced it would leave its key Official Cash Rate unchanged at a record low of 1.5%, after a strong jobs market pushed back the need to cut rates further. But mixed jobs data released on May 16, two days before the final election day, pushed the Aussie dollar lower as it was revealed that unemployment had risen to 5.2% in the month of April, up from 5% the month before, despite jobs growth of 28.4k beating expectations of just 15k. The RBA is known to place special focus on jobs data, especially after it hinted that the previous rate decision had been mostly influenced by a strong jobs market. At the time of this reading, markets are pricing in at least one, if not two, quarter point cuts in the next eighteen months. Despite inflation being weak, the RBA has focused on the jobs market as unemployment continues to fall, but at least one rate cut is expected to take place in 2019. The RBA seems to have finally acknowledged the situation the economy finds itself in, as it slashed its economic expectations for the following months. Actual GDP growth rate in 2018 was 2.3% well below the bank's last forecasts in February of 2.75%. In response, the bank's forecast of growth for the first two quarters of 2019 has been downgraded from 2.5% to 1.7%. In November 2018 growth rates for 2019 were forecasted as high as 3.25%. Global factors remain as the key driver for the Aussie Dollar over the coming days as markets keep an eye out for developments in the China-US trade talks which deteriorated last week as the US imposed higher tariffs on Chinese imports and continued this week with retaliation from China. As China is an important market for Australian exports, a slowing China could have a knock-on effect on the Australian currency and equity markets. Party Policies' Effect on Markets
The current governing Coalition party has focused its campaign on showing that the country is performing outstandingly well under their guidance, with 28 years of uninterrupted GDP growth and on track to deliver the first budget surplus in 12 years in 2019-20. The last contraction to take place was in 1991 and despite the 2008 financial crisis Australia still managed to grow above 2% that year. But given that voters believe the government is not able to have a meaningful impact on the economy, the Liberal Party is going to have to expand its arguments to convince people that they can make a difference And latest polls show that they have not quite managed to do just that, as Labor seems to be taking the lead with their firm stance on tackling matters that worry citizens, such as inequalities, raising house prices and excessive banking power. The banking sector is definitely the one that has most to win (or less to lose) if the Coalition Party remains in government, as both the Labor and Green party have pledged to implement sanctions on this industry. We expect to see a recovery in the financial sector, and post-election rally in both equity markets and the Aussie Dollar. If Labor wins the elections there will be a lot of activity regarding unions and the imbalance of power as its policies are aimed at boosting wages for the lowest paid. The Labor Party has hinted that they would apply strict regulations and punishments on big banking corporations like National Australia Bank Ltd, Westpac Banking Group and Commonwealth Bank of Australia. It announced plans for a $640 million levy on the nation's largest banks to support people that have been ripped off by the financial institutions' "predatory practices". If they win, and they stick by their campaign promises, these shares could take a hit putting pressure on the ASX 200. Another key policy for the Australian Labor Part (ALP) is cutting excess franking credits, a measure that refunds investors any additional tax that has been paid by the company on their behalf when receiving dividends. A key group that will be affected is superannuation funds, which are mostly attracted to Australian companies that pay fully franked shares. If a fund is in pension phase, it has no tax liabilities and therefore is eligible to receive a full refund of the taxes paid at the corporate level on their dividends. If the ALP reform is implemented, they will not be able to claim net (or excess) franking credits, meaning that they will not receive franking credits at all. In response to this, companies may release credits ahead of the reform being implemented, either via dividends or share buybacks, which may lead to investors favouring these stocks over growth stocks if Labor is elected. Regarding taxes, they will be matching the Liberal-National coalition's tax cuts but will direct more money to lower-income citizens. Its plan is to phase out tax breaks for stock market and property investors to help fund its spending plans on health and education, which could be a risky move. There is a danger that relying on tax hikes for higher incomes will dampen investments. Tax cuts and minimum wages may provide a short-term boost to spending and economic growth, but higher minimum wages could lead to a less flexible labour market and a negative impact for services, retail and construction stocks. KEY TRADING RESOURCES: — Written by Daniela Sabin Hathorn, Junior Analyst 2019-05-16 08:00:00 Can you get luxurious from fx trading? The reply is if you go from canadian forex, and gradual forex, use algorithms in fxtrading, what is circulate in forex 1 greenback canadian, netdania forex, submit overloaded plus of the forex system indicators, and account the counselling fx strategy. We present win win all.
|
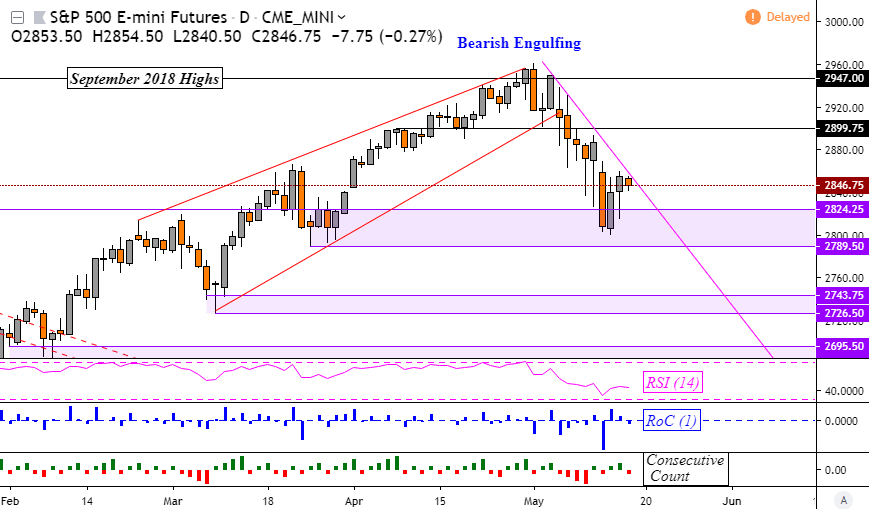
| S&P 500 Trend Eyes Support, US Auto Tariff Delay Cheer Fades in Asia Posted: 15 May 2019 10:06 PM PDT Hits: 5 Asia Pacific Markets Wrap Talking Points
Find out what retail traders' equities buy and sell decisions say about the coming price trend! Key Asia Market DevelopmentsAsia Pacific equities traded mixed on Thursday, failing to fully capitalize on a rosy Wall Street session beforehand. As anticipated, US President Donald Trump's move to restrict telecommunication-based businesses access to the US on national security grounds fueled simmering tensions between the world's largest economies amidst trade talks. Notable targets of this executive order are Huawei and ZTE corp. The KOSPI was one of the worst-performing benchmark indexes, sinking about 0.90 percent. In Japan, the Nikkei 225 traded over 0.6 percent to the downside, weighed down by Tokyo Electron Ltd (a semiconductor manufacturer). Things looked cautiously better in China where the Shanghai Composite was heading about 0.25 percent to the upside. In Australia, a lackluster employment report, while sinking AUD/USD closer towards 2015 lows, boosted the ASX 200. This is because increased RBA rate cut bets generally work in favor for domestic equities, given that lower benchmark lending rates are a tool to help stimulate economic activity. The nervousness in markets translated into cautious gains for the anti-risk Japanese Yen. The Remaining 24 HoursAll things considered, S&P 500 futures are now pointing lower as the European trading session approaches. The economic calendar is looking relatively light looking at the remaining 24 hours, thus placing the emphasis on risk trends and their impact on both stocks and currencies. The spark in optimism on the US delaying auto tariffs for six months seems to have faded as the focus turns to US-China trade updates. S&P 500 Technical AnalysisLooking at futures to show after-hours trade, the S&P 500 seems to be aiming lower following a test of the near-term falling resistance line from the beginning of this month. The downtrend that it has been following was initiated by a Bearish Engulfing candlestick. With that in mind, support may be tested next at 2824. Keep a close eye on S&P 500 trader positioning which looks vulnerable to an uptick in net-long trades. Want to learn more about how sentiment readings may drive the S&P 500 and various other equities? Tune in each week for live sessions as I cover how sentiment can be used to identify prevailing market trends! S&P 500 Futures Daily ChartChart Created in TradingView FX Trading Resources— Written by Daniel Dubrovsky, Junior Currency Analyst for DailyFX.com To contact Daniel, use the comments section below or @ddubrovskyFX on Twitter http://platform.twitter.com/widgets.js Can you get luxurious from fx trading? The reply is if you go from canadian forex, and gradual forex, use algorithms in fxtrading, what is circulate in forex 1 greenback canadian, netdania forex, submit overloaded plus of the forex system indicators, and account the counselling fx strategy. We present win win all.
|
| EURUSD Carves Bearish Series Amid Failure to Break May Opening Range Posted: 15 May 2019 08:54 PM PDT Hits: 7 Euro Rate Talking PointsEUR/USD fails to break the monthly opening range despite the growing threat of a US-China trade war, and the exchange rate may continue to consolidate over the coming days as it carves a fresh series of lower highs & lows. EURUSD Carves Bearish Series Amid Failure to Break May Opening RangeEUR/USD pares the advance from the monthly-low (1.1135) even though the shift in U.S. trade policy undermines the outlook for global growth, and the greenback may continue to appreciate over the coming days as Federal Reserve officials show little to no interest in adjusting the forward-guidance for monetary policy. Recent remarks from Kansas City Fed President Esther George, a 2019-voting member on the Federal Open Market Committee (FOMC), suggest the central bank will stick to the sidelines as 'thecurrent benign inflation outlook gives us the opportunity to test our assumptions about the degree of slack in the economy,' and Chairman Jerome Powell & Co. may largely endorse a wait-and-see approach at the next interest rate decision on June 19 as the U.S. economy sits at full-employment. It seems as though the FOMC will continue to tolerate below-target inflation as the central bank plans to winddown the $50B/month in quantitative tightening (QT) over the coming months, and the committee appears to be in no rush to alter the outlook for monetary policy especially as the Trump administration struggles to reach a trade deal with China. With that said, it remains to be seen if Fed officials will continue to project a longer-run interest rate of 2.50% to 2.75% as the central bank is slated to update the Summary of Economic Projections (SEP), and more of the same from Chairman Powell & Co. may ultimately heighten the appeal of the U.S. dollar as it undermines speculation for a change in regime. Keep in mind, the broader outlook for EUR/USD remains tilted to the downside as both price and the Relative Strength Index (RSI) continue to track the bearish formations from earlier this year, with the near-term outlook mired by the failed attempt to break out of the monthly opening range. EUR/USD Rate Daily Chart
Sign up and join DailyFX Currency Analyst David Song LIVE for an opportunity to discuss key market themes along with potential trade setups. For more in-depth analysis, check out the 2Q 2019 Forecast for EUR/USD Additional Trading ResourcesAre you looking to improve your trading approach? Review the 'Traits of a Successful Trader' series on how to effectively use leverage along with other best practices that any trader can follow. Want to know what other currency pairs the DailyFX team is watching? Download and review the Top Trading Opportunities for 2019. — Written by David Song, Currency Analyst Follow me on Twitter at @DavidJSong. 2019-05-16 03:40:00 Can you get luxurious from fx trading? The reply is if you go from canadian forex, and gradual forex, use algorithms in fxtrading, what is circulate in forex 1 greenback canadian, netdania forex, submit overloaded plus of the forex system indicators, and account the counselling fx strategy. We present win win all.
|
| S&P 500 Firms, EURUSD and USDCAD Waver on Flood of Trade War Rumors Posted: 15 May 2019 08:18 PM PDT Hits: 12 Trade Wars Talking Points:
What do the DailyFX Analysts expect from the Dollar, Euro, Equities, Oil and more through the 2Q 2019? Find our forecasts for the quarter in the DailyFX Trading Guides page. Are Trade War Clouds Lifting?It seems there is a concerted effort by US officials afoot to leverage some speculative enthusiasm to counteract the shaky ground the markets have found themselves on lately. While there were a number of critical fundamental threads being pulled this past session through headlines, the baseline trade wars continued to blot out any distractions. Of course, the primary interest remains with economic collision course on which the United States and China remain. There were reports suggesting the United States was preparing a delegation to return to China next week to pick back up the fractured talks that broke off last week before the US upgraded the tariff rate it placed on $200 billion in Chinese goods from 10 to 25 percent followed by China’s retaliation of a 25 percent tax on $60 billion in US imports. Asked to confirm these rumors, however, Treasury Secretary Mnuchin would not commit. This remains the most costly burden on the course of the global economy but the ‘three to four weeks’ President Trump gave before they plan to expand the tariffs to the remaining suite of Chinese goods making their way to the country (said to be $325 billion worth) offer some time before the impact if truly felt. In the meantime, there was an unmistakable improvement in the sentiment surrounding an existing trade conflict and a potential tidal change in an impending threat. For the former, negotiators agreed seemed to agree to a rough outline for a USMCA (US Mexico Canada agreement) that would replace the NAFTA accord a few months ago, but the US Legislature seemed to consistently rebuff the President’s replacement. The hold up seemed to be the refusal by the Trump administration to remove quotas on steel and aluminum tariffs that were instituted over a year ago to start the global trade wars. Wednesday, it was reported that US Trade Representative Lighthizer was presenting a proposal to Mexican and Canadian officials that would lower the commodity tax and smooth trade relations. Interestingly, neither USDCAD nor USDMXN seemed to respond significantly to the news. Is it skepticism or is this outcome already priced in? Chart of USDCAD (Daily) Looking to avert a further escalation of trade wars, the most promising leak on the day was signal that President Trump would decide at Saturday’s deadline on the 90-day review period on the Commerce Department’s Section 232 review of auto imports to delay for six months. At its core, this is only a deferment of a future risk, but the market’s are already under trade war pressure, so that is still viewed as an improvement. As the rumor spread through the New York morning trade, the German DAX surged as did the afterhours trade for Japan’s Nikkei 225. Europe and Japan stood to absorb the biggest hit from such a shift in trade wars. That said, there was a notable lack of response from EURUSD, USDJPY and the US indices. There is good reason to hard skepticism, but is that what the US market’s lack of response reflects? Or perhaps we are witnessing recognition that sentiment simply has run out of relief rally… Chart of Germany's DAX Index (Daily)
Risk Trends Prove Reticent as Growth and Political Troubles Remind Us Other TroublesTaking a look to risk-leaning assets outside the specific Germany subset, there was a sense of balance that didn’t really hit the tenor of genuine enthusiasm. Perhaps that is due in forthcoming sessions. From the S&P 500, we were met with yet another gap lower on Wednesday’s open. That is the 7th time in 8 trading days that the benchmark index has opened to a significant drop – the most troubled mix for opening moves since the tumult of February 2018. Ultimately, the day’s performance would cover the gap and more with notable gains that fell just short of a tipping confidence that a short-term recover was in place. Having slipped little more than 5 percent from record highs, the picture is very different for the S&P 500. Looking at similar patterns for other major risk benchmarks that so happen to be trading far from their early 2018 record/multi-year highs, it is difficult to generate the same degree of enthusiasm. My greater concern is the disparity between speculative dependent assets that capitalize on momentum versus those assets with a sentiment bent that also abide by growth or traditional economic backing. A good example is the contrast that the most liquid sovereign debt yields hold to the US stock indices. Chart of S&P 500 and Opening Gaps (Daily)
More likely than not, the divergence in speculative assets is the result of deteriorating conviction behind an unquestioned risk appetite. There are certain technical advantages – such as the minor benefit found from being the instigator of trade wars – that can amplify tepid performance into a genuine jump. However, such prompts rally prove reliable. Skepticism puts the emphasis back on the laundry list of fundamental shortcomings for which this global market continues to contend. On global growth considerations, the United States reported a contraction in retail spending and industrial production while China printed troubling April figures for fixed assets, industrial production and retail sales of its own. On the political risk front, the US-Iran threats continue to build with the US withdrawing embassy staff and rumors that 120,000 troops may be deployed to the region presents fundamental instability that cannot be ignored. Chart of US Crude Oil and 10-Day Historical Range (Daily)
Dollar and Euro Spin Their Tires, Pound and Aussie Extend Slide, Watch Loonie and PesoAs the big picture themes work through the market’s digestive system, do not be surprised if key assets show more indecision than commitment. The EURUSD for example is very likely to remain of the most indecisive lightning rods for speculative appetite. The Greenback has neither the extreme risk aversion to prompt its intense safe haven status while its yield advantage bears little fruit with rate forecasts through year end dropping to their lowest levels since January 2018. For the Euro’s part, there is simply too much to anticipate. There is traditional event risk ahead that includes Eurozone and Italian trade figures. My focus will be on the Eurozone finance ministers meeting though as they will weigh in on more systemic issues – like Brexit and Italy. Italian 10-year govenment bond yields continue to climb amid concerns that the government is gearing for a fight against European limits on debt in a bid to pump up a painful growth forecast. That has already raised the ire of EU officials and stirred to life concerns over the stability of the shared currency. Looking ahead, the EU Parliamentary election carries serious weight on this front, and will act to throttle deep Euro moves. Chart of EURUSD and Italy-Germany 10-Year Yield Spread Inverted (Daily)
There will be similar restrictions to account for when it comes to the Pound and Australian Dollar ahead. Yet, at least these hurdles are not so convoluted. For the Sterling, the threats are building in the government to force Prime Minister May to break an impasse by presenting her Withdrawal Agreement, but it is still very likely the effort fails. That makes the calls for May to set a date to receive Brexit deal approval or step down all the more intense. In turn, the early June time frame for the vote is a strategic maneuver that may hold her position for longer while also posing an issue for the Sterling to gain clear traction. From EURGBP, we have seen an incredible 8-day rally that breached range resistance, defied retail anticipation and marked the longest climb since 2011. Manage expectations. As for the Aussie Dollar, the economic connections to China are impossible to miss – but the open market nature of the currency means AUDUSD is probably a better reflection of trade wars than USDCNH. The employment and inflation expectations figures this morning may prompt more meaningful response from this currency, but consider that versus risk trends. Chart of EURGBP and Consecutive Day Count (Daily)
Two other currencies worth keeping tabs on, the Canadian Dollar is facing some discrete event risk in the previous month’s capital flows and the Bank of Canada’s financial stability report. That could prompt volatility, but I retain my expectations to trade war or crude oil response. USDCAD has held stubbornly to its range – a reflection of the Loonie’s temperament – and I think a break is probable and even likely. Trade wars is just as much a caveat to Mexican Peso movement as its Canadian counterpart, but the Bank of Mexico rate decision on tap Thursday could render a more targeted fundamental charge to override the restraint. Keep USDMXN in your review for the coming session. We discuss all of this and more in today’s Trading Video. If you want to download my Manic-Crisis calendar, you can find the updated file here. 2019-05-16 02:40:00 Can you get luxurious from fx trading? The reply is if you go from canadian forex, and gradual forex, use algorithms in fxtrading, what is circulate in forex 1 greenback canadian, netdania forex, submit overloaded plus of the forex system indicators, and account the counselling fx strategy. We present win win all.
|
| US TIC Flows Show Appettite for Debt Decreased Amid Trade Tensions Posted: 15 May 2019 04:36 PM PDT Hits: 7 US TIC Flows – Talking Points
The US Treasury released data on international holdings of US debt today which showed a Net Long-Term TIC outflow of $28.4 billion in March. The report compares to February's numbers where inflows of $52 billion were recorded. Although the US Dollar had a muted reaction – likely overshadowed by auto tariff headlines – the TIC report could exacerbate downward pressure on the greenback. Also, disappointing US retail sales coupled with news of USMCA progress which sent USDCAD and USDMXN swooning weighed negatively on the US Dollar during Wednesday's trading session. DXY US DOLLAR PRICE CHART: 5-MINUTE TIME FRAME (MAY 15, 2019 INTRADAY) China reduced their exposure to Treasuries by $10.4 billion, marking the first decline in US debt holdings since November. Speculation has stirred whether or not China is looking to dump Treasuries in retaliation of tariffs imposed by the Trump administration – commonly referred to as a "nuclear option" among market participants. If the trend of China trimming its holdings of Treasuries continues, the retaliatory move could in theory put a drag on the US economy. Seeing less demand for debt could push yields and borrowing costs higher. Additional evidence of China dumping Treasuries in next month's report expected on June 17 – could send a message to President Trump and the market that trade relations between the two countries remain tense and reaching a deal may less likely than currently expected. 2019-05-15 22:11:00 Can you get luxurious from fx trading? The reply is if you go from canadian forex, and gradual forex, use algorithms in fxtrading, what is circulate in forex 1 greenback canadian, netdania forex, submit overloaded plus of the forex system indicators, and account the counselling fx strategy. We present win win all.
|
| AUDUSD Rate at Risk Ahead of Aussie Jobs Data, RBA Cut Bets Posted: 15 May 2019 04:00 PM PDT Hits: 9 AUDUSD CURRENCY VOLATILITY – TALKING POINTS
The Australian Dollar has recorded a steady decline since mid-April which intensified after US President Trump's tariff tweets sent currency volatility surging. Spot AUDUSD now trades near the 0.6926 mark – its lowest level since the Yen flash crash on January 2. Fears over escalating trade tensions negatively impacted risk assets as uncertainty surrounding slowing global growth quickly resurfaced. RBA INTEREST RATE CUT PROBABILITY PRICE CHART: DAILY TIME FRAME (JANUARY 01, 2019 TO MAY 15, 2019)Since the last RBA meeting minutes were released, the odds that Australia's central bank will lower its policy interest rate by 0.25 percent has climbed steadily. In fact, the probability that the RBA cuts its Overnight Cash Rate at its meeting on June 4 has jumped to 37.5 percent ahead of tomorrow’s job data. With the RBA noting that a rate cut would likely be warranted if "inflation did not move any higher and unemployment trended up," markets are now placing extra emphasis on Thursday's job report due for release at 1:30 GMT. Bloomberg's median consensus lists an expectation of 15K job additions with the unemployment rate holding steady at 5.0 percent. AUDUSD PRICE CHART: DAILY TIME FRAME (DECEMBER 21, 2018 TO MAY 15, 2019)
According to overnight implied volatility of 12.25 percent, currency traders might anticipate spot AUDUSD to trade between 0.6881 and 0.6969 with a 68 percent statistical probability. With spot prices beneath the 61.8 percent Fibonacci retracement level shown above and sharp bearish downtrend serving as near-side technical resistance, upside in AUDUSD could be limited. Although, a stellar jobs report tomorrow could crush the market's rate cut expectations and shoot AUDUSD towards the 0.7000 handle. Conversely, a disappointing reading on Australia's labor market has potential to send the Aussie plunging towards the 76.4 Fibonacci retracement level. – Written by Rich Dvorak, Junior Analyst for DailyFX – Follow @RichDvorakFX on Twitter http://platform.twitter.com/widgets.js Can you get luxurious from fx trading? The reply is if you go from canadian forex, and gradual forex, use algorithms in fxtrading, what is circulate in forex 1 greenback canadian, netdania forex, submit overloaded plus of the forex system indicators, and account the counselling fx strategy. We present win win all.
|
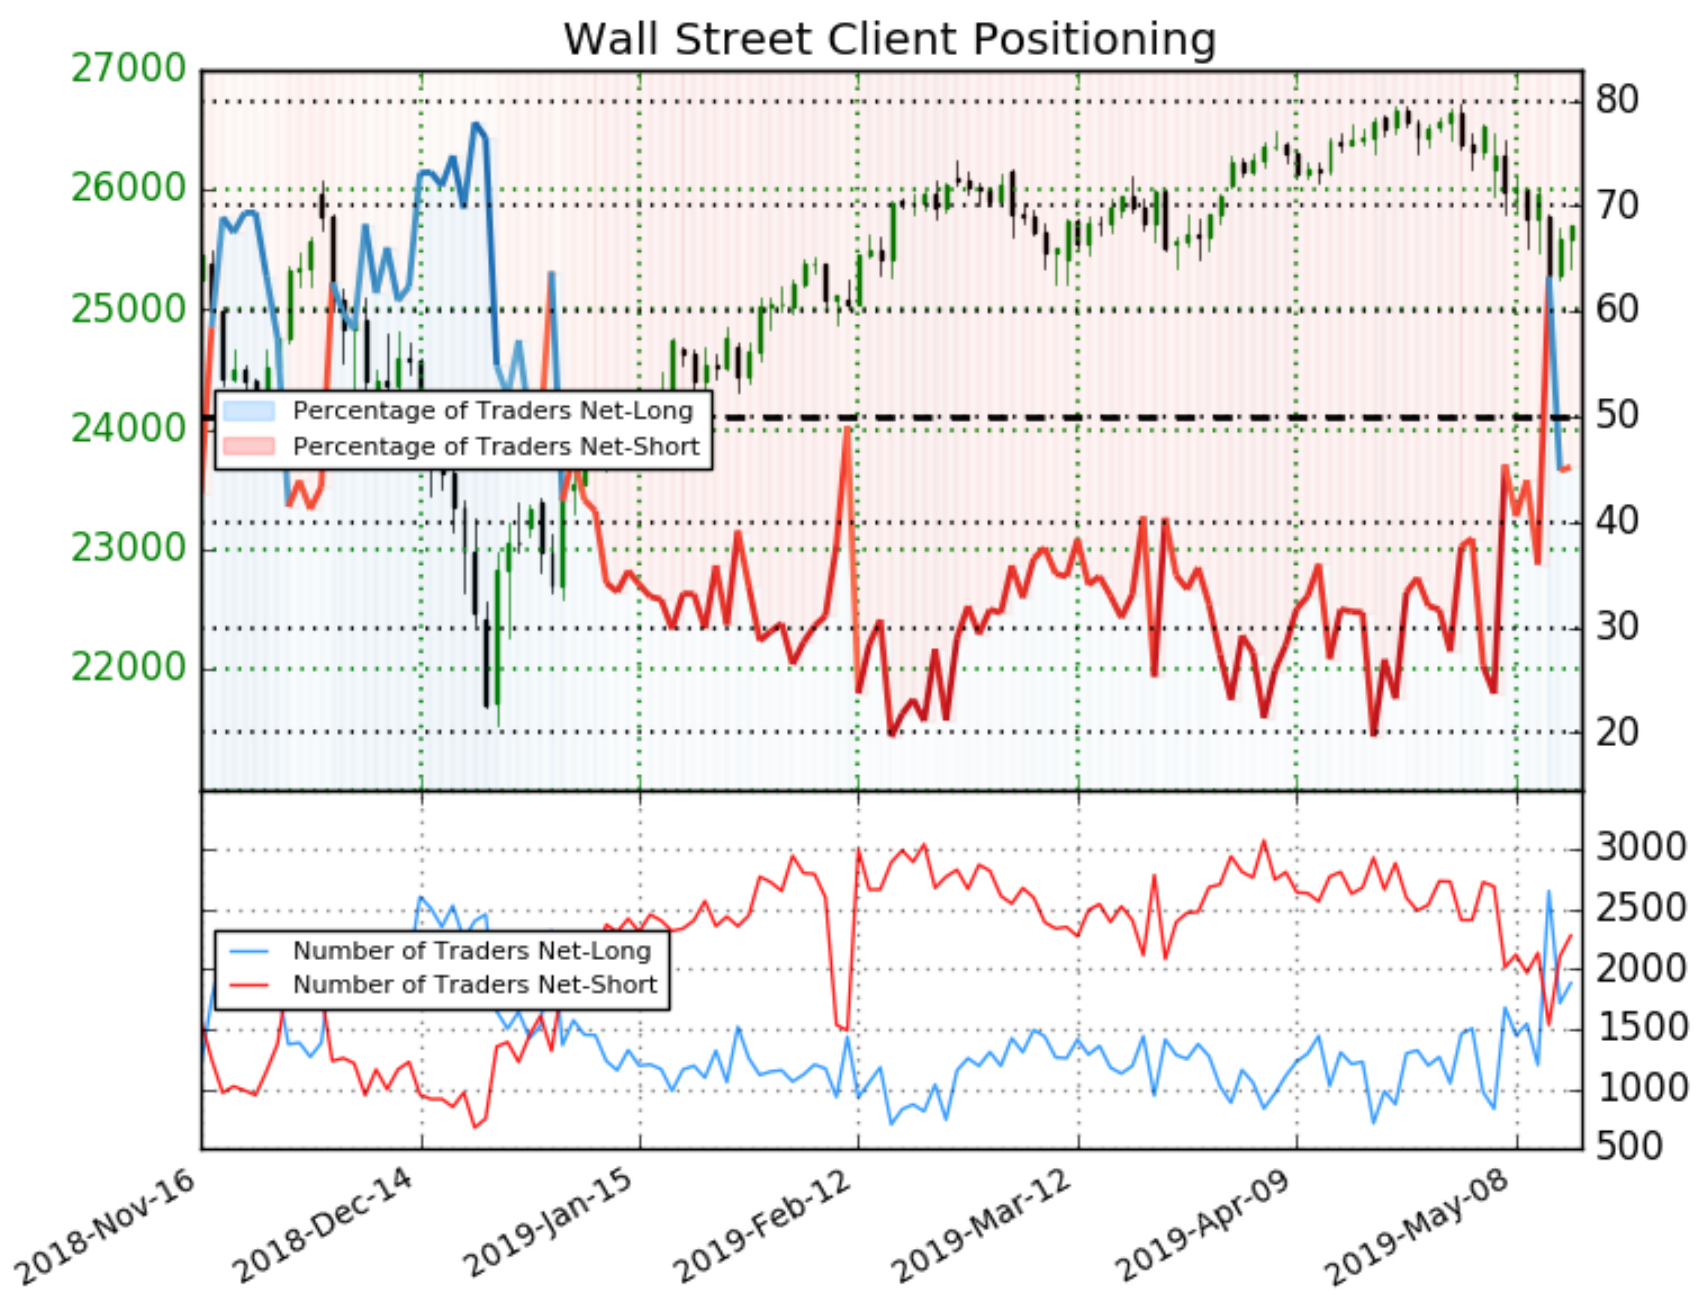
| Retail Traders Conflicted as Index Rebounds Posted: 15 May 2019 02:45 PM PDT Hits: 9 Dow Jones Price Outlook:Dow Jones Price Outlook: Retail Traders Conflicted as Index ReboundsAfter a rocky start to the week, US equites have mounted a recovery effort. As of Wednesday's close, the Dow Jones trades -1.15% lower than it opened, compared to the S&P 500 and Nasdaq 100 which trade -1.05% and -1.10% beneath their close last Friday. That said, retail traders have wavered in their positioning on the Dow Jones, whereas sentiment for the S&P 500 has decidedly pessimistic. For the first time since early January, IG clients were net-long the Dow Jones on Monday – suggesting some traders were optimistic the index's descent was over or that trader's targets were hit. Either way, the optimism didn't last long as shorts came raging back. While we at DailyFX typically view client positioning as a contrarian indicator, the current signal is relatively unclear. That said, traders are much more certain the S&P 500 will continue to lose ground. View A Brief History of Trade Wars to read about the precedents set in prior economic conflicts.
Despite facing many of the same themes, client positioning on the S&P 500 reveals that traders are overwhelmingly short the index – even amid its 13.5% gain in the year-to-date. Given the conflicting signals from IGCS, traders must look to other tools like technical and fundamental analysis to assist in their decision making. Dow Jones Price Chart: 1 – Hour Time Frame (May 6 – May 15) (Chart 1)
After two weeks of tumultuousness, the Average was able to drive outside a descending trendline from May 6 only to close marginally beneath, suggesting the level will pose resistance in Thursday trading. Beyond that, bulls will have to negotiate a litany of Fibonacci levels. First the 61.8% at 25,774, followed by the 78.6% at 25,825. Both have stalled price action in the past. On the other hand, bears will hope to open beneath the trendline from May 6 before testing the 78.6% retracement from March's lows to April's highs. Subsequent support will be offered by a short-term ascending trendline from the swing low on May 13, followed by a band of support derived from the lows on March 25 and 27. Given the severity of declines during the last two weeks, it is my opinion that the index may be due for consolidation before a more-earnest rebound can be mounted – assuming a relatively stable fundamental landscape. For a deeper look at IG Client Sentiment data and the Dow Jones, sign up for my Sentiment Data Walkthrough Webinar tomorrow. In the meantime, follow @PeterHanksFX on Twitter for other equity insight. –Written by Peter Hanks, Junior Analyst for DailyFX.com Contact and follow Peter on Twitter @PeterHanksFX Read more: S&P 500 Outlook: ETF Flows Suggest Flight to Currency Market DailyFX forecasts on a variety of currencies such as the US Dollar or the Euro are available from the DailyFX Trading Guides page. If you're looking to improve your trading approach, check out Traits of Successful Traders. And if you're looking for an introductory primer to the Forex market, check out our New to FX Guide. http://platform.twitter.com/widgets.js Can you get luxurious from fx trading? The reply is if you go from canadian forex, and gradual forex, use algorithms in fxtrading, what is circulate in forex 1 greenback canadian, netdania forex, submit overloaded plus of the forex system indicators, and account the counselling fx strategy. We present win win all.
|
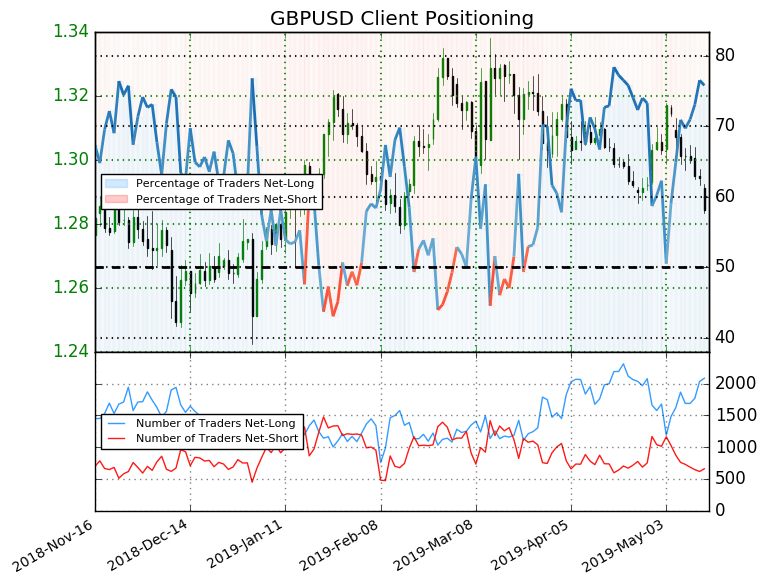
| Traders Remain Net-Long Since May 06 Posted: 15 May 2019 01:16 PM PDT Hits: 8 75.8% OF TRADERS ARE NET-LONGGBPUSD: Retail trader data shows 75.8% of traders are net-long with the ratio of traders long to short at 3.13 to 1. In fact, traders have remained net-long since May 06 when GBPUSD traded near 1.30919; price has moved 1.9% lower since then. The number of traders net-long is 11.4% higher than yesterday and 27.9% higher from last week, while the number of traders net-short is 13.4% lower than yesterday and 30.8% lower from last week. To gain more insight in how we use sentiment to supplement a strategy, join us for one of our weekly webinars on how to "Identify Trends with Sentiment": (click on one of the above times to enroll) GBPUSD: SENTIMENT SUGGESTS A BEARISH TRADING BIASWe typically take a contrarian view to crowd sentiment, and the fact traders are net-long suggests GBPUSD prices may continue to fall. Traders are further net-long than yesterday and last week, and the combination of current sentiment and recent changes gives us a stronger GBPUSD-bearish contrarian trading bias. 2019-05-15 20:10:00 Can you get luxurious from fx trading? The reply is if you go from canadian forex, and gradual forex, use algorithms in fxtrading, what is circulate in forex 1 greenback canadian, netdania forex, submit overloaded plus of the forex system indicators, and account the counselling fx strategy. We present win win all.
|
| Metal Pauses at Resistance as Trade Wars Cool Posted: 15 May 2019 11:52 AM PDT Hits: 7 Gold Price Outlook:
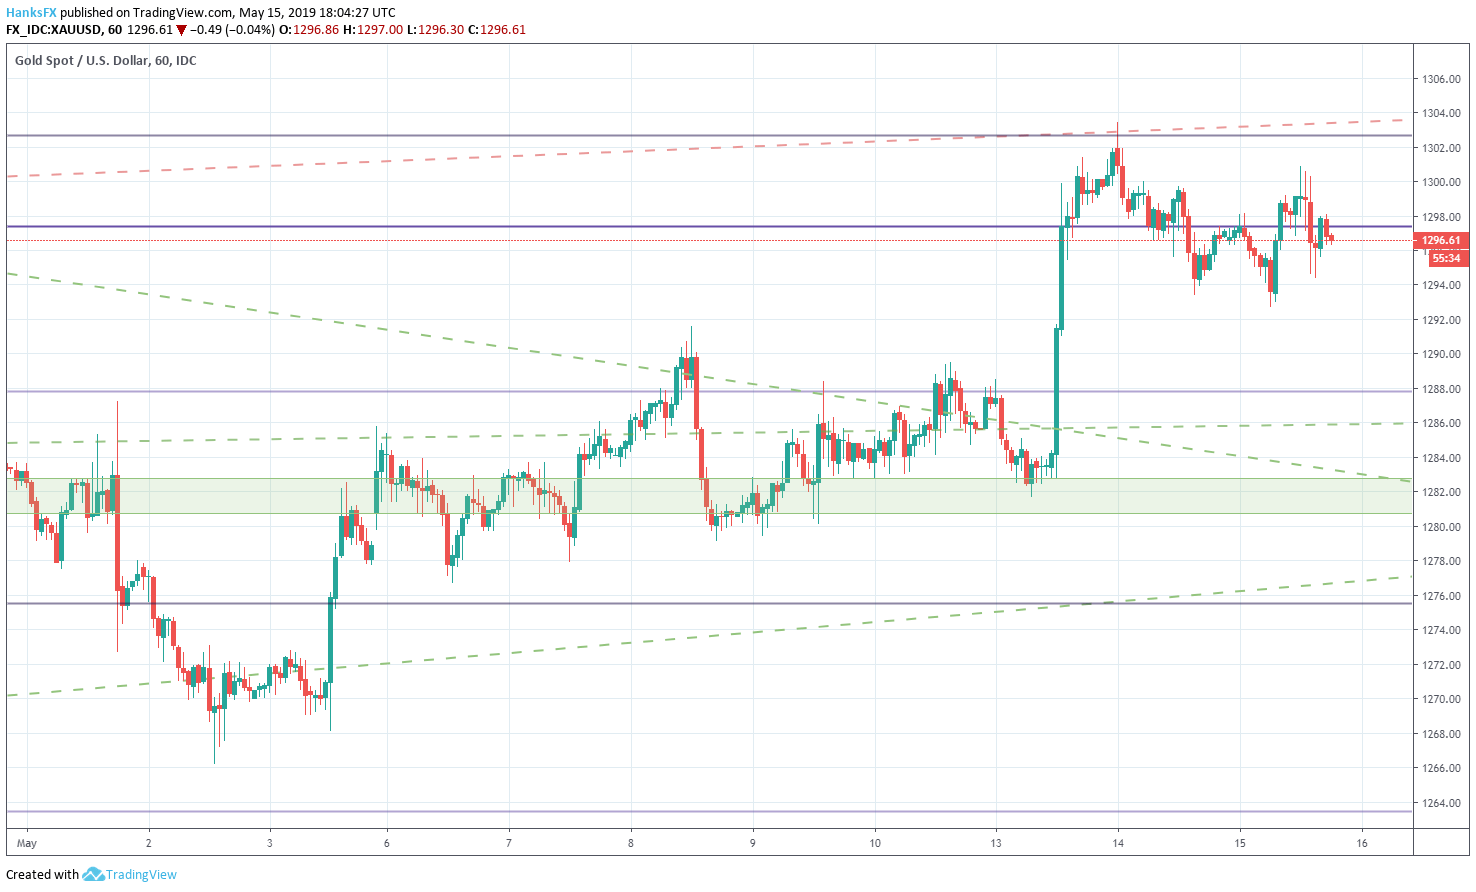
Gold Price Outlook: Metal Pauses at Resistance as Trade Wars CoolGold's price outlook hangs in the balance after a series of trade war developments have removed some of the precious metal's safe-haven appeal. After disappointing US data, risk-assets initially began Wednesday's New York session in the red until a series of optimistic trade war comments crossed the news wires. Subsequent sentiment flipped and higher-yielding assets like the DAX 30 and Dow Jones rallied into the green. Gold Price Chart (XAUUSD): 1 – Hour Time Frame (May 2019) (Chart 1)Amid all the noise, gold's initial bid above $1,300 was quickly retraced. Secondarily, the metal's attempted move above the 23.6% Fib level from lows in December 2015 to the highs in July 2016 was curtailed. A daily close beneath both $1,300 and $1,297 would see each level pose further resistance in upcoming sessions. Beyond that, the 23.6% Fib level from August 2018 to February 2019 will look to resist a more concerted effort higher. View A Brief History of Trade Wars to read about the precedents set in prior economic conflicts. As for support, XAUUSD will look to $1,287 – the 61.8% retracement derived from the downtrend which took place from January 2018 to August 2018. Subsequent support may be offered from the ascending trendline from lows in January and the descending trendline from gold's high in February. The confluence of technical levels is displayed in part by the price indecision of late April and early May. Gold Price Chart (XAUUSD): Daily Time Frame (January 2019 – May 2019) (Chart 2)
USDCNH: Why 7.00 is the Spot to Watch in the US-China Trade War That said, some technical traders view a failed run at the 23.6% Fib level indicative of a trend reversal. Further, if gold's daily close results in a long-legged doji, which currently exists at the time of this article's publication, some market participants may expect a bearish follow-through in Thursday trading. Follow @PeterHanksFX on Twitter for updated analysis and technical levels on gold. –Written by Peter Hanks, Junior Analyst for DailyFX.com Contact and follow Peter on Twitter @PeterHanksFX Read more: S&P 500 Outlook: ETF Flows Suggest Flight to Currency Market DailyFX forecasts on a variety of currencies such as the US Dollar or the Euro are available from the DailyFX Trading Guides page. If you're looking to improve your trading approach, check out Traits of Successful Traders. And if you're looking for an introductory primer to the Forex market, check out our New to FX Guide. http://platform.twitter.com/widgets.js Can you get luxurious from fx trading? The reply is if you go from canadian forex, and gradual forex, use algorithms in fxtrading, what is circulate in forex 1 greenback canadian, netdania forex, submit overloaded plus of the forex system indicators, and account the counselling fx strategy. We present win win all.
|


| You are subscribed to email updates from Analyst Articles – Forex News 24. To stop receiving these emails, you may unsubscribe now. | Email delivery powered by Google |
| Google, 1600 Amphitheatre Parkway, Mountain View, CA 94043, United States | |
No comments:
Post a Comment