
Forex analysis review |
- May 10, 2019 : EUR/USD Intraday technical analysis and trade recommendations.
- EUR/USD: US inflation did not help the dollar
- EURUSD medium-term trend technical analysis
- Short-term technical analysis of Gold for May 10, 2019
- May 10, 2019 : GBP/USD Intraday technical analysis and trade recommendations.
- What to expect from the euro and the pound?
- Bitcoin analysis for May 10, 2019 - Rising wedge in creation
- Analysis of Gold for May 10, 2019
- The euro raised its head
- Dollar ready to take off
- EUR and GBP: the German economy continues to show excellent results, which is not to say about the UK GDP
- GBP/USD: plan for the US session on May 10. The pound ignored weak data on the UK economy
- EUR/USD: plan for the US session on May 10. Euro buyers are preparing for the next jump
- GBP/USD analysis for May 10, 2019
- EUR/GBP: against the fading pound, the euro looks like a favorite
- Simplified wave analysis and forecast for Gold on May 10
- Simplified wave analysis and forecast for GBP/USD on May 10
- Simplified wave analysis and forecast for EUR/USD on May 10
- GBP/USD. May 10. Trading system "Regression Channels". The market is waiting for macroeconomic statistics from the US and
- EUR/USD. May 10. Trading system "Regression Channels". A new stage of the trade war between China and the States.
- Bitcoin. Bulls continue to push the market up
- Markets are hoping for a bargain, despite rising tariffs in the US
- Technical analysis of USD/CHF for May 10, 2019
- Euro is preparing for the second week of growth, trade conflict supports the currency
- Technical analysis of NZD/USD for May 10, 2019
| May 10, 2019 : EUR/USD Intraday technical analysis and trade recommendations. Posted: 10 May 2019 11:01 AM PDT
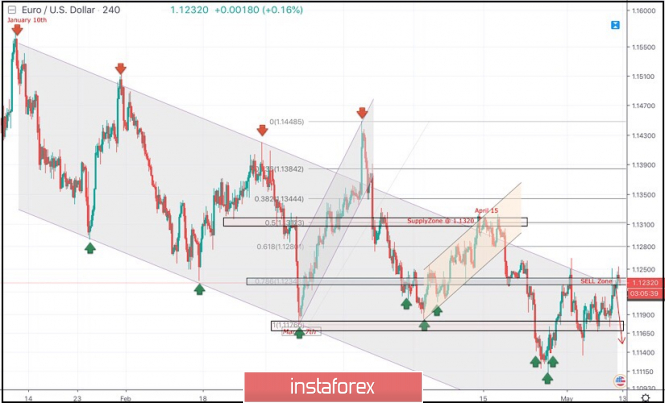
Few weeks ago, a bullish Head and Shoulders reversal pattern was demonstrated around 1.1200. This enhanced further bullish advancement towards 1.1300-1.1315 (supply zone) where significant bearish rejection was demonstrated on April 15. Short-term outlook turned to become bearish towards 1.1280 (61.8% Fibonacci) then 1.1235 (78.6% Fibonacci). For Intraday traders, the price zone around 1.1235 (78.6% Fibonacci) stood as a temporary demand area which paused the ongoing bearish momentum for a while before bearish breakdown could be executed on April 23. Currently, the price zone around 1.1235-1.1250 has turned into supply-zone to be watched for bearish rejection. On April 24-26, another bullish head and shoulders pattern was being demonstrated around 1.1140 on the H4 chart. Moreover, the market has failed to sustain bearish pressure below the price Level of 1.1175. That's why, conservative traders were suggested to wait for another bullish pullback towards 1.1230-1.1250 where a valid SELL entry can be offered. Trade recommendations : Conservative traders can look for a valid SELL entry anywhere around the price level of 1.1235-1.1250. S/L should be placed around 1.1260. Initial Target levels should be located around 1.1200, 1.1175 and 1.1140. The material has been provided by InstaForex Company - www.instaforex.com |
| EUR/USD: US inflation did not help the dollar Posted: 10 May 2019 09:07 AM PDT Growth data of American inflation could not support either the EUR/USD bulls or bears pair. Due to the lack of confident inflation growth, the market continued to get rid of the dollar by inertia, so that the price rose to the middle of the 12th figure. But the published figures can be interpreted in two ways, so it is too early to talk about the turn of the southern trend. In addition, today's growth of the pair is due to the fairly confident rhetoric of the ECB representative Hansson, who optimistically assessed the growth prospects of the European economy. Thus, the situation on the pair is uncertain, especially in the light of increasing tensions between China and the United States. But let's start with macroeconomic reports. The US consumer price index did show a controversial result. In annual terms, it rose to two percent but did not reach the projected level (2.1%). On a monthly basis, the indicator showed a negative trend – instead of the expected growth to 0.5%, the index fell to 0.3%. Core inflation also turned out to be "mixed": if on an annualized basis, the figure rose to 2.1% (as predicted by experts), then on a monthly basis, the core index unexpectedly slowed down to 0.1% (instead of the expected growth to 0.2%). If we talk about the structure of indicators, the situation is as follows. The positive inflation dynamics is primarily due to the increase in energy prices (by 2.9%) – in particular, gasoline has risen by 5.7%. But many other products have fallen in price. Thus, for the second month in a row, the cost of clothing is reduced (in April – 0.8%, in March – 1.9%), medical services fell by 0.3%, food – by 0.1%. In other words, if energy prices begin to decline, inflation will not be able to keep the pace, as the consumer activity of Americans leaves much to be desired. In particular, the most important indicator for determining inflation – the basic price index of spending on personal consumption in the US – in March slowed immediately to 1.6%, amid weak wage growth. Thus, today's figures have not shown a clear deceleration of the CPI, but have indicated an alarming trend. I believe that after this release, the White House will increase pressure on the Fed, pointing to weak inflationary results. Let me remind you that US President Donald Trump called on the Federal Reserve to reduce the interest rate by one hundred basis points. His Deputy – Vice President Mike Pence announced similar requirements, focusing on the weak inflation component of NonFarms. Commenting on the growth of wages, he said that the White House "does not see the economy inflationary processes." It is worth noting that such "wishes" (which are voiced almost in an ultimatum form) has been expressed by Trump since the summer of last year. On the one hand, the members of the regulator show firmness, demonstrating independence from the White House. But on the other hand, the Fed's position has noticeably softened over the past six months: the regulator paused the rate increase process and at least until the end of the year, pledged not to tighten the monetary policy conditions. Jerome Powell, in his rhetoric, "broke away from the team," so to speak, and expressed confidence that the decrease in inflation is due to temporary/seasonal factors. But the other members of the Fed believe otherwise: in their opinion, it is a problem of a systemic nature. Today's figures can only heighten concerns about inflationary trends. It would seem that taking into account such prospects, buyers of EUR/USD open the way to the North. But in this case, it is necessary to remember the "Chinese factor". Without waiting for the end of negotiations with China, Trump still raised duties on Chinese goods, increasing geopolitical tensions. The States accuse China of abandoning part of the agreements reached in the negotiations (in particular, it is about the reluctance to change national laws for the protection of intellectual property of companies from the United States). So far, the market is not in a hurry to react to this fact with panic, as the negotiations are still ongoing. But if next week, the anti-risk sentiment among traders will increase, the continuation of the Northern dynamics of EUR/USD can be forgotten. At the same time, it is worth noting that Friday's controversial release helped the EUR/USD bulls to gain a foothold above the resistance level of 1.1220 (the average line of the Bollinger Bands indicator). This suggests that the EUR/USD pair has the potential for its further recovery unless concerns about US-China trade relations return to the market. On the technical side, the pair is fixed above the middle line of the Bollinger Bands indicator. Also, the price is above the Tenkan-Sen and Kijun-Sen lines, which are under the Kumo cloud, thus forming a "Golden Cross" signal, which signals the increased probability of a trend change from the South to the upward one. The nearest resistance level is 1.1275 – the lower boundary of the Kumo cloud. The support is located at the base of the 12th figure, where the middle line of the Bollinger Bands coincides with the Kijun-Sen line. The material has been provided by InstaForex Company - www.instaforex.com |
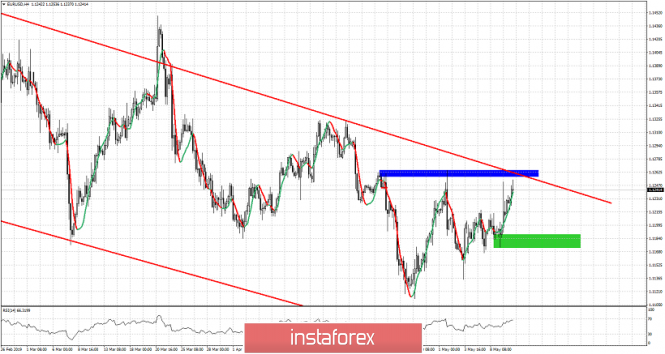
| EURUSD medium-term trend technical analysis Posted: 10 May 2019 08:51 AM PDT EURUSD is trying to break out and above the downward sloping bearish channel. Bulls are challenging the upper channel boundary around 1.1260. As long as price remains below the 1.1260 level trend will remain bearish.
Red lines - bearish channel Green rectangle -short-term support Blue rectangle - horizontal resistance EURUSD is challenging previous short-term highs and the upper channel boundary at 1.1250-1.1260. A rejection here could pull back prices towards 1.12 or lower. However a break above the resistance will open the way for a move towards 1.13-1.1350 where the big test will be. In the short-term price has an upward momentum after bottoming around 1.11. In the medium-term price remains inside a bearish channel making lower lows and lower highs. For this sequence to stop and trend to reverse to bullish, we will need to see prices break above 1.1330. The material has been provided by InstaForex Company - www.instaforex.com |
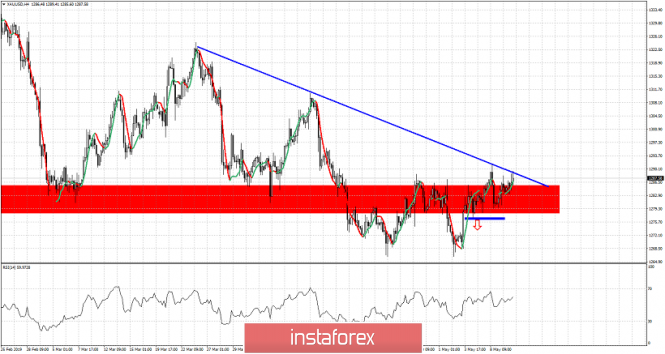
| Short-term technical analysis of Gold for May 10, 2019 Posted: 10 May 2019 08:46 AM PDT Gold price is trading at its weekly highs and above last week's highs. Gold price has found support at $1,266 and is now challenging important short-term resistance and previous top at $1,290 resistance area.
Blue line- important short-term resistance trend line Blue rectangle - short-term support Gold price is challenging the blue trend line resistance once again. A break above it will be a bullish sign. The resistance level is the recent high at $1,290 and support is found at the $1,276 area. Holding above the $1,276 level keeps hopes alive for a move above $1,300 or even to new highs above $1,350. Breaking below $1,276 opens the way for a steep decline towards $1,250-20. The material has been provided by InstaForex Company - www.instaforex.com |
| May 10, 2019 : GBP/USD Intraday technical analysis and trade recommendations. Posted: 10 May 2019 08:34 AM PDT
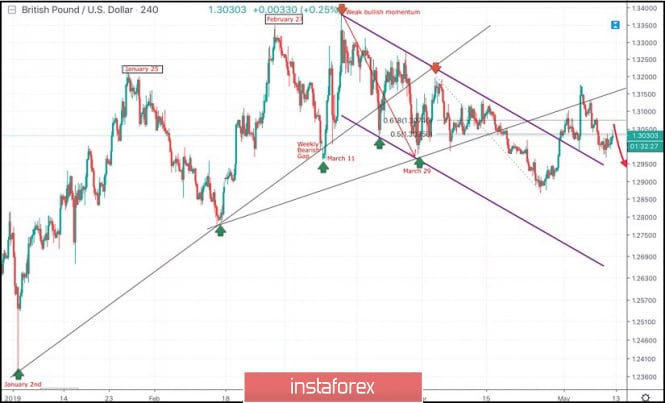
On March 29, the price levels of 1.2980 (the lower limit of the newly-established bearish movement channel) demonstrated significant bullish rejection. This brought the GBPUSD pair again towards the price zone of (1.3160-1.3180) where the upper limit of the depicted bearish channel as well as the backside of the depicted broken uptrend line demonstrated significant bearish rejection. Since then, Short-term outlook has turned into bearish with intermediate-term bearish targets projected towards 1.2900 and 1.2850. Last week, a bullish pullback was executed towards the price levels around 1.3035 - 1.3070 (50% - 61.8% Fibonacci levels) where temporary bearish rejection was demonstrated. However, by the end of Friday's consolidations, significant bullish momentum was initiated around 1.3000. Hence, a bullish breakout above 1.3075 was temporarily being demonstrated until bearish breakdown below 1.3035 (50% Fibonacci level) was achieved earlier this week. Currently, The price zone of 1.3030-1.3060 turned to become a prominent supply-zone to be watched for bearish entries. On the other hand, H4 bullish breakout above 1.3075 enhances a quick bullish visit towards 1.3150 and 1.3200 where the most recent top was established on May 3. Trade Recommendations: Conservative traders should be waiting for signs of bearish reversal around the depicted price levels (1.3035-1.3070) as a valid SELL signal. T/p levels to be located around 1.2950 and 2880. Any bullish breakout above 1.3080 invalidates this bearish scenario. The material has been provided by InstaForex Company - www.instaforex.com |
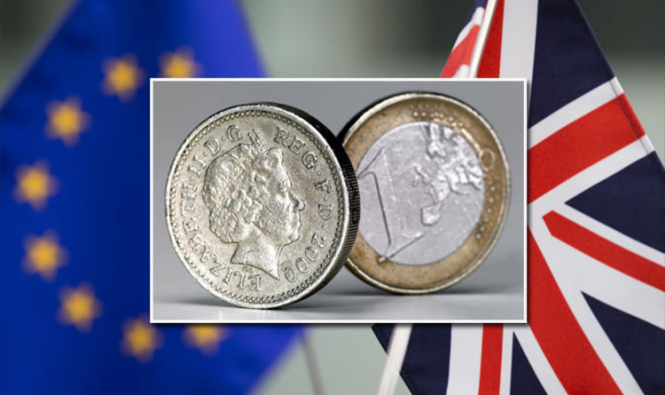
| What to expect from the euro and the pound? Posted: 10 May 2019 08:11 AM PDT
Further prospects for the single currency largely depend on the outcome of the US-China trade negotiations. The EUR/USD pair reacted weakly to Donald Trump's Sunday "tweets", the jump of the Japanese yen turned out to be moderate. It is possible that investors continue to believe in the deal between Beijing and Washington. As for the introduction of tariffs, this news brought down excessive optimism and returned traders to a balanced state. The US-China trade relationship plays an important role in the global economy, and the completion of negotiations (regardless of their outcome) will increase the volatility of the main pair. Failure will result in the escalation of a trade war. If some countries can benefit from it, Europe is definitely not included. Meanwhile, the news about the deal will support the growth of risk appetite and will be an optimistic signal for the euro bloc economy. This situation is helping to narrow the growing gap between the United States and Europe in the coming quarters. The EUR/USD pair may reach $1.16 in the third quarter and $1.18 in the fourth quarter. As for the short-term outlook, on Thursday, the quotes of the pair rose and reached the level of $1.1213 after the publication of a block of statistics from the US with negative coloration, which cast a shadow on the expected inflation rate today. However, such a rapid reaction to the data of secondary importance indicates an excessive reaction of the markets after a long flat. Currently, quotes are in a reversal range for a subsequent decline, but as Donald Trump said, no one knows how today will. About the pound Since the beginning of the week, the GBP/USD pair has lost more than a hundred points. Optimism about concluding an agreement Brexit almost dried up. British politicians are still far from compromise, the country's Prime Minister Theresa May is trying to develop a new version of the agreement. She also openly plans her own resignation as a last resort. At the EU summit, at which representatives of England were not present, the question of Brexit was not discussed. On Friday, a large block of macroeconomic statistics was published in the UK, including the first estimate of GDP growth for the first quarter. However, the expected surge in volatility did not happen, market participants are still deprived of arguments in favor of buying a pound. The pair GBP/USD moves around $1.30. The risk of resumption of the downward movement increases. At the same time, only a breakthrough and subsequent fixation of quotations under the level of $1.2970 will make it possible to seriously consider the downward trend.  |
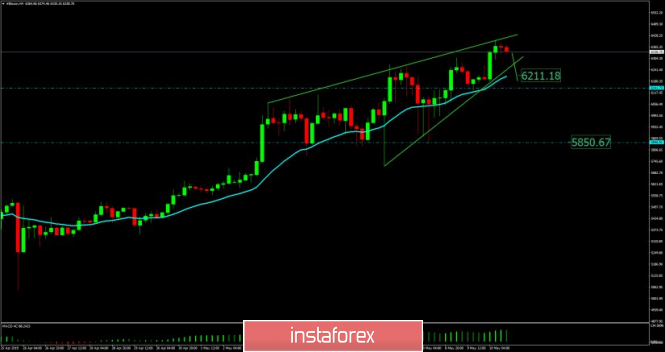
| Bitcoin analysis for May 10, 2019 - Rising wedge in creation Posted: 10 May 2019 07:25 AM PDT BTC has been trading upwards. The price tested the level of $6.400. Anyway, buying looks very dangerous and selling is preferable.
Green lines – Rising wedge in creation (bearish pattern) Blue line – 20 Exponential moving average White diagonal line – Resistance on the test Blue horizontal line – Support 1 ($6.141) Blue horizontal line – Support 2 ($5.850) Rising wedge is in creation, which may represent strong sign of the weakness on BTC. The bearish divergence is present, which adds more potential weakness on BTC. Support levels are seen at the price of $6.211 and $5.850. Resistance level is found at $6.400. Since the BTC is on the extended-up run, there are high odds that sell off might happen, so be prepared. Watch for selling opportunities with the first target at $6.211. The material has been provided by InstaForex Company - www.instaforex.com |
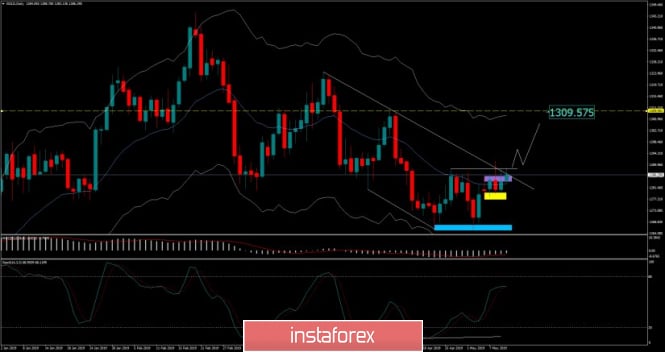
| Analysis of Gold for May 10, 2019 Posted: 10 May 2019 07:15 AM PDT Gold has been trading sideways at the price of $1.287. The intraday momentum is bullish and there is also potential for the breakout of the balance, which is positive sign for the Gold. Buying opportunities are preferable.
Purple rectangle – Resistance $1.285 White horizontal line – Resistance 2 ($1.289) White diagonal line – Resistance on the test Yellow rectangle – Support 1 ($1.277) Blue rectangle – Major support $1.265 We found that Gold is trying to breakout few resistance levels and make new push higher. The breakout of the $1.291 would confirm bullish momentum and potential test of the $1.309. The medium Keltner line has started to act like support and that is positive sign for the Gold. As long as the Gold is trading above $1.277, the trend will remain bullish. Watch for buying opportunities with the first target at $1.309. The material has been provided by InstaForex Company - www.instaforex.com |
| Posted: 10 May 2019 07:00 AM PDT While investors' attention was focused on the trade conflict between the US and China, the EUR/USD bulls took advantage of the disappointing statistics on US producer and consumer prices and returned the pair's quotes to the boundaries of the medium-term trading channel 1.12-1.15. By the end of April, CPI rose by 0.3% against the forecast of + 0.4% m/m, core inflation – by 0.1% (consensus estimate of + 0.2%). At a press conference following the FOMC meeting in May, Jerome Powell tried to convince the markets of the temporary nature of the slowdown in inflation, but if its weakness continues, the Fed will have grounds to lower the Federal funds rate. It is not good news for the US dollar. The dynamics of US inflation and the Fed rate In 2018, the trade wars caused many troubles to the single European currency. At first, investors were selling EUR/USD amid growing interest in safe-haven assets, then against the background of a slowdown in Chinese GDP. The reduction in foreign demand for German exports nearly plunged the eurozone's leading economy into recession, while rumors of an agreement to end the trade war allowed the euro to grope its feet. At first glance, the mutual exchange of blows from China and the United States in the form of increased duties should have worsened the position of the regional monetary unit. In fact, the yen is the main funding currency for carry-trade due to the low cost of borrowing in Japan and the Old World. The closing of positions by players on the difference provides support to "bulls" on EUR/USD. How long will it last? Expectations of positive statistics on Germany's GDP for the first quarter (forecast + 0.4% q/q) is able to push the quotations of the main currency pair towards resistance at 1,1265 and 1,1325 even with the failure of trade talks between Washington and Beijing. Another thing is that the success of the euro is likely to be temporary. EUR/USD will start selling on the rise on expectations of a slowdown in the economies of China and the eurozone. On the contrary, if the States and China manage to reach an agreement on the falling flag, the V-shaped recovery of China's GDP and the currency bloc will allow counting on the implementation of the consensus forecast of Bloomberg experts on the euro. At the end of this year, it is $1.18. In the event of a new round of trade wars under the influence of growing international risks and pressure from the White House, the Fed can ease monetary policy, even if inflation does not want to slow down further. In this scenario, the potential of the rally EUR/USD will increase, although it is unlikely to be long. We've all seen how the central banks and competitors responded to the Federal Reserve's worldview at the beginning of the year. I do not think that in the face of growing fears about the future of the eurozone, the ECB will sit idly by. Technically, the return of the pair's quotes within the medium-term consolidation range increases the risks of activation of the "deception-release" pattern. To do this, the "bulls" need to storm the resistance at 1.1325. As a result, they will have hope for the implementation of the subsidiary and parent model of the "Wolf Wave". The material has been provided by InstaForex Company - www.instaforex.com |
| Posted: 10 May 2019 07:00 AM PDT
According to Donald Trump, Friday will be "a very cool day." The wait is not long, the countries will converge in the second round of negotiations today. The US President reassured the markets a bit, announcing the receipt of a "beautiful" letter from Xi Jinping. Although Washington has already launched the process of raising tariffs on Chinese imports, it can cancel everything at any time. In addition, D. Trump appeared in the hands of a new trump card. The data for March showed that the trade balance deficit with China without adjustments decreased to $20.7 billion. This is the lowest value in the last 5 years. Supplies of goods to China rose by 23.6%, while imports fell by 6.1%. The owner of the White House can now safely talk about the correct impact of fees. As we remember, in July last year, the US imposed them on supplies of $50 billion from China, in September the taxable base was increased by $200 billion at a rate of 10%, from May 2019, the tariff rose to 25%. While the whole world is waiting for the story to end with the escalating conflict, the sellers of the EUR/USD pair cannot receive tangible benefits. Carry-traders close positions and go into funding currencies, including the euro. Moreover, the report on producer prices in the US for April allowed buyers to consolidate above $1.12. Investors are worried about inflation, as indicators have not reached forecasts. If inflation continues to slow, the Fed will be forced to lower rates. The inflation report is expected to be published today. The dollar will be supported by an increase in the growth rate of the indicator, and the main pair, as a result, will be under pressure. Recently, the belief in easing the Fed policy has been growing. The May poll of The Wall Street Journal showed that 51% of respondents adhere to this point of view, whereas in April it was about 44%, in March – only about 19%. Less is said about the coming recession in the US, this topic has become irrelevant. I must say that the above figures very accurately outline the problem facing the Federal Reserve. Is it necessary to reduce the rate in the conditions of rapid economic growth and sluggish inflation? Perhaps a hint should be expected from the US and China talks. If the deal is not reached and trade friction resumes with renewed strength, the dollar will receive support, but short-term. There is no need to be surprised. Later, the US currency will start losing ground due to expectations of monetary easing in the United States under the influence of growing international risks.  |
| Posted: 10 May 2019 07:00 AM PDT The euro continued to be in demand in the morning before the release of an important report on inflation in the United States. The demand was associated with data on German exports, which revived in March this year, which will support the economy in the 1st quarter of this year. Given the growth of exports in conditions of aggravation of world trade contradictions, we can safely say that the German economy will continue to maintain its leading position in the EU. According to the German Federal Bureau of Statistics, the export of goods from Germany in March 2019 increased by 1.5% compared with the previous month. Import growth was 0.4%. As a result, Germany's foreign trade surplus amounted to 20.0 billion euros, while economists expected it to reach 18.1 billion euros. Data on industrial production in France did not affect the market, since the decline was predicted by economists. According to the report, industrial production in France in March 2019 decreased by 0.9% compared with February, while a decline of 0.5% was predicted. In February, industrial production was revised to 0.1% from 0.4%. The main decline was due to a fall in manufacturing. However, as noted by a number of experts, despite the decline in March, in general, in the first quarter of 2019, the growth of industrial production in France was quite decent. As for the technical picture of the EURUSD pair, it remained unchanged. The main task of buyers of risky assets remains the protection level of 1.1215, which will keep the upward trend and will lead to an update of the highs in the area of 1.1290 and 1.1340. The return of the euro under the level of 1.1215 can quickly return to the market of large sellers, putting on a further continuation of the downward trend with the update of the minimums of 1.1130 and 1.1080. The British pound ignored the data on the slowdown in economic growth in March of this year. According to a report by the National Bureau of Statistics, UK GDP fell by 0.1% compared with February, while economists had expected GDP to remain unchanged. Compared to the 4th quarter of 2018, in the 1st quarter of this year, the UK economy showed an increase of 0.5%, which fully coincided with economists' forecasts. On an annualized basis, GDP growth in the first quarter was 2% against a growth of 0.9% in the last quarter of last year. The growth was mainly due to the fact that the companies were able to prepare for the scenario of the uncontrolled Brexit at the beginning of this year, which made it possible to show the best results. Good growth in industrial production is proof of that. According to the report, industrial production in the UK in March 2019 rose immediately by 0.7% compared with February and by 1.3% compared with the same period in 2018. Economists had forecast growth of 0.4% and 0.8%, respectively. A good contribution to the overall figure was made by manufacturing in the manufacturing industry, which in the UK increased by 0.9% in March and by 2.6% compared to the same period in 2018. Manufacturing production in the UK was forecasted at 0.5% and 1.6%, respectively. As for the technical picture of the GBPUSD pair, buyers need to form a reversal of the current downward correction that has been observed all this week. It will be possible to do this only after the return and consolidation above the resistance of 1.3030, which will make it possible to get to the larger levels of 1.3030 and 1.3230 next week. If the big bulls continue to be on the sidelines, the downward movement in the pound is likely to continue to the levels of 1.2930 and 1.2860. The material has been provided by InstaForex Company - www.instaforex.com |
| GBP/USD: plan for the US session on May 10. The pound ignored weak data on the UK economy Posted: 10 May 2019 07:00 AM PDT To open long positions on GBP/USD, you need: The pound ignored the weak data on the UK economy, which slowed in March this year. This is a good signal for buyers, but to continue growth requires a breakthrough of the resistance of 1.3020-25, which I paid attention to this morning. The breakthrough of this range will form a new, larger upward wave with a high of 1.3074 and 1.3125, where I recommend fixing the profits. In the scenario of GBP/USD decline, for example, after the release of inflation data in the US to long positions, you can look at a false breakout in the support area of 1.2971 or a rebound from the minimum of 1.2933. To open short positions on GBP/USD, you need: Bears formed a false breakdown in the resistance area of 1.3020, however, even on poor data on GDP, there was no downward movement, which is a very bad signal for sellers. The whole calculation in the second half of the day will be reduced to the data on inflation in the US, which may push the pair down to the support area of 1.2971 and 1.2933, where I recommend fixing the profits. In the growth scenario above 1.3020-25, it is best to sell after a false breakout in the resistance area of 1.3074 or a rebound from the maximum of 1.3125. Indicator signals: Moving Averages Trading is conducted in the area of 30 and 50 moving averages, which indicates the lateral nature of the market before the data. Bollinger Bands The volatility of the indicator has decreased, which does not give signals on entering the market. Description of indicators
 |
| EUR/USD: plan for the US session on May 10. Euro buyers are preparing for the next jump Posted: 10 May 2019 07:00 AM PDT To open long positions on EURUSD, you need: In the first half of the day, euro buyers held the pair before the release of important statistics on the US economy. Further movement of the euro will directly depend on it. While trading will be conducted above the range of 1.1215, one can count on the EUR/USD growth in the area of last week's maximum to 1.1260, which will maintain the upward potential with the test levels of 1.1282 and 1.1301, where I recommend fixing the profits. In the case of the euro decline in the afternoon, after a good report on inflation in the US, long positions are best returned to the rebound from a low of 1.1170, or after updating the larger support of 1.1138, where the bears will take profits. To open short positions on EURUSD, you need: Bears need to return to the level of 1.1214, which will signal the opening of short positions in the euro in order to reduce to the support of 1.1170, where I recommend fixing the profits. However, the whole emphasis of sellers will be shifted to the data on inflation in the US, which may derail EUR/USD in the area of the lows of 1.1138 and 1.1112. In the scenario of further growth of the euro, it is best to open short positions on the rebound from the maximum of 1.1260, or even higher – in the area of 1.1300. Indicator signals: Moving Averages Trading is conducted above 30 and 50 moving averages, which indicates the continuation of the upward trend in the euro. Bollinger Bands In case of a decrease, the lower limit of the indicator in the area of 1.1214 may provide temporary support. Description of indicators
 |
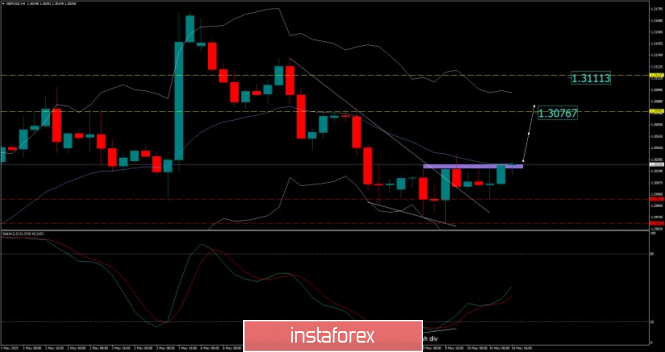
| GBP/USD analysis for May 10, 2019 Posted: 10 May 2019 06:51 AM PDT GBP/USD is trading sideways to upwards at the price of 1.3024 in past 24 hours. We still expect upside on the GBP and further strength.
Purple rectangle – Resistance 1.3024 Red horizontal line – Support 1.2991 Red horizontal line – Support 2 1.2967 We found that bullish divergence on the Stochastic oscillator on the 4H time – frame did set the bullish tone. We also found that there is broken supply trendline (white diagonal line), which is another sign of the potential strength. The GBP didn't rally for 4 days and we expect potential rally. Upward references are set: 1.3076 1.3111 Downward references: 1.2991 1.2967 Our advice is to watch for buying opportunities with the first target at 1.3076. As long as the price is trading above the 1.2967 the trend will remain bullish. The material has been provided by InstaForex Company - www.instaforex.com |
| EUR/GBP: against the fading pound, the euro looks like a favorite Posted: 10 May 2019 04:29 AM PDT Today, the pound completely ignored the published data on the growth of the British economy and the volume of industrial production. The British currency is still under the pressure of Brexit: after the last failed negotiations between Laborites and Theresa may, this issue again plunged into an atmosphere of uncertainty. In pair with the dollar, the pound balances on the border of 29 and 30 figures – but in this case, the further vector of the pair's movement will depend on the data on the growth of US inflation. Therefore, it is quite risky to "put on a slide", as the price can demonstrate the Northern dynamics due to the weakness of greenback, if the US consumer price index disappoints investors. In light of these circumstances, the EUR/GBP pair looks quite interesting. Since May 6, that is, since the beginning of this week, the EUR/GBP has been growing steadily, rising in 5 days from 0.8490 to the current level of 0.8630. The almost recoilless price growth is caused not only by Brexit – the pair is also growing due to the revaluation of the single currency, against the background of the recovery of key macroeconomic indicators of the eurozone. However, the locomotive of the Northern trend EUR/GBP are still British events. Contrary to the hopes of traders, Laborites and Conservatives failed to agree. Yesterday, the leader of the Labor Party Jeremy Corbyn actually put an end to the negotiation process. He said that the government of Theresa May has not yet voiced "constructive proposals", so further dialogue does not make practical sense. Formally, the parties did not withdraw from the negotiations – yesterday, the representative of May announced a universal phrase about the ongoing consultations. In addition, both the Conservatives and the Labor are now focused on the election campaign in the European Parliament, so until June, politicians are unlikely to take active action on Brexit. According to the latest information, Downing Street is now developing new proposals that should help to break the current impasse. What exactly is at stake, and how the new ideas will differ from those voiced earlier – is unknown. But British journalists became aware that Theresa May is not going to leave her post until at least the fall, namely until the annual party Congress of the Conservative Party. In turn, the party members of the Prime Minister cannot dismiss her, as at the end of last year she gained annual immunity against a new vote of no confidence (then the conservative opposition lost the vote). In addition, if Theresa May does not announce her intention to resign before mid-July, conservative deputies will not be able to complete the vote on candidates for party leaders before returning to Parliament in September. And judging by the rhetoric of the Prime Minister, she has no such intentions. All this suggests that in the coming months, the topic of Brexit will again take a sluggish form, while the information vacuum has a negative impact on the positions of the British currency. But the European currency still retains the potential for its growth. The latest data on eurozone GDP growth and inflation came out in the "green zone", exceeding the expectations of experts. Positive trends were recorded in Italy, France, Spain, and (especially) Germany. Representatives of the ECB have already responded to these figures. Thus, according to the head of the Estonian Central Bank Ardo Hansson, the latest results suggest that the European Central Bank has chosen the right tactics, so the regulator for the next few months will take a wait-and-see position. At the same time, he added that the economic data that will be published during this time will become a "determining factor" regarding the prospects of monetary policy. In other words, Hansson leveled the fears of traders about the return of QE – this issue is clearly irrelevant for the regulator (although the ECB Vice President Guindos did not rule out such an option). Secondly, the issue of rate hikes is still "in the sights" of the European regulator: if the Eurozone's key indicators continue to recover, the ECB may return to this issue in the first half of next year. Thus, the single currency in the EUR/GBP cross-pair looks more attractive, given the growth of the main indicators of Europe and the rhetoric of the ECB. But the pound will continue to follow Brexit, the prospects of which still look vague. In terms of technology, the situation is as follows. On the daily chart, the EUR/GBP pair is trading in the Kumo cloud of Ichimoku Kinko Hyo indicator and on the middle line of Bollinger Bands indicator. This suggests the advantage of flat movement, without a bright vector of the price direction. However, if the pair is fixed above the average line of the Bollinger Bands indicator on the D1 timeframe, there is a high probability of further growth – up to the upper limit of the Kumo cloud, which corresponds to the level of 0.8655. This level is the resistance, but the support is the price of 0.8580 – this is the lower limit of the Kumo cloud. If the price is fixed under this mark, the Northern scenario will lose its relevance. The material has been provided by InstaForex Company - www.instaforex.com |
| Simplified wave analysis and forecast for Gold on May 10 Posted: 10 May 2019 04:29 AM PDT The last wave relevant for the calculation of trading plans starts on March 25. The wave in its form is corrective. From April 23, the middle part of the structure (B) is formed in its structure. In the last 3 days, the quotes roll back down, preparing the ground for the final price breakthrough. Forecast: Today, you can expect a flat mood of oscillations, with a common downward vector. In the area of support, a reversal and the beginning of the appreciation are expected. The active phase is more likely at the end of the day or early next week. Recommendations: Sales today are high-risk and can become unprofitable. It is recommended to wait for the completion of the current rollback and monitor the emerging reversal signals to find points of purchase of gold. Resistance zones: - 1300.0 / 1305.0 Support zones: - 1280/1275.0 Explanations to the figures: Waves in the simplified wave analysis consist of 3 parts (A – B – C). The last unfinished wave is analyzed. Zones show areas with the highest probability of reversal. The arrows indicate the wave marking according to the method used by the author, the solid background is the formed structure, the dotted ones are the expected movements. Note: The wave algorithm does not take into account the duration of tool movements over time. The material has been provided by InstaForex Company - www.instaforex.com |
| Simplified wave analysis and forecast for GBP/USD on May 10 Posted: 10 May 2019 04:29 AM PDT The last short-term wave of the pound starts on March 13th. During this time, the structure formed the first 2 parts (A + B). The decline that began on May 3 gave rise to the final part (C). In the reversal model, rollback up is not enough. Forecast: The general flat mood is expected at the next trading sessions. Before the beginning of an active decline, there is a high probability of a short-term price rise, not higher than the calculated resistance zone. By the end of the day, the volatility of the instrument may increase sharply. Recommendations: Buying the pound today is possible, but we must take into account the correctional nature of the upcoming rise. It is more reasonable to refrain from trading until the appearance of sell signals in the area of the upper settlement zone. Resistance zones: - 1.3070 / 1.3100 Support zones: - 1.2970 / 1.2940 Explanations to the figures: Waves in the simplified wave analysis consist of 3 parts (A – B – C). The last unfinished wave is analyzed. Zones show areas with the highest probability of reversal. The arrows indicate the wave marking according to the method used by the author, the solid background is the formed structure, the dotted ones are the expected movements. Note: The wave algorithm does not take into account the duration of tool movements over time. The material has been provided by InstaForex Company - www.instaforex.com |
| Simplified wave analysis and forecast for EUR/USD on May 10 Posted: 10 May 2019 04:29 AM PDT In the structure of the dominant on the euro chart from March 20, the downward wave met almost all the conditions for the final breakthrough of the price down. At the end of the correctional part (B) from March 1, the conditions for the beginning of an active decline are formed. The price is in the area of the resistance zone. The price reduction that began yesterday has a high wave level, sufficient for the transition of this movement to a larger scale. Forecast: With a high probability, we can say that the preparation for the change of the intersessional trend will end today. The next session is expected to complete preparations for the reversal. The beginning of the turn down is worth the wait by the end of the day. Recommendations: In the coming sessions, euro purchases will become irrelevant. It is recommended to monitor the emerging reversal signals on the trading systems you use to search for entry into short positions. Resistance zones: - 1.1230 / 1.1260 Support zones: - 1.1090 / 1.1060 Explanations to the figures: Waves in the simplified wave analysis consist of 3 parts (A – B – C). The last unfinished wave is analyzed. Zones show areas with the highest probability of reversal. The arrows indicate the wave marking according to the method used by the author, the solid background is the formed structure, the dotted ones are the expected movements. Note: The wave algorithm does not take into account the duration of tool movements over time. The material has been provided by InstaForex Company - www.instaforex.com |
| Posted: 10 May 2019 04:29 AM PDT 4-hour timeframe Technical data: The upper linear regression channel: direction – down. The lower linear regression channel: direction – sideways. The moving average (20; smoothed) – down. CCI: -78.5633 On Friday, May 10, the British pound is trying to resume the downward movement after a small upward correction. During the last few days, the pair has been steadily falling, working out the previous growth, which was based on expectations and rumors. Since these rumors did not come true, and the British government did not come closer to resolving the situation with Brexit, the pound quite logically resumed the downward movement. Today, the UK will publish the GDP for March, the preliminary value of GDP for the first quarter, and industrial production for March. In the United States, inflation will be released today. All these reports are quite important and can potentially have a strong impact on the movement of the pair. The question is, in whose favor will the news be? The forecasts for Britain's GDP are not bad, but inflation in the US, according to experts, will accelerate. From a technical point of view, a downward movement is more preferable. With fundamental – too. Thus, the reversal of the Heiken Ashi indicator down may signal about the resumption of the downward movement. However, at the time of publication of the above macroeconomic reports, it is recommended to be more cautious and to use stop-loss orders, as sharp price reversals are possible. Nearest support levels: S1 – 1.3000 S2 – 1.2939 S3 – 1.2878 Nearest resistance levels: R1 – 1.3062 R2 – 1.3123 R3 – 1.3184 Trading recommendations: The GBP/USD pair has overcome the moving. Thus, the trend for the instrument has changed to a downward trend and short positions with the goals of 1.3000 and 1.2939 have become relevant, the first of which has already been worked out. The reversal of the Heiken Ashi down will indicate the completion of the correction. Buy-positions are recommended to be considered only after the pair is reversed above the moving average with the goals of 1.3062 and 1.3123. In addition to the technical picture should also take into account the fundamental data and the time of their release. Explanation of illustrations: The upper linear regression channel – blue line the unidirectional movement. The lower linear regression channel – purple line the unidirectional movement. CCI – the blue line in the indicator regression window. The moving average (20; smoothed) is the blue line on the price chart. Murray levels – multi-colored horizontal stripes. Heiken Ashi is an indicator that colors bars in blue or purple. The material has been provided by InstaForex Company - www.instaforex.com |
| Posted: 10 May 2019 04:29 AM PDT 4-hour timeframe Technical data: The upper linear regression channel: direction – down. The lower linear regression channel: direction – down. The moving average (20; smoothed) – sideways. CCI: 49.1622 The EUR/USD pair tried to get out of the outright flat yesterday, but it failed to gain a foothold above the Murray level of "0/8" - 1.1230. So, bulls have no special advantage now. We cannot even say that the pair is now inclined to strengthen, since the previous local maximum has not been overcome, both channels of linear regression are directed downwards. Jerome Powell, whose speech took place yesterday, did not touch upon the topic of monetary policy. Accordingly, traders were deprived of any new macroeconomic information. On the last trading day of the week, the publication of the consumer price index in America for April is planned. Inflation is expected to accelerate to 2.1% year-on-year, above the previous value. Accordingly, the US dollar may receive support today, however, as we said earlier, the current price levels of the pair are quite unattractive for new sales. Traders are obviously cautious with them, so there may be no reaction to a strong inflation report. If the real value is lower than the forecast, the euro may get support. We also remind you that today, the States should increase duties on Chinese imports. Negotiations between the countries should also take place today. Nearest support levels: S1 – 1.1169 S2 – 1.1108 Nearest resistance levels: R1 – 1.1230 R2 – 1.1292 R3 – 1.1353 Trading recommendations: The EUR/USD currency pair made a breakthrough, but it is difficult to state the formation of a new upward trend. If the pair manages to overcome the level of 1.1230, it will be a signal to cautious purchases with the target at 1.1292. It is recommended to consider selling orders for the pair not earlier than consolidating below the Murray level of "-1/8" - 1.1169 with the aim of 1.1108. In addition to the technical picture should also take into account the fundamental data and the time of their release. Explanation of illustrations: The upper linear regression channel – blue line unidirectional movement. The lower linear regression channel – purple line unidirectional movement. CCI – the blue line in the indicator window. The moving average (20; smoothed) is the blue line on the price chart. Murray levels – multi-colored horizontal stripes. Heiken Ashi is an indicator that colors bars in blue or purple. The material has been provided by InstaForex Company - www.instaforex.com |
| Bitcoin. Bulls continue to push the market up Posted: 10 May 2019 04:29 AM PDT The Bitcoin exchange rate has confidently approached the important resistance level of 6400, the breakdown of which may occur in the near future. Signal to buy Bitcoin (BTC): Today, the buyers of Bitcoin are counting on a breakthrough of the resistance of 6360, which will lead the cryptocurrency to a new maximum of 6520, where I recommend fixing the profits since after updating these resistances, a strong bearish divergence can be formed on the MACD indicator. In the scenario of reducing the cryptocurrency, you can return to purchases on the support test of 6070 or a rebound from the minimum of 5777. Signal to sell Bitcoin (BTC): Only the formation of a false breakdown at a maximum of 6360 will be the first signal to sell Bitcoin in order to return and update the support of 6070 and with an exit to a minimum of 5777, where I recommend fixing the profits. With further growth along with the trend, it is best to consider selling for a rebound in the region of the maximum of 6520.  |
| Markets are hoping for a bargain, despite rising tariffs in the US Posted: 10 May 2019 03:32 AM PDT Chinese stocks fell in price, and the yuan strengthened, as investors believe that Beijing and Washington will be able to save a bargain, despite rising tariffs in the United States, which sharply aggravated relations. Traders also expect Beijing to announce tighter monetary policies and support measures if the US decision adds pressure to the Chinese economy. "The fact that both sides agreed to continue negotiations on Friday gives us hope that relations between the two powers have not deteriorated and are to be restored," said Jasper Lawler, head of research at London Capital Group. China's major stock indexes finished trading growth of more than 3%, recovering sharply after the fall, when the new tariffs came into force. There is a version that the reason for the escalation of the conflict between the United States and China was the data showing that China's economy has begun to show signs of stabilization due to the flow of growth-stimulating measures. The market had several days to consider this scenario, and it partially took into account the increase in tariffs from 10 to 25 percent. Given that negotiations are continuing, all attention is focused on the question, will there be positive news at the weekend, after the talks in Washington? In addition, China is likely to have some incentives in the event of a failure of negotiations. The Chinese yuan ended the trading session with an increase of 0.2%, to 6.8118 yuan per dollar, but still lost 1.13% over the week. On Thursday, the currency broke through the key level of support at 6.8 for the first time since the end of January. On Friday, the yuan strengthened, despite the fact that the Central Bank of China set the average daily trading bar at its weakest level in 3.5 months. Offshore yuan was a volatile day. In general, while negotiations continue, there is hope. As for the yuan, the recovery will not be sustainable: most likely, the yuan will be in the range of 6.75 to 6.9 yuan per dollar. The material has been provided by InstaForex Company - www.instaforex.com |
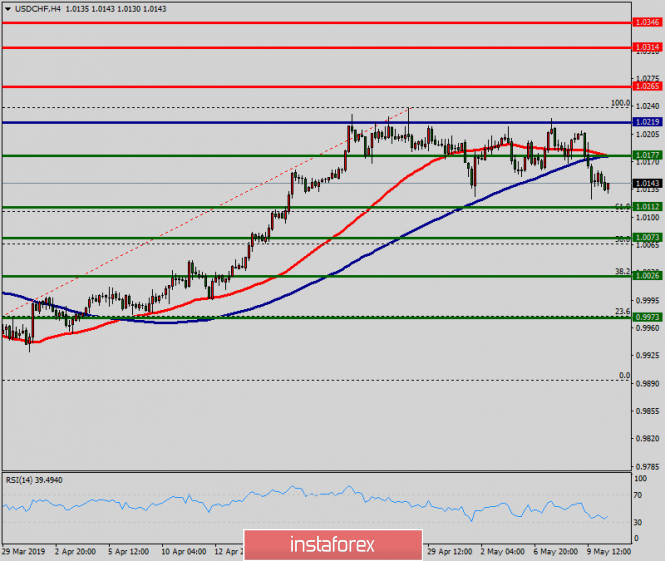
| Technical analysis of USD/CHF for May 10, 2019 Posted: 10 May 2019 03:10 AM PDT Overview: The USD/CHF pair continues moving in a bullish trend from the support levels of 1.0123 and 1.0177. Currently, the price is in an upward channel. This is confirmed by the RSI indicator signaling that the pair is still in a bullish trend. As the price is still above the moving average (100), immediate support is seen at 1.0177. Consequently, the first support is set at the level of 1.0177. So, the market is likely to show signs of a bullish trend around 1.0177. In other words, buy orders are recommended above the level of 1.0177 with the first target at the level of 1.0265. Furthermore, if the trend is able to breakout through the first resistance level of 1.0265, we should see the pair climbing towards the point of 1.0314. However, it would also be wise to consider where to place a stop loss; this should be set below the second support of 1.0123. The material has been provided by InstaForex Company - www.instaforex.com |
| Euro is preparing for the second week of growth, trade conflict supports the currency Posted: 10 May 2019 03:06 AM PDT The unexpected increase in tariffs on Chinese imports has radically changed the near future of the euro. The currency is preparing to grow for the second week in a row amid concerns that any escalation of the trade conflict between the United States and China will force the Fed to lower interest rates. D. Trump raised tariffs from 10% to 25%, and Beijing said it would strike back. Both sides are conducting the final round of negotiations in an attempt to save a bargain. Investors, meanwhile, believe that the conflict will inevitably lead to a decrease in the interest rate in the United States. Before that, the markets were betting on one rate increase by the end of 2019. China's counter-measures, although not as large-scale, will still affect the prospects for the US economy and increase the chances of a Fed rate cut, especially since the Fed now has more opportunities to soften policies than most other central banks, and this will ultimately lead to depreciation of the dollar against the euro and the yen. The single European currency rose by 0.1%, to 1.1220 dollars, and has been growing for the second week in a row. Overall, the risk appetite was muted, although some of the high-yielding currencies, such as the Australian dollar, which fell at the beginning of this week, rose after D. Trump's statement. So far, trading tensions have little effect on currency markets: asylum assets, such as the Japanese yen, added only 1.2% this week, and volatility indicators on the currency market were suppressed, despite a slight rebound. The material has been provided by InstaForex Company - www.instaforex.com |
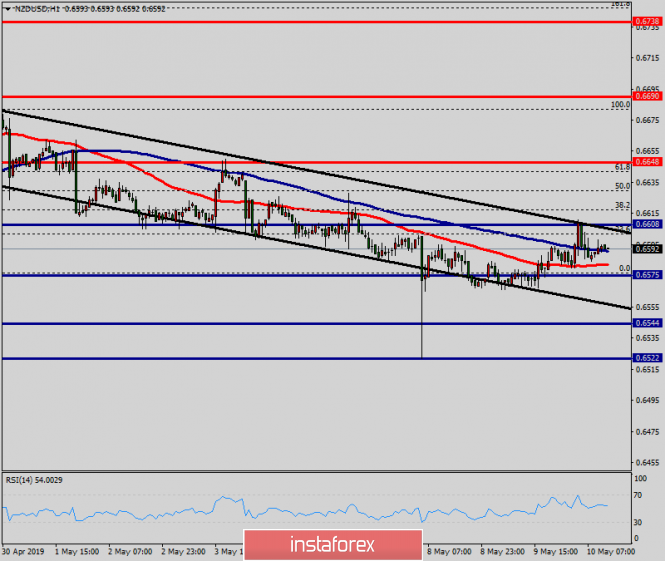
| Technical analysis of NZD/USD for May 10, 2019 Posted: 10 May 2019 03:05 AM PDT Overview: The NZD/USD pair is showing signs of weakness following a breakout of the lowest level of 0.6648. On the H1 chart, the level of 0.6648 coincides with 23.6% of Fibonacci, which is expected to act as minor support today. Since the trend is below the 23.6% Fibonacci level, the market is still in a downtrend. However, the major resistance is seen at the level of 0.6690. Furthermore, the trend is still showing strength above the moving average (100). Thus, the market is indicating a bearish opportunity below the above-mentioned support levels, for that the bearish outlook remains the same as long as the 100 EMA is headed to the downside. Therefore, strong resistance will be found at the level of 0.6690 providing a clear signal to buy with a target seen at 0.6575. If the trend breaks the minor resistance at 0.6575, the pair is likely to move downwards continuing the bearish trend development to the level 0.6544. The material has been provided by InstaForex Company - www.instaforex.com |












| You are subscribed to email updates from Forex analysis review. To stop receiving these emails, you may unsubscribe now. | Email delivery powered by Google |
| Google, 1600 Amphitheatre Parkway, Mountain View, CA 94043, United States | |

No comments:
Post a Comment