
Forex analysis review |
- Fractal analysis of major currency pairs for May 14
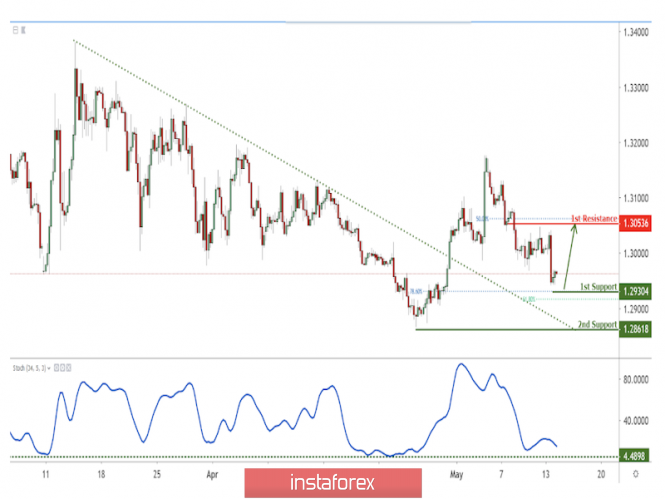
- GBP/USD approaching support, potential bounce!
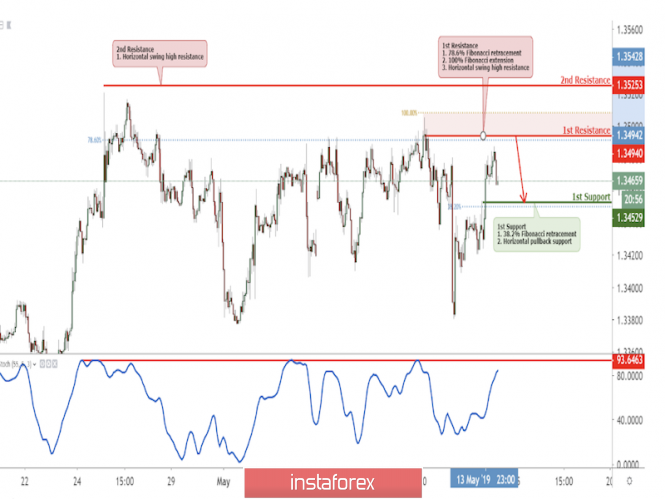
- USD/CAD approaching its resistance where we expect to see a reversal!
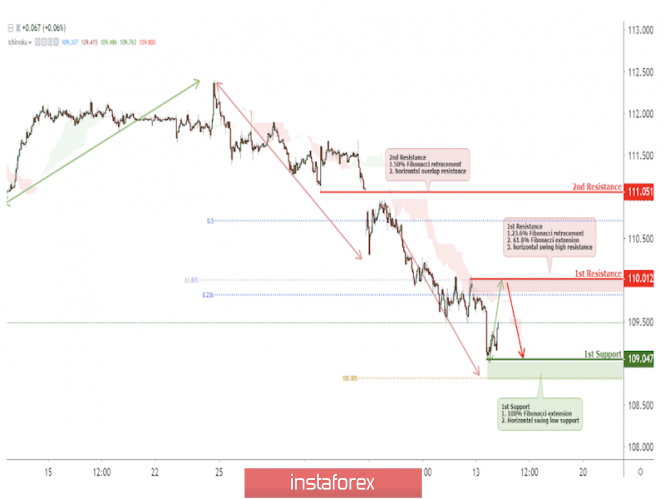
- USD/JPY near key resistance, a drop is possible!
- GBP / USD h4. Options for the development of the movement from May 14, 2019. Analysis of APLs & ZUP
- EUR / USD h4. Options for the development of the movement from May 14, 2019. Analysis of APLs & ZUP
- EURUSD and GBPUSD are neutral: the markets are waiting for clarity on the US-China trade negotiations
- EURUSD: Negotiations between the US and China have not brought results. US inflation leaves many questions
- EUR/USD: Euro maintains growth potential. Preview of the trading week
- USD/JPY: Is it possible to return to 111?
- EUR/USD: US and EU trade dispute may be revived
- Oil prices are going up steadily and are approaching $72 a barrel
- Hedge funds are betting on the dollar's growth
- Yen goes to the call of trade wars
- EUR/USD. May 13. Results of the day. The euro continues to strengthen slowly against the US dollar
- GBP/USD. May 13. Results of the day. Trump gives an ultimatum to China
- Minute dollar drop: what was it?
- May 13, 2019 : EUR/USD Intraday technical analysis and trade recommendations.
- EURUSD remains inside medium-term bearish channel
- Gold breaking to new short-term highs challenging $1,300 pivot point
- May 13, 2019 : GBP/USD Intraday technical analysis and trade recommendations.
- Bitcoin analysis for May 13, 2019
- Analysis of Gold for May 13, 2019
- GBP/USD analysis for May 13, 2019
- Technical analysis of NZD/USD for May 13, 2019
| Fractal analysis of major currency pairs for May 14 Posted: 13 May 2019 07:48 PM PDT Forecast for May 14: Analytical review of H1-scale currency pairs: For the euro / dollar pair, the key levels on the H1 scale are: 1.1317, 1.1300, 1.1271, 1.1256, 1.1222, 1.1206 and 1.1184. Here, we continue to monitor the local structure for the top of May 3rd. Short-term upward movement is expected in the range of 1.1256 - 1.1271. The breakdown of the last value should be accompanied by a pronounced upward movement. Here, the target level is 1.1300. We consider the level of 1.1317 to be a potential value for the top. Upon reaching this level, we expect consolidation, as well as a rollback to the bottom. Short-term downward movement is possible in the range of 1.1222 - 1.1206. The breakdown of the latter value will lead to a prolonged correction. Here, the target level is 1.1184. This level is a key support for the top. The main trend is a local ascending structure of May 3rd. Trading recommendations: Buy 1.1256 Take profit: 1.1270 Buy 1.1272 Take profit: 1.1300 Sell: 1.1222 Take profit: 1.1206 Sell: 1.1204 Take profit: 1.1186 For the pound / dollar pair, the key levels on the H1 scale are: 1.3045, 1.3005, 1.2981, 1.2946, 1.2927, 1.2882 and 1.2845. Here, we continue to follow the development of the downward structure from May 3. The continuation of the movement to the bottom is expected after the passage the price of the noise range 1.2946 - 1.2927. In this case, the goal is 1.2882, wherein consolidation is near this level. For the potential value for the bottom, we consider the level of 1.2845. After reaching which, we expect a rollback to the top. Short-term upward movement is possible in the range of 1.2981 - 1.3005. Breaking the last value will lead to a prolonged correction. Here, the target level is 1.3045. This level is a key support for the downward structure. The main trend is the downward cycle of May 3rd. Trading recommendations: Buy: 1.2981 Take profit: 1.3004 Buy: 1.3007 Take profit: 1.3045 Sell: 1.2925 Take profit: 1.2884 Sell: 1.2880 Take profit: 1.2847 For the dollar / franc pair, the key levels on the H1 scale are: 1.0124, 1.0095, 1.0075, 1.0045, 1.0017 and 0.9981. Here, we are following the development of the downward structure of May 7th. For the continuation of the movement to the bottom, we expect after the breakdown of the level of 1.0017. In this case, the goal is 0.9981. Upon reaching this level, we expect a rollback to the top. Short-term upward movement is possible in the range of 1.0075 - 1.0095. The breakdown of the latter value will lead to a prolonged movement. Here, the target level is 1.0124. This level is a key support for the downward structure. The main trend is the downward structure of May 7. Trading recommendations: Buy : 1.0075 Take profit: 1.0093 Buy : 1.0097 Take profit: 1.0124 Sell: 1.0045 Take profit: 1.0017 Sell: 1.0015 Take profit: 0.9988 For the dollar / yen pair, the key levels on the scale are : 110.17, 109.92, 109.70, 109.46, 109.01, 108.77 and 108.30. Here, we are following the local downward structure of May 3rd. Short-term downward movement is expected in the range of 109.01 - 108.77. The breakdown of the last value will allow to expect movement towards the potential target - 108.30, after reaching which, we expect a rollback to the top. Short-term uptrend is possible in the range of 109.46 - 109.70. The breakdown of the latter value will lead to a prolonged correction. Here, the target level is 109.92. This level is a key support for the downward structure of May 3. Its price will have the formation of the initial conditions for the upward cycle. In this case, the potential target is the level of 110.17. The main trend: a local downward structure of May 3. Trading recommendations: Buy: 109.48 Take profit: 109.70 Buy: 109.72 Take profit: 109.90 Sell: 109.00 Take profit: 108.80 Sell: 108.75 Take profit: 108.36 For the Canadian dollar / US dollar pair, the key levels on the H1 scale are: 1.3568, 1.3526, 1.3511, 1.3493, 1.3451, 1.3434, 1.3415 and 1.3378. Here, we are following the formation of the ascending structure of May 10. Continuation of the movement to the top is expected after the breakdown of the level of 1.3493. In this case, the target level is 1.3511, wherein consolidation is near this level. The price pass of the noise range 1.3511 - 1.3526 should be accompanied by a pronounced upward movement to the potential target - 1.3568. From this level, we expect a rollback to the bottom. Short-term downward movement is possible in the range of 1.3451 - 1.3434. The breakdown of the latter value will lead to a prolonged correction. Here, the target level is 1.3415. This level is a key support for the top. The main trend is the formation of the ascending structure of May 10. Trading recommendations: Buy: 1.3493 Take profit: 1.3510 Buy : 1.3526 Take profit: 1.3566 Sell: 1.3450 Take profit: 1.3436 Sell: 1.3433 Take profit: 1.3417 For the Australian dollar / US dollar pair, the key levels on the H1 scale are : 0.6986, 0.6968, 0.6959, 0.6937, 0.6928, 0.6916 and 0.6894. Here, we are following the development of the downward structure of May 7th. Short-term downward movement is expected in the range of 0.6937 - 0.6928. The breakdown of the latter value will lead to the movement to the level of 0.6916, near which, we expect a consolidation. For the potential value for the downward trend, we consider the level of 0.6894. Upon reaching this level, we expect a departure to the correction. Short-term upward movement is possible in the range of 0.6959 - 0.6968. The breakdown of the latter value will have to form an upward structure. In this case, the potential target is the level of 0.6986. The main trend is the downward structure of May 7. Trading recommendations: Buy: 0.6960 Take profit: 0.6968 Buy: 0.6970 Take profit: 0.6984 Sell : 0.6936 Take profit : 0.6928 Sell: 0.6926 Take profit: 0.6916 For the euro / yen pair, the key levels on the H1 scale are: 123.93, 123.59, 123.26, 123.05, 122.50, 122.32 and 121.92. Here, the subsequent targets for the downward movement we determined from the local structure on May 10. Continuation of the movement to the bottom is expected after the price passes the noise range 122.50 - 122.32. In this case, the first potential target is the level of 121.92. Short-term upward movement is expected in the range of 123.05 - 123.26. The breakdown of the last value will have to form an upward structure. In this case, the first target is 123.59. We consider the level of 123.93 to be a potential value for the top, to which we expect the registration of the expressed initial conditions. The main trend is the local downward structure of May 10. Trading recommendations: Buy: 123.05 Take profit: 123.24 Buy: 123.28 Take profit: 123.59 Sell: 122.30 Take profit: 121.94 For the pound / yen pair, the key levels on the H1 scale are : 143.36, 142.85, 142.18, 141.24, 140.86 and 139.88. Here, the price is near the limit values for the downward structure, and therefore, we expect a correction to depart, after the breakdown of the level of 142.18. In this case, the target level is 142.85. For the potential value for the top, we consider the level of 143.36, to which, we expect the registration of the expressed initial conditions. Short-term downward movement is possible in the range of 141.24-140.86. The breakdown of the latter value should be accompanied by an unstable downward movement. Here, the potential target is the level of 139.88, however, it is necessary to take into account the high probability of a premature price reversal to the correction area. The main trend is the downward cycle of May 3, we expect to go into a correction. Trading recommendations: Buy: 142.20 Take profit: 142.85 Buy: 142.87 Take profit: 143.30 Sell: 141.24 Take profit: 140.88 Sell: 140.82 Take profit: 139.90 The material has been provided by InstaForex Company - www.instaforex.com |
| GBP/USD approaching support, potential bounce! Posted: 13 May 2019 07:08 PM PDT
Price is approaching support where we are expecting a bounce above this level. Entry : 1.2930 Why it's good : 78.6% Fibonacci retracement, 61.8% Fibonacci extension Stop Loss : 1.2861 Why it's good : horizontal swing low support Take Profit : 1.3053 Why it's good : horizontal overlap resistance, 50% Fibonacci retracement
|
| USD/CAD approaching its resistance where we expect to see a reversal! Posted: 13 May 2019 07:05 PM PDT Price is approaching a key resistance at 1.3494 where it could potentially reverse to its resistance at 1.3452. Entry : 1.3494 Why it's good : horizontal swing high resistance, 78.6% Fibonacci retracement, 100% Fibonacci extension Stop Loss : 1.3525 Why it's good : horizontal swing high resistance Take Profit : 1.3452 Why it's good : 38.2% Fibonacci retracement, horizontal pullback support
|
| USD/JPY near key resistance, a drop is possible! Posted: 13 May 2019 07:02 PM PDT
USDJPY near key resistance, a drop to 1st support is possible Entry:110.012 Why it's good :61.8% Fibonacci extension, 23.6% Fibonacci retracement, horizontal swing high resistance Stop Loss : 110.934 Why it's good :50% fibonacci retracement, horizontal overlap resistance Take Profit : 109.047 Why it's good: 100% Fibonacci extension, horizontal swing low support
|
| Posted: 13 May 2019 05:22 PM PDT Minute (h4) Great Britain Pound vs US Dollar Previous review from 08/05/2019 22:09 UTC + 2. ____________________ The currency movement of her Majesty's GBP / USD from May 14, 2019 will be determined by developing the boundaries of the zone of the equilibrium (1.2980 <-> 1.2930 <-> 1.2885) fork operational scale Minuette. The layout of movement options within the Minuette equilibrium zone is shown in the animated graphic. ____________________ Prospects for the development of the downward movement (sell) The breakdown of the support level 1.2885 (lower limit of ISL61.8 equilibrium zone of the forked operating scale Minuette) -> continuation of the downward movement of GBP / USD towards targets -> local minimum 1.2865 <-> warning line LWL38.2 (1.2840) of the operating scale fork Minuette <-> minimum 1.2772. Details look at the animated graphics. ____________________ Prospects for the development of the upward movement (buy) The breakdown of the resistance level1.2980 (upper limit of the ISL38.2 equilibrium zone of the willow of the operating scale Minuette) together with the initial SSL line (1.2989) of the fork operating scale Minuette will determine the movement of GBP / USD to the borders of 1/2 Median Line wagons of the operating scale -> Minuette (1.3015 <-> 1.3050 <-> 1.3085) and Minuette (1.3110 <-> 1.3176 <-> 1.3250). Details are shown in animated graphics. ____________________ The review compiled without taking into account the news background. Thus, the opening of trading sessions of the main financial centers and is not a guide to action (placing orders "sell" or "buy"). |
| Posted: 13 May 2019 05:22 PM PDT Minute ( h4 ) Euro vs US Dollar Previous overview from 08/05/2019 22:20 UTC + 2 ____________________ The development movement of the single European currency EUR / USD from May 14, 2019 will result depending on the direction of the breakdown of the boundaries of the channel. The 1/2 Median Line (1.1220 <-> 1.1233 <-> 1.1250) fork operational scale Minuette. The layout of movement options within the a ML Minuette channel is presented in an animated graphic. ____________________ Prospects for the development of the downward movement (sell) The breakdown of the support level 1.1220 (lower border of 1/2 channel Median Line Minuette ) -> continuation of the downward movement of the single European currency to the borders of 1/2 channel Median Line (1.1170 <-> 1.1145 <-> 1.1125) of the forked operating scale Minuette. Details look at the animated graphics. ____________________ Prospects for the development of the upward movement (buy) The breakdown of the resistance level of 1.1250 (upper limit of the channel 1/2 Median Line Minuette) -> option to continue the development of the upward movement of EUR / USD to the targets -> median line Median Line Minuette (1.1260) <-> upper limit of ISL61.8 (1.1290) balance zone of the fork of the operational scale Minuette <-> end Shiff Line Minuette (1.1310) <-> local maximum 1.3240 <-> lower limit of the ISL38.2 ( 1.1375 ) equilibrium zone of the forks of the Minuette operating scale. Details are shown in animated graphics. ____________________ The review was compiled without regard to the news background. Thus, the opening of trading sessions of the main financial centers and is not a guide to action (placing orders "sell" or "buy"). |
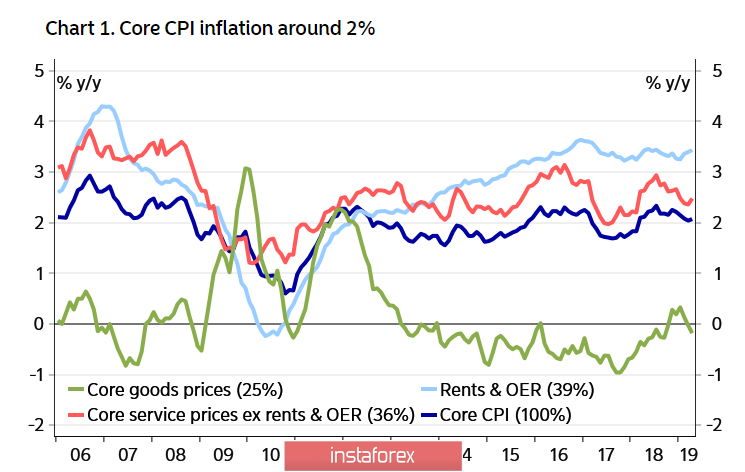
| Posted: 13 May 2019 03:59 PM PDT Core inflation in the US rose to 2.1% y/y in April against 2.0% y/y a month earlier, overall growth was slightly below expectations, but did not cause any noticeable reaction in the markets. At the last FOMC meeting, the topic of inflation sounded quite heavy, because inflation is one of two parameters, along with the labor market, on which the Fed is focused on when it formulates monetary policy. The slowdown in inflation increases the chances of a rate cut, data published on Friday did not make any changes in market expectations. Much more attention is paid to the markets of the trade war between the United States and China, which has entered an active phase. The United States has raised tariffs for Chinese imports worth $200 billion, moreover, Trump has already given the order to begin preparations for the transfer to higher tariffs and the entire remaining volume of imports. The markets have so far reacted rather restrained, as they take into account the high probability that an agreement will be reached in the near future, and Trump's impulsive step is seen as an attempt to exert coercive pressure in order to achieve better results in the negotiations. The United States is losing room to maneuver, unlike China, which can delay negotiations for an arbitrarily long time. According to estimates by the Congressional Budget Office (CBO), the federal budget deficit was 531 billion dollars in the first 7 months of the 2019 fiscal year, which is 145 billion more than a year ago, and this was due to the fact that part of the payments of 44 billion could be moved to a later date. In total, a deficit of 896 billion is expected in 2019, the growing deficit forces the US government to use all available methods to increase revenues, so the pressure on China is unlikely to decrease in the foreseeable future, despite the results of the negotiations. The attempt to accuse China of disrupting the negotiations is just a ploy to hide the true reasons for such haste on the part of the United States. EURUSD Europe is approaching the start date of the Parliamentary elections, which will start on May 23, and for some time political factors could become dominant in assessing the prospects for the euro. The economic conditions index ZEW will be published on Tuesday, the latest data on the state of the German economy gives reason for some optimism - industrial production increased in March, exports grew, so the economic component of the euro is on the side of the bulls. At the same time, the escalation of the trade war and the approach of the political battle season force investors to exercise caution, which can lead to a decline in stock markets amid profit taking and the transfer of capital to defensive assets, which will put additional pressure on the euro. EURUSD is at the upper border of the downward channel, the probability of going down to the support of 1.1110 looks higher than the possibility of growth. The nearest resistance 1.1253 and 1.1264 are more logical to use for selling GBPUSD UK industrial output rose by 0.7% in March, and annual growth also increased from 0.4% to 1.3%. The processing industry grew even faster - from 1.2% to 2.6%. Growth was recorded for the first time since October 2018, while the overall production index is still lower than before the 2008 economic crisis. In general, macroeconomic data that was published on Friday in favor of the pound - preliminary data on GDP in Q1 reached expectations, a positive factor can be considered an increase in investment by 0.5% after 5 quarters of a continuous decline, and the trade deficit in March slightly decreased. The sustainability of positive changes was immediately called into question by NIESR - in its opinion, the growth rate of GDP inclusively decreased from 0.5% to 0.4% over the last 3 months to April. On Tuesday, a report on the UK labor market will be published, the forecasts are still neutral, and in general they fully correspond to the cautious position of the Bank of England, which is reflected in moderate forecasts for GDP and inflation, published in early May. The pound is trading neutral with a slight fall, going beyond the range of 1.2966 ... 1.3046 is unlikely. The decline is slightly more likely, so attempts at growth can be used for selling. The material has been provided by InstaForex Company - www.instaforex.com |
| Posted: 13 May 2019 03:51 PM PDT Following the two-day talks, the United States and China did not reach a trade agreement. Immediately after this, US President Donald Trump stated that the United States and China had direct and constructive discussions on the status of their trade relations, but whether the duties would be retained or abolished depends on what happens next during the negotiations with China. Let me remind you that on Friday, US President Donald Trump's decision to increase duties on Chinese imports came into force, to which authorities in China reacted very harshly, but have not yet resorted to retaliatory measures. With regard to the fundamental statistics, which was released on Friday, the report on inflation in the United States did not provice a strong support for the US dollar, as prices continued to rise mainly due to higher energy resources. According to the US Department of Labor, CPI in the United States in April this year rose by 0.3% compared with the previous month. The base consumer price index, which does not take into account the volatile categories, increased by only 0.1% compared with the previous month. Economists had expected the overall index to show an increase of 0.4%, while the base index would rise by 0.2%. Compared with the same period of the previous year, consumer prices rose by 2.0%, and the basic index immediately by 2.1%. Economists had forecast that both the general and the base indices would show an annual growth of 2.1%. As I noted above, the main growth occurred at the expense of energy. For example, gasoline prices reached $2.8 per gallon in April against $2.52 in March. In general, energy prices in the United States added 2.9% in April compared with the previous month. On Friday afternoon, Fed representatives also gave speeches, as they continue to talk about inflation. President of the Federal Reserve Bank of New York, John Williams, said that the US economy remains on the path of healthy growth, and the labor market is strong. Despite the fact that inflationary pressure is restrained, the weakness of inflation will be temporary, since the basic inflationary pressure is closer to the target level of the Fed. Williams also expects a slowdown in GDP growth to 2.25% in 2019, while the short-term risks for economic growth, in his opinion, have slightly decreased. Regardless, trade conflicts and Brexit are still a serious problem for the global economy. As for the technical picture of the EURUSD pair, further movement will depend on whether buyers of risky assets can cope with the resistance level of 1.1240, a breakthrough of which will increase the demand for the trading tool and lead to new weekly highs in the 1.1270 and 1.1300 area. The downward correction may be limited by the support of 1.1200 and a larger level of 1.1170. The USDCAD pair tumbled after the publication of a report that employment growth in Canada sharply increased in March of this year. According to official data, the net number of jobs in Canada rose by 106,500 in April, while economists had expected growth of only 15,000. The unemployment rate in Canada was 5.7% in April against 5.8% in March. The material has been provided by InstaForex Company - www.instaforex.com |
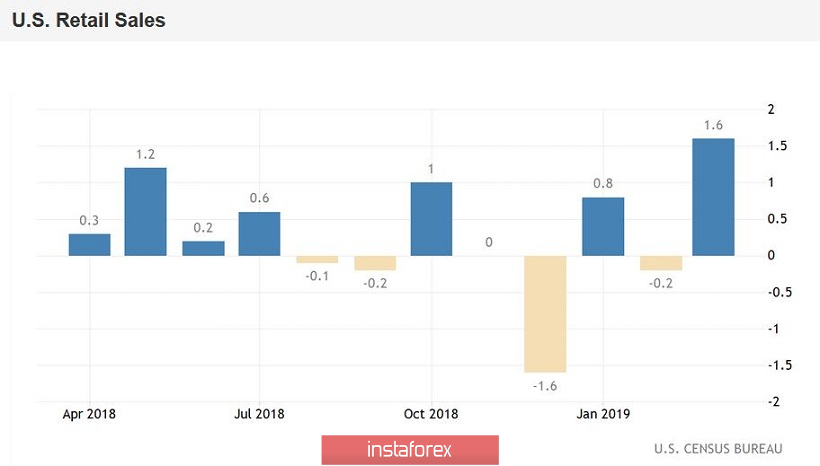
| EUR/USD: Euro maintains growth potential. Preview of the trading week Posted: 13 May 2019 03:35 PM PDT The euro-dollar pair ended the previous week at around 1.1232, that is, above the Bollinger Bands average line and above the Tenkan-sen and Kijun-sen lines (on the daily chart), while the Ichimoku indicator formed a "Golden Cross" signal which cautioned a possible trend reversal. That is, from a technical point of view, the pair retained the potential for further price growth. But the eur/usd bulls need an appropriate fundamental argument. Starting on May 13, the trading week is full of macroeconomic reports, although key European and US indicators have already been published over the past two weeks. Nevertheless, the expected releases will complement the fundamental picture by folding the corresponding puzzle. By and large, the dollar and the euro are now at a crossroads, balancing on the verge of stalling. Dollar bulls are closely watching the US inflation indicators, while the European currency reacts to the general dynamics of macroeconomic indicators, hoping for a further recovery of the eurozone economy. Here it is worth noting that the external fundamental background could not support the dollar: despite the actions and comments of Trump, the Chinese showed a low-key response and continued trade negotiations. The vice premier of China even noted a certain constructiveness in the negotiations, although he acknowledged the existence of remaining differences, which will be discussed at the next meeting to be held in Beijing. A similar position was voiced by the US president. In other words, the risk of a resumption of the trade war has declined: Trump even stated that the imposed duties could be abolished after further negotiations. Due to this fact, the main focus of EUR/USD traders is once again returning to macroeconomic statistics. Monday in this context is absolutely empty: today the interest of investors can only be caused by the speech of the head of the Federal Reserve Bank of Boston, Eric Rosengren. This year, he has the right to vote in the Fed, so his comments may affect the dynamics of trading. Rosengren was a consistent hawk for a long time, but at the beginning of this year he was concerned about the increased risks (first of all, the relatively weak inflation rate). Given the latest data on the growth of the consumer price index, his rhetoric is unlikely to toughen. We learn the key data on the growth of German inflation on Thursday. Germany is the "locomotive" of the European economy, so this indicator is important for the euro. German inflation rose to 1% in April on a monthly basis and to 2% in annual terms. The harmonized consumer price index (adjusted for changes in taxes) also showed a positive trend, and a significant one. The final figures for April will be published today. According to most experts, they will coincide with the initial assessment, providing background support for the euro. Also on Tuesday, traders of the pair will track the release of the Sentiment Index in the business environment from the ZEW Institute in Germany and throughout the eurozone. The German indicator in April showed the strongest increase over the last year. For the first time since March 2018, the indicator came out of the negative area, and traders could not but pay attention to this fact. In addition, the increase in the index as a whole in the eurozone also exceeded the zero value (for the first time in the last year) and exceeded analysts' expectations, having updated the 11-month high. According to preliminary forecasts, positive dynamics will follow in May, both in Germany and in Europe as a whole. If this forecast is confirmed, the euro will get quite strong support, as in this case we can talk about a persistent trend. On Wednesday, the EUR/USD pair will respond to macroeconomic reports from China and the United States. So, the Chinese authorities will publish data on the growth of industrial production. Last month, this figure surprised investors with a record growth of up to 8.5%. In April, the indicator is expected to decline to 6.5%, but if China again surprises with the growth of industry, then the risk-taking in the market will noticeably increase, putting strong pressure on the US currency. US retail sales data will be published during the US session on Wednesday. In March, this figure went out of the negative area (including without car sales) - the index rose to 1.6% and 1.2%, respectively. This week we will learn April figures, which, according to preliminary forecasts, will be worse than March figures. Taking into account auto sales, the index should fall to 0.2%, excluding - to 0.7%. On Thursday, EUR/USD traders should pay attention to the speech of ECB Vice President Luis de Guindos, announced the probability of resuscitation of the QE program. Given the dynamics of macroeconomic indicators in Europe, he can change his position on this issue, thereby providing support for the euro. Also on Thursday, Fed representatives will speak - Neil Kashkari (does not have the right to vote) and Laell Brainard (with the right to vote). There will be no important economic reports on this day - the only thing that is of interest is the indicator of building permits issued in the United States. But on Friday, all the attention of euro-dollar traders will again be focused on the inflation rate - this time in the eurozone. The final data for April will be published on this day. Let me remind you that the preliminary assessment turned out to be much better than expected - the general consumer price index jumped to 1.7%, while core inflation rose to 1.2%. According to the overwhelming majority of experts, these figures will not be revised downward. This fact will strongly support the euro, as some analysts have previously doubted the "credibility" of the April result. On Friday, the US currency will respond to the rhetoric of the Fed representatives: on the last trading day, John Williams and Richard Clarida will speak. This year, they have the right to vote in the Fed, so their assessment of the current situation will have an impact on the dollar's position. Thus, in terms of the foundation, the EUR/USD pair has the potential for further growth - at least to the lower boundary of the Kumo cloud on the daily chart (1.1275). If the eurozone economy will show signs of recovery, the upward dynamics may continue - up to the middle of the 13th figure (that is, to the upper boundary of the Kumo cloud). The material has been provided by InstaForex Company - www.instaforex.com |
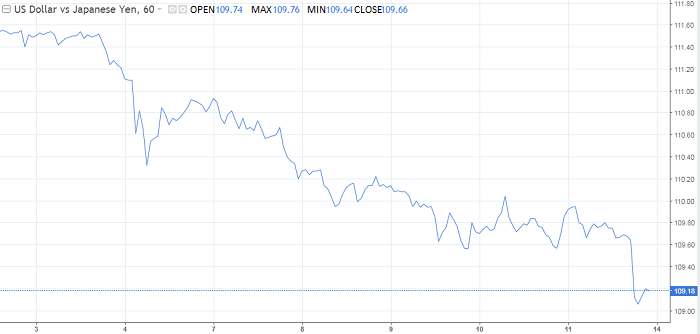
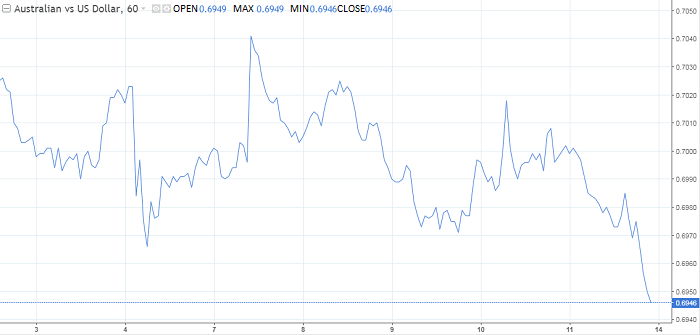
| USD/JPY: Is it possible to return to 111? Posted: 13 May 2019 03:35 PM PDT Recent events indicate that the US-China trade negotiations will not go the easy way. The appetite for risk suffers again, although at the end of last week, attempts at cheerfulness were noticed. It is worth paying attention to the fact that on Monday, the volatility in the Chinese yuan was going off scale. The currency has realized the maximum daily decline in the last 9 months, having reached the level of 6.9065 paired with the US dollar. The last time the yuan was so cheaply priced was during the global financial crisis. If things continue this way, then in the coming months, one dollar will be equal to seven yuan. Beijing is likely to use its huge foreign exchange reserves to prevent the depreciation of the national currency, which could trigger a strong outflow of capital. Currently, investors are focusing on retaliation from China, which reported the introduction of duties on a number of American products from June 1 of this year. The news contributed to a further decline in risk sentiment. The main beneficiaries in the foreign exchange market are the Swiss franc and the Asian region's traditional safe-haven currency - the Japanese yen. At the beginning of the week, the dollar/yen pair lost 0.25% of its value and is near the 3-month low formed last week at 109.47. Yen as a "tidbit" Market participants began to bet that the Japanese currency would benefit from its defensive status if the trade conflict continued to worsen. However, despite a decisive breakthrough below 110, the yen still lacks credibility. Traders probably do not want to go too far in the absence of complete clarity of the situation. Many experts continue to demonstrate confidence that sooner or later the "posturing" of the two countries will exhaust itself and the bargain will be concluded. The United States and China do not benefit from a protracted and sharp conflict. The economies of both countries suffered from trade friction last year, and given the current slowdown in global GDP growth, a full-scale trade war can have devastating consequences. If in the coming weeks the leaders of the two countries do not come to a compromise, then the yen may push the dollar through other levels of support. There is another more interesting question at the moment. What happens if fear of a trade war disappears? Is it possible to return to the mark of 111? More likely than not, but only under the condition that the market is entirely confident that the danger has passed. Aussie gives ground The Australian dollar is extremely sensitive to changes in risk sentiment. In addition, it serves as a liquid intermediary in bidding related to China, Australia's largest trading partner. Tensions in the negotiation process put pressure on the aussie, which noticeably fell in price not only to its American counterpart. The decline was also recorded in relation to the Japanese yen, as well as the Canadian dollar. On Wednesday, you should follow the data on the Chinese economy. If it does not reach the forecasts, it will reinforce the market's view that growth in China continues to slow down. In this case, the process of outflow of capital from emerging markets will accelerate, and the US dollar will strengthen the position. Moreover, capital inflows to the United States will begin to accelerate inflation, which will give the Fed a reason to tighten policies, which, in turn, will cause a large-scale recovery of the dollar. If we recall the Reserve Bank of Australia's reluctance to raise the rate and the signals of the central bank on its possible decline, then prospects for the aussie look very gloomy. The material has been provided by InstaForex Company - www.instaforex.com |
| EUR/USD: US and EU trade dispute may be revived Posted: 13 May 2019 03:35 PM PDT The hopes of investors for an early conclusion of a deal that would put an end to the trade confrontation between the two largest economies in the world have not yet been realized. The next round of talks between the American and Chinese representatives ended last Friday without a trade agreement. However, the lack of a deal is also a result. The signing of the agreement seems to be postponed until better times. It is possible that it could be before the June G20 summit in Japan. China has about three weeks to rectify the situation. It is assumed that after this period, tariffs in the amount of 25% on the import of Chinese goods worth US$ 200 billion into the US will earn in full power. Given the fact that the euro fell in 2018 amid growing trade tensions in the world, we can only wonder at its resilience. On the one hand, American protectionism leads to a reduction in world trade, slowing the growth rate of Chinese and European GDP. On the other hand, the introduction of trade tariffs provokes price increases, that is, it accelerates inflation. According to some estimates, if the trade war between Beijing and Washington continues for two years, consumer prices in the United States may accelerate by 0.2–0.4%. Most likely, the Fed will perceive the potential rise in inflation as a temporary phenomenon, while a 10-15% decrease in the S&P 500 index against the background of escalating trade conflict can be a serious argument in favor of easing monetary policy on the part of the regulator. At the moment, the derivatives market estimates the probability of a decrease in the federal funds rate this year at 66%. However, the stability of the "bulls" position on EUR/USD is explained not only by expectations regarding monetary expansion in the United States. A large-scale monetary stimulus in China improved macroeconomic statistics not only in the PRC, but also in Germany. This is evidenced by the positive data on industrial production and foreign trade of the latter. According to experts, in the first quarter the GDP of the leading economy in the eurozone expanded by 0.4%. This allows the euro to strengthen on rumors. If we add to this the closing of positions by carry traders in the assets of developing countries, the growth of EUR/USD seems quite logical. According to a consensus forecast of analysts recently surveyed by Bloomberg, by the end of this year, the euro could rise to $1.18 against the dollar. However, the escalation of the US and PRC trade wars, the increase in the budget deficit of the latter, and the weakening of the effect of fiscal and monetary incentives in China can make significant adjustments to this forecast. In addition, it should be remembered that the United States has claims in the trade sector not only to China, but also to its European partners. This week, the deadline for Washington's decision to raise duties on car supplies from the eurozone to the United States will come to an end. It is possible that amid difficulties in the trade discussions with China, the American side would prefer not to increase pressure on Brussels, however, the likelihood of increasing trade duties on European cars in the near future will be a risk factor for the euro. It is assumed that in the event of the return of the relevance of the US-EU trade dispute, the EUR/USD pair may return to the mark of 1.11. |
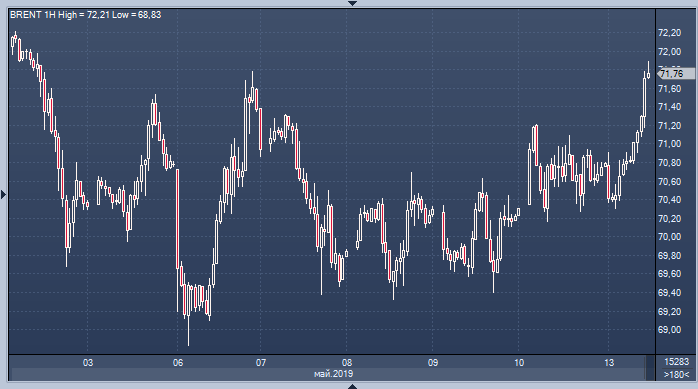
| Oil prices are going up steadily and are approaching $72 a barrel Posted: 13 May 2019 03:35 PM PDT According to analysts, the active growth in the price of Brent crude oil at 1.25%, towards the direction of $72 per barrel, is due to negative news from the Middle East. The catalyst for such a rise was the statements of Khalid al-Falih, the Minister of Energy of Saudi Arabia, who reported the attack on two oil tankers off the coast of Al-Fujairah, which is part of the UAE. Previously, Iranian and Lebanese media also reported explosions in the port of Al-Fujairah. According to the minister of energy of Saudi Arabia, two Saudi oil tankers have become the target of a sabotage attack in the economic zone of the United Arab Emirates. One of them was heading to the port of Ras Tanura for loading oil to be delivered to Saudi Aramco customers in the United States. The attack did not lead to casualties or oil spills, but caused significant damage to both vessels, Khalid al-Falih said. He expressed an extremely negative attitude towards the incident, stressing that the attack was aimed at undermining the freedom of maritime navigation and supplying oil to consumers all over the world, and called on the international community to assist in ensuring security. During the incident, Saudi authorities did not seek to provide information about what happened. A number of experts believe that this was done in order to justify a further increase in US pressure on Iran. Many investors fear that in the future the confrontation between the United States and Iran will increase and adversely affect the global market for raw materials. |
| Hedge funds are betting on the dollar's growth Posted: 13 May 2019 03:34 PM PDT Over the past month, the greenback has strengthened against all currencies of the G10 countries, except for the yen, which, like the US currency, acts as a defensive asset. The dollar also went up against a basket of currencies of developing countries, which fell by 1.9% over the last month. According to some experts, the USD index can break up the current range amid the aggravated trade dispute between the United States and China In particular, this view is held by investment fund specialists, who believe that markets now underestimate the risk of a protracted trade war, which will increase the demand for defensive assets in the context of a slowdown in the global economy. According to them, the obvious solution would be short positions on the alleged outsiders - currencies of developing countries from Asia to South America, which are most sensitive to risk perception. "Frankly speaking, I thought that the greenback would be strengthening much faster, as the markets laid the idyllic scenario of the development of events into quotes, and they were clearly mistaken. At the moment, I would be taking long positions on the US dollar against EM currencies," said Steven Miller from the venture capital firm GSFM. Against the backdrop of escalating trade tensions between the two largest economies in the world, GSFM favors the US currency after Societe Generale and Kapstream Capital. Although Washington and Beijing intend to continue negotiations, investors do not seem to expect a speedy resolution of the problem. The material has been provided by InstaForex Company - www.instaforex.com |
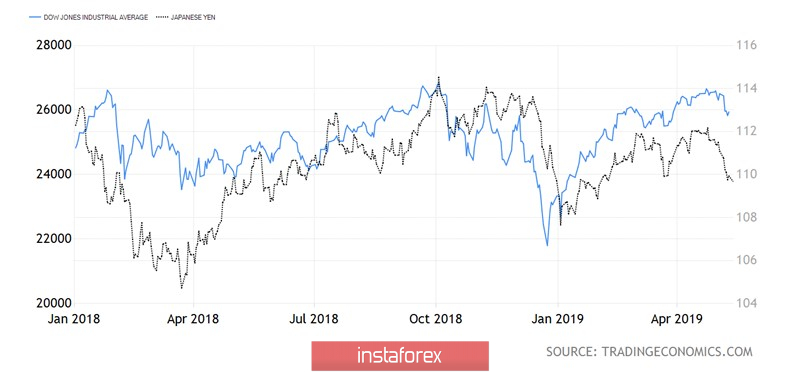
| Yen goes to the call of trade wars Posted: 13 May 2019 03:34 PM PDT When a currency becomes a kind of indicator of the intensity of trade tensions in the United States and China, and the news about the relationship between the two largest economies in the world does not leave the front pages of the media, interest in it is heated to the limit. The escalation of the trade conflict between Washington and Beijing has lowered USD/JPY quotes to its lowest level since January. The US raised tariffs from 10% to 25% for $200 billion-worth of imports from China and also threatened that it would impose duties on all deliveries from China to the US market within a month. In such a situation, the correction of world stock indices and the yield of US Treasury bonds looks logical, as well as the high interest in the Japanese yen. According to BofA Merrill Lynch, a large-scale trade war will lead to the S&P 500's 10% peak and possibly a recession of the world economy. Nevertheless, the bank believes in good. De-escalation of the conflict will allow the US stock market to stabilize and add about 5% to its current values. Given the high correlation between the US and Japanese yen stock indices, it can be assumed that the fate of the latter will depend on further dialogue between Beijing and Washington. Dynamics of USD/JPY and the Dow Jones Due to favorable financial conditions, a strong economy, low borrowing costs by historical standards, and the market reaction to Donald Trump's statements, I personally doubt that the S&P 500 correction will be deep. If US actions did not fall into the abyss in response to the news over the failure of China-US talks in Washington, calming down because of Steve Mnuchin's conciliatory words about the constructive nature of the dialogue, Liu He's comments about "pretty good negotiations", then surely they will continue to be more sensitive to verbal interventions. The owner of the White House will have the opportunity to rein in the "bears" on stock indexes in the event of a pullback. For this, it is enough to say something good to China. However, uncertainty creates favorable conditions for safe-haven assets. Beijing has about three weeks until goods that fall under the 25% tariff will move from Asia to America, and about a month until the White House imposes duties on all imports. Will it change its own laws to please the United States? Chinese media claim that China will not eat bitter fruit, but they have previously argued that no one would agree to negotiate at gunpoint. The situation is extremely difficult. According to Societe Generale, at current rates, the loss of US GDP will be 0.25 pp for 2-3 years, China will lose twice as much, and the world economy will lose 0.15 pp. In any case, the uncertainty will continue to maintain interest in selling USD/JPY. Technically, if the bears in the analyzed pair succeed in consolidating below the level of 109.65, the risks of selling the target by 88.6% in the "Shark" pattern will increase. It corresponds to the mark of 108. As long as the quotes are below 110.8, the sellers are in control of the situation. The material has been provided by InstaForex Company - www.instaforex.com |
| EUR/USD. May 13. Results of the day. The euro continues to strengthen slowly against the US dollar Posted: 13 May 2019 03:34 PM PDT 4-hour timeframe The amplitude of the last 5 days (high-low): 37p - 51p - 31p - 77p - 41p. Average amplitude for the last 5 days: 47p (53p). The EUR/USD ends the first trading day of the week with growth, however, at no more than 20 points at the moment. Friday volatility on the instrument fell again, and today, amid the complete absence of any macroeconomic information, there were no reasons for its increase. Thus, it can even be assumed that the pair continues to ascend by inertia. We note that the previous local high has not yet been overcome or updated, although the upward trend in the instrument is maintained and it is recommended to work it out without trying to guess when the next downward reversal will occur. We also do not recommend trying to be proactive and play any news on the EU-US trade war and the US-China trade war. Firstly, it is completely incomprehensible how the two wars will end. There is no information about the trade negotiations between Brussels and Washington. In the case of China, trade duties of 25% have already begun to act, and now the answer is for Beijing, which is unlikely to leave such a step unanswered. Secondly, for the time being it is difficult to say that traders generally react to messages on this topic. And when they begin to react, and whether they will begin at all, and how exactly they will begin to react, it is impossible to predict. During the previous round of the trade conflict with China, the US dollar quietly increased, in spite of everything. However, we can not say for sure that it has appreciated on the news of the trade conflict. Thus, we recommend that you be extremely cautious with opening medium-term and long-term positions, since volatility is low now, and the prospects for the pair are very vague. Trading recommendations: EUR/USD resumed its upward movement. Thus, at the beginning of this week, long positions with targets at 1.1268 and 1.1299 are relevant until the MACD indicator moves down, which will indicate a new round of correction. Sell positions are recommended to be considered only after traders have consolidated below the Kijun-sen critical line with the first goal of a support level of 1.1181. In addition to the technical picture, one should also take into account the fundamental data and the time of their release. Explanation of the illustration: Ichimoku indicator: Tenkan-sen - the red line. Kijun-sen - the blue line. Senkou Span A - light brown dotted line. Senkou Span B - light purple dotted line. Chikou Span - green line. Bollinger Bands indicator: 3 yellow lines. MACD Indicator: Red line and histogram with white bars in the indicator window. The material has been provided by InstaForex Company - www.instaforex.com |
| GBP/USD. May 13. Results of the day. Trump gives an ultimatum to China Posted: 13 May 2019 03:34 PM PDT 4-hour timeframe The amplitude of the last 5 days (high-low): 89p - 91p - 93p - 69p - 57p. Average amplitude for the last 5 days: 80p (106p). All Monday, May 13, the British pound sterling was in a weak upward correction, but after it became known that Donald Trump had delivered an ultimatum to China, the US dollar sharply increased. The essence of the ultimatum lies in Trump's call to conclude a deal with the United States. According to Trump, it was almost concluded, but Beijing took a step back. Trump is threatened by the fact that American companies may leave China in favor of other countries, and Chinese imports will become very expensive. Also earlier, Trump has already noted that China strongly delays the signing of the deal, while China itself has gone back down because of its unwillingness to change its legislation. Thus, we draw an important conclusion that at this stage of the trade conflict, any escalation supports the US dollar. Therefore, when the trading conditions are strained in the future, this can also lead to the strengthening of the US currency. New data on Brexit now there. From a technical point of view, the pair resumes the downward movement. Thus, the pound sterling is again under pressure. But we have already written about this more than once. Now, in addition to everything else, Trump's actions have started to support the dollar. In general, even without Trump, the pair looked only in one direction, downwards, even despite frequent upward corrections, most of which have no fundamental basis. Trading recommendations: The GBP/USD currency pair has bounced off the critical line at the moment. Therefore, it is now recommended to consider sell orders with a target of 1.2926. The downward trend is likely to be resumed. Buy orders can be considered in small lots only when the price has consolidated above the Kijun-sen line with an initial target of 1.3087. In addition to the technical picture, one should also take into account the fundamental data and the time of their release. Explanation of the illustration: Ichimoku indicator: Tenkan-sen - the red line. Kijun-sen - the blue line. Senkou Span A - light brown dotted line. Senkou Span B - light purple dotted line. Chikou Span - green line. Bollinger Bands indicator: 3 yellow lines. MACD Indicator: Red line and histogram with white bars in the indicator window. The material has been provided by InstaForex Company - www.instaforex.com |
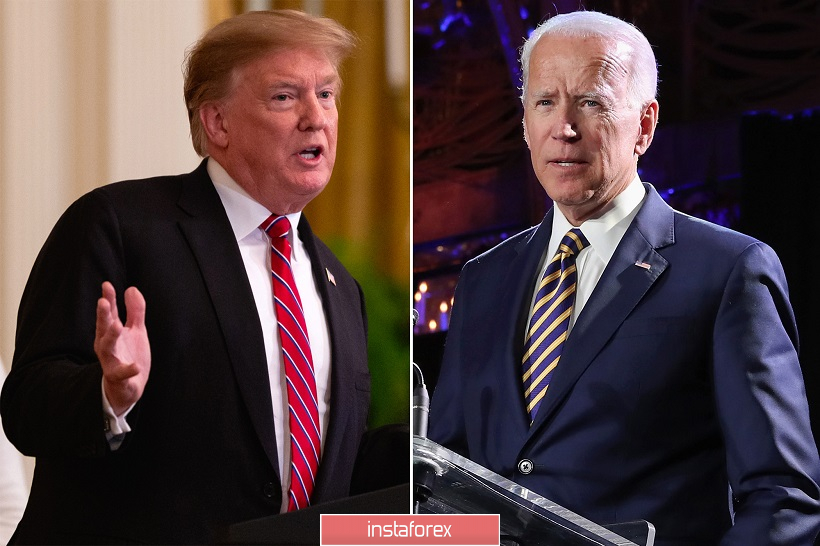
| Minute dollar drop: what was it? Posted: 13 May 2019 03:33 PM PDT In the morning of Monday, trading in the foreign exchange market was calm and measured. Against the background of an almost empty economic calendar, the euro-dollar pair showed minimal price fluctuations around the 1.1220 mark, that is, almost at the level of the Friday close. However, at the beginning of the US session, market volatility increased significantly: in a matter of hours, the dollar index slumped from 97.09 to 96.82 points, and such defensive tools like the yen and gold grew significantly (in particular, the USD/JPY pair approached the bottom of the 109th figure - for the first time since February of this year). The euro-dollar pair also responded to the weakening of the US currency - the pair updated not only its high of the day, but rose to three-week price highs, namely to the mark of 1.1264. In other words, the morning attempts by the EUR/USD bears to return the price to the region of the 11th figure (the attempts, by the way, were of a rather uncertain nature) again failed. And although the upward impulse did not receive its continuation, buyers of the pair were still able to test the price level higher, thus moving away from the most important levels for bears. Just two hours later, the dollar returned to its previous positions, and traders wondered - what caused such a "storm of volatility"? Indeed, despite the transience of the upward impulse, traders felt a serious and, most importantly, unexpected shake. According to the overwhelming majority of experts, the dollar bulls were "scared" of China's retaliatory steps in the trade confrontation between Beijing and Washington. We cannot say that China's response immensely surprised the market: immediately after the US' introduction of additional duties, representatives from Beijing stated that they were studying the possibility of using mirror response measures. Perhaps traders were confused by the peace-loving rhetoric of China Deputy Prime Minister Liu He, who, following the results of the negotiations, declared "cautious optimism" regarding the future prospects of the negotiation process. In addition, both sides were satisfied with the dialogue, and on Friday even Trump expressed his readiness to cancel the imposed duties, if Beijing and Washington nevertheless come to a common denominator. But the events of the last two days have significantly reduced the likelihood of such a scenario. First, at the weekend Trump demanded not to make a decision on the deal and conclude a trade agreement, "not waiting for the results of the next presidential election in the United States. It is likely that the root of the problem lies precisely in this aspect. Let me remind you that recently, former US Vice President Joe Biden mentioned his participation in the 2020 presidential campaign - a very popular and heavy figure in the United States. Absolutely all pre-election polls predict his victory in the primaries of the candidate for the presidency of the Democratic Party. According to the research of three sociological centers, Biden is at least 10% ahead of his closest rivals. This is a very significant lead. According to experts, such a confident result will allow him to focus his criticism on Donald Trump, and not on competitors in the primaries. In other words, the current US president has a truly dangerous rival in the fight for a re-election - and the Chinese are well aware of this. Moreover, Biden is known for being a supporter of "warm relations" with China - when he was serving as vice president, he repeatedly called for expanding bilateral cooperation with China. However, the intrigue of the US presidential election will continue for a long time, at least over the next year. Therefore, Trump uses the carrot and stick method to force the Chinese to enter into a historic trade deal. In particular, on Saturday, he threatened Beijing with the fact that if the deal was concluded during his second presidential term, the stipulated conditions for the Chinese would "significantly worsen." But China responded to Trump's threats with retaliatory duties for US goods worth a total of about $60 billion. New tariffs will affect about 5,000 commodity items: for 2,493 of them fees will increase to 25% of their value, for 1,078 items even more - by 20%, and by 974 items - up to 10%. The rest will be subject to a 5 percent duty. In addition, according to the American press, in the near future Beijing may substantially reduce or completely stop purchases of American agricultural products and energy resources in the United States. Also, according to several sources, the Chinese are considering the option of "getting rid of" US Treasury bonds. By the way, this factor, in fact, pulled down the dollar throughout the market today - though only for a few hours. The market quickly doubted that China would take such measures, at least in the foreseeable future. In general, most currency strategists predict increased tensions in relations between China and the United States, but doubt that countries will return to a full-fledged trade war. Thus, the US and China "showed their teeth", but so far they have diverged around the corners of the market. If Beijing and Washington are satisfied with the achieved effect, the market will return to its regular life, following the macroeconomic statistics. Otherwise, such price jumps will again be repeated against the background of rising anti-risk sentiment. The material has been provided by InstaForex Company - www.instaforex.com |
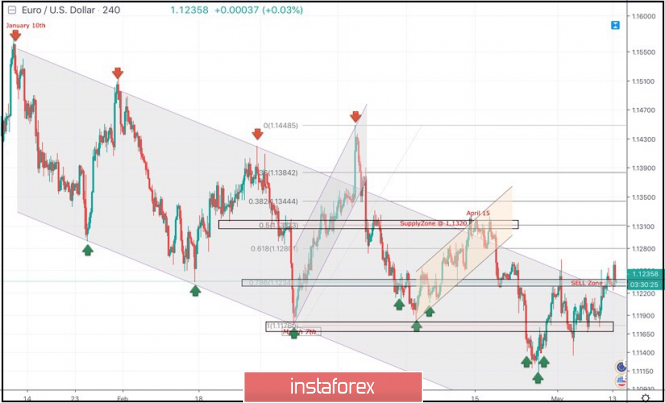
| May 13, 2019 : EUR/USD Intraday technical analysis and trade recommendations. Posted: 13 May 2019 10:45 AM PDT
Few weeks ago, a bullish Head and Shoulders reversal pattern was demonstrated around 1.1200. This enhanced further bullish advancement towards 1.1300-1.1315 (supply zone) where significant bearish rejection was demonstrated on April 15. Short-term outlook turned to become bearish towards 1.1280 (61.8% Fibonacci) then 1.1235 (78.6% Fibonacci). For Intraday traders, the price zone around 1.1235 (78.6% Fibonacci) stood as a temporary demand area which paused the ongoing bearish momentum for a while before bearish breakdown could be executed on April 23. That's why, the price zone around 1.1235-1.1250 has turned into supply-zone to be watched for bearish rejection. On the other hand, the market has failed to sustain bearish pressure below the price Level of 1.1175 during last week's consolidations. That's why, another bullish pullback was expected to occur towards 1.1230-1.1250 which is currently being breached to the upside. Trade recommendations : Conservative traders should be waiting for a H4 bearish closure below the depicted supply zone (1.1235-1.1250) for another valid SELL entry. S/L should be placed around 1.1260. Initial Target levels should be located around 1.1200, 1.1175 and 1.1140. The material has been provided by InstaForex Company - www.instaforex.com |
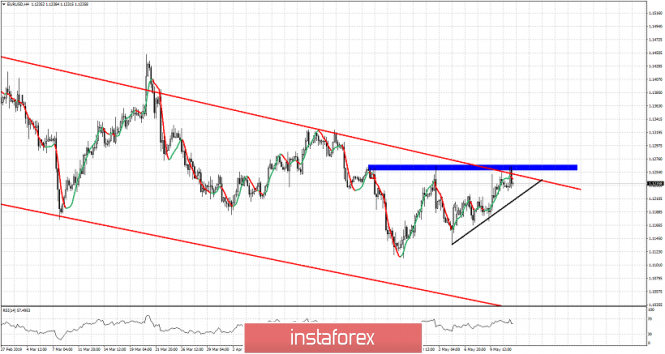
| EURUSD remains inside medium-term bearish channel Posted: 13 May 2019 10:44 AM PDT EURUSD has tried to break above the 1.1230-1.1260 resistance area but thus far price seems unable to break through resistance. Momentum favors the break out but as long as we trade below 1.1260 we continue to trade inside a medium-term bearish channel.
Red lines - bearish medium-term channel Blue rectangle - important horizontal resistance Black line - short-term support trend line EURUSD so far got rejected at the 1.1266 resistance from the previous 2 peaks. Price is challenging the previous highs and the upward boundary of the bearish channel. So far bulls are not strong enough to break resistance. Support is found at 1.1210 shown by the upward sloping black trend line. Breaking below this trend line would be a sign of weakness implying a move towards 1.11 is not out of the question. The material has been provided by InstaForex Company - www.instaforex.com |
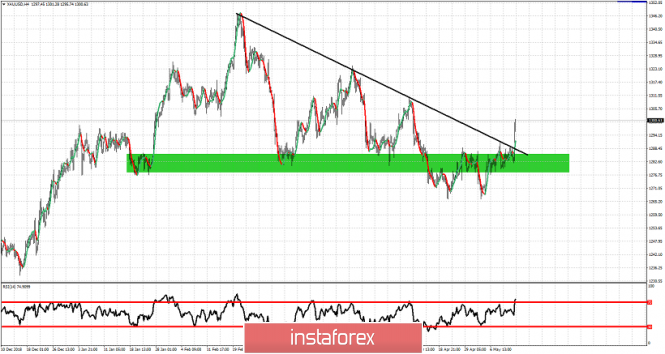
| Gold breaking to new short-term highs challenging $1,300 pivot point Posted: 13 May 2019 10:39 AM PDT Gold price has broken above the short-term top at $1,288-91 area and has reached the pivot level of $1,300. Managing to hold above it will open the way for a move towards $1,350. Failure to maintain bullish momentum will lead to a sharp rejection and reversal. So far the bullish scenario prevails.
Black line - resistance trend line (broken) Since trading near $1,266-70 area we were expecting for Gold to bounce towards $1,280-90 or even $1,300. Now that Gold has broken also above the black trend line resistance we see things from a more bullish perspective. Gold price has support at $1,288-90. Bulls must hold above this level. Bulls need to continue making higher highs and higher lows. Bears on the other hand need to show more determination now and reverse trend below $1,288 to regain control. Concluding, the breakout above the black trend line is an important event and this marks the change of the trend to bullish again and the end of the corrective phase since $1,347 peak. The material has been provided by InstaForex Company - www.instaforex.com |
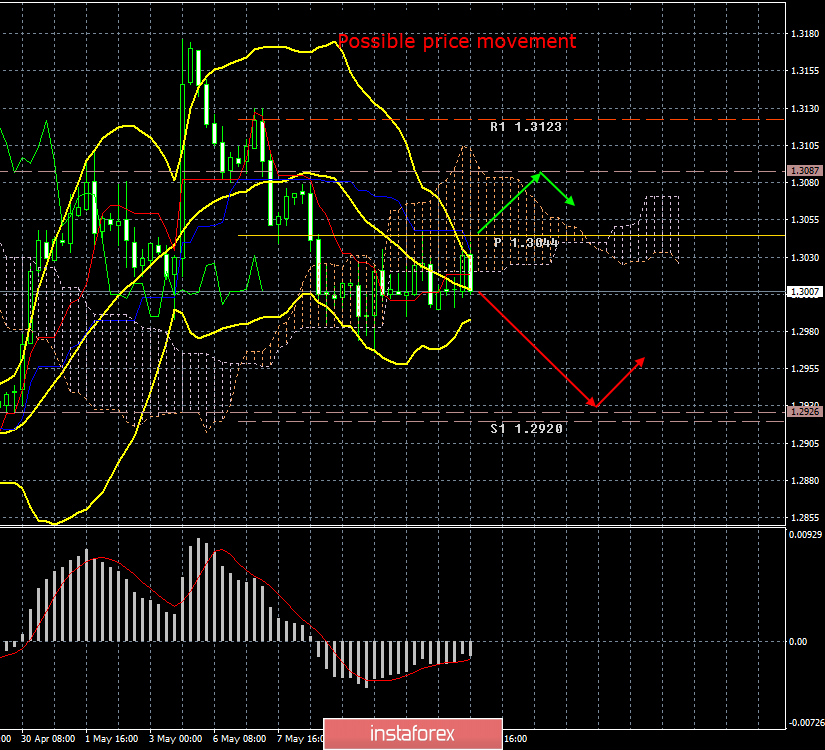
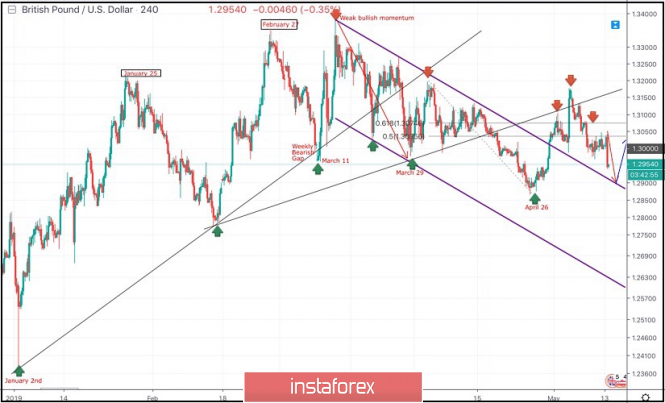
| May 13, 2019 : GBP/USD Intraday technical analysis and trade recommendations. Posted: 13 May 2019 10:23 AM PDT On March 29, the price levels of 1.2980 (the lower limit of the newly-established bearish movement channel) demonstrated significant bullish rejection. This brought the GBPUSD pair again towards the price zone of (1.3160-1.3180) where the upper limit of the depicted bearish channel as well as the backside of the depicted broken uptrend line demonstrated significant bearish rejection. Since then, Short-term outlook has turned into bearish with intermediate-term bearish targets projected towards 1.2900 and 1.2850. On April 26, a bullish pullback was executed towards the price levels around 1.3035 - 1.3070 (50% - 61.8% Fibonacci levels) where temporary bearish rejection was demonstrated. Shortly after, a bullish breakout above 1.3075 was temporarily being demonstrated until bearish breakdown below 1.3035 (50% Fibonacci level) was achieved earlier last week. Hence, a bearish Head and Shoulders pattern is being demonstrated on the H4 chart with neckline located around 1.2985. As anticipated, The price zone of 1.3030-1.3060 turned to become a prominent supply-zone where a valid bearish entry was offered by the end of last week's consolidations. For the bearish Head and Shoulders pattern to remain valid, bearish persistence should be maintained below 1.2985 (Neckline). Initial bearish Target would located around 1.2905 where another short-term bullish pullback may be initiated towards 1.2985. Trade Recommendations: For those who had a valid SELL entry around the price levels of (1.3035-1.3070). It's already running in profits. T/p levels to be located around 1.2950 and 2905 while S/L should be lowered to 1.2990 to secure some profits. The material has been provided by InstaForex Company - www.instaforex.com |
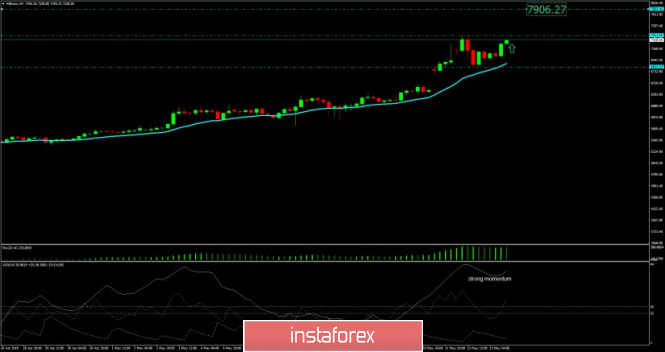
| Bitcoin analysis for May 13, 2019 Posted: 13 May 2019 06:59 AM PDT BTC has been trading strongly higher and we got test of $7.411. The momentum is strong and we expect more upside continuation.
According to the H4 time – frame, we found there is a very strong bullish momentum on the BTC and extended run is present. IT is very risky to watch for selling opportunities at this stage. ADX is ready is very strong and rising, which is indication of the strong bullish momentum. These are references: Upward: Swing high – $7.411 Upward projection - $7.900 Downward: Swing low - $6.822 Watch for buying opportunities due to strong upward momentum. Upward target is set at the price of $7.906. The material has been provided by InstaForex Company - www.instaforex.com |
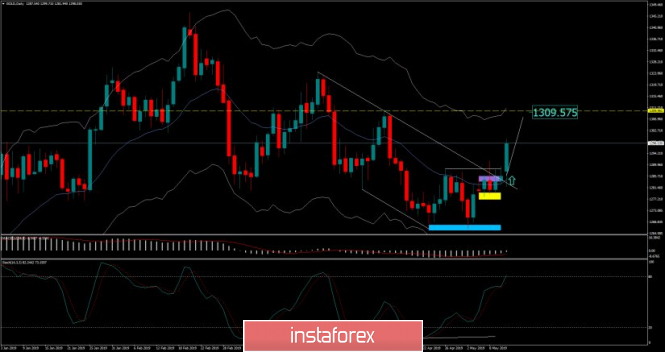
| Analysis of Gold for May 13, 2019 Posted: 13 May 2019 06:50 AM PDT Gold has been trading upwards as we expected last week. The price tested the level of $1.299. There is still space for more upside so you should watch for buying on the pullbacks.
According to the Daily time – frame, we found that there is the breakout of the 5-day balance and break of key resistance at the price of $1.291, which was the strong clue for the present upward momentum. References are set: Upward: Swing high – $1.309 Stronger swing high – $1.324 Downward: Swing high became support - $1.291 Balance low - $1.266 We are holding our long position and we secured position on the breakeven. You can watch to add buy position the pullback. Main target is set at the price of $1.309. The material has been provided by InstaForex Company - www.instaforex.com |
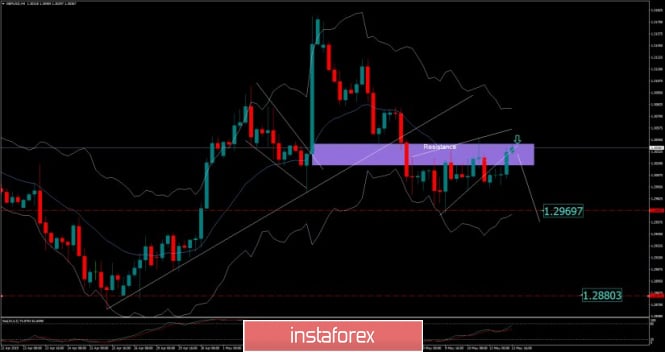
| GBP/USD analysis for May 13, 2019 Posted: 13 May 2019 06:40 AM PDT GBP/USD is trading upwards today and the price tested the level of 1.3040. Anyway, be careful when buying due to potential downward continuation on the larger scale.
According to the H4 time – frame, I found that there is breakout of the bearish flag and rejection of the medium Keltner EMA, which is sign that sellers are still present. These are reference points: Upward: Friday's high – 1.3048 Keltner upper band – 1.3076 Downward: Friday's low – 1.2990 Previous week low – 1.2967 Our advice is to watch for potential selling opportunities with the targets at 1.2969 and 1.2880. To confirm potential upward scenario, we would like to see supportive price action above the 1.3050. The material has been provided by InstaForex Company - www.instaforex.com |
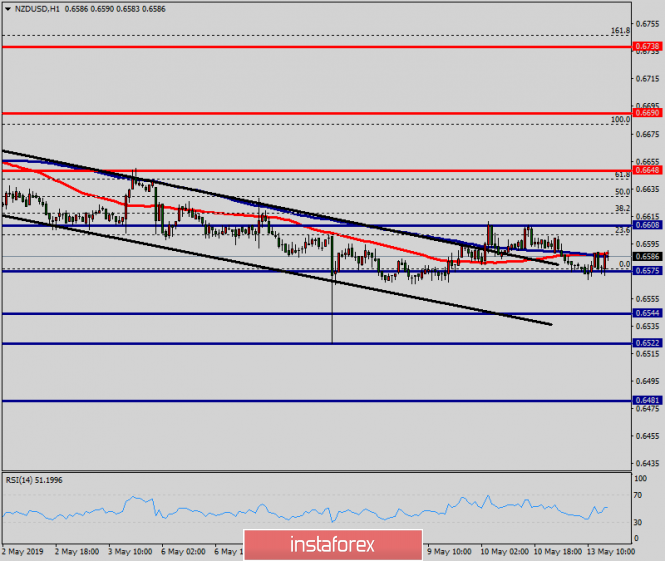
| Technical analysis of NZD/USD for May 13, 2019 Posted: 13 May 2019 06:35 AM PDT Overview: The NZD/USD pair is showing signs of weakness following a breakout of the lowest level of 0.6648. On the H1 chart, the level of 0.6648 coincides with 23.6% of Fibonacci, which is expected to act as minor support today. Since the trend is below the 23.6% Fibonacci level, the market is still in a downtrend. However, the major resistance is seen at the level of 0.6690. Furthermore, the trend is still showing strength above the moving average (100). Thus, the market is indicating a bearish opportunity below the above-mentioned support levels, for that the bearish outlook remains the same as long as the 100 EMA is headed to the downside. Therefore, strong resistance will be found at the level of 0.6690 providing a clear signal to buy with a target seen at 0.6575. If the trend breaks the minor resistance at 0.6575, the pair is likely to move downwards continuing the bearish trend development to the level 0.6544. The material has been provided by InstaForex Company - www.instaforex.com |


| You are subscribed to email updates from Forex analysis review. To stop receiving these emails, you may unsubscribe now. | Email delivery powered by Google |
| Google, 1600 Amphitheatre Parkway, Mountain View, CA 94043, United States | |
No comments:
Post a Comment