
Forex analysis review |
- Fractal analysis of major currency pairs for May 16
- EUR/USD 3 Star Sell Signal | Fundamental + Technical Analysis
- EUR/USD 3 Star Sell Signal | Fundamental + Technical Analysis
- GBP/USD. May 15. Results of the day. Trump's actions support the dollar, but the pound will fall without this help
- EUR/USD. May 15. Results of the day. Donald Trump continues to threaten China with new tariffs
- EUR/USD. Trump drove the pair to a "roller coaster"
- Euro and aussie suffer from China
- Trade wars increase the risk of pulling down EUR/USD
- The dollar does not allow gold to shine
- Nothing new for Gold today
- EURUSD back tests broken short-term support and get rejected
- May 15, 2019 : EUR/USD Intraday technical analysis and trade recommendations.
- May 15, 2019 : GBP/USD Intraday technical analysis and trade recommendations.
- EUR and CAD: The eurozone economy has overcome a recession. The euro and the Canadian dollar continue to decline against
- Bitcoin analysis for May 15, 2019
- USD/JPY analysis for May 15, 2019
- Analysis of Gold for May 15, 2019
- Trump and Batman: find the differences (high probability of AUD/USD pair decline and EUR/USD pair recovery)
- GBP/USD: plan for the US session on May 15. The pound waited for news on Brexit
- EUR/USD: plan for the US session on May 15. Data on Germany's GDP and the Eurozone pushed the euro down
- Control zones of USD/JPY pair on 05/15/19
- Wave analysis of GBP / USD for May 15. Theresa May is not giving up. She will try to accept the Brexit agreement for the
- Wave analysis of EUR / USD for May 15. Euro: new entry to update the lows.
- Technical analysis of NZD/USD for May 15, 2019
- Technical analysis of USD/CAD for May 15, 2019
| Fractal analysis of major currency pairs for May 16 Posted: 15 May 2019 06:26 PM PDT Forecast for May 16: Analytical review of H1-scale currency pairs: For the euro / dollar pair, the key levels on the H1 scale are: 1.1236, 1.1222, 1.1212, 1.1184, 1.1172, 1.1156 and 1.1146. Here, after the abolition of the upward trend, we are following the development of the downward structure of May 13. Short-term downward movement is expected in the range of 1.1184 - 1.1172. The breakdown of the latter value will lead to a pronounced movement. Here, the goal is the level of 1.1156. We consider the level of 1.1146 to be a potential value for the bottom. Upon reaching this level, we expect consolidation as well as a rollback to the top. Short-term upward movement is possible in the range of 1.1212 - 1.1222. The breakdown of the latter value will lead to a prolonged correction. Here, the goal is the level of 1.1236. This level is a key support for the downward movement. The main trend is the downward structure of May 13. Trading recommendations: Buy 1.1212 Take profit: 1.1222 Buy 1.1223 Take profit: 1.1234 Sell: 1.1184 Take profit: 1.1173 Sell: 1.1170 Take profit: 1.1156 For the pound / dollar pair, the key levels on the H1 scale are: 1.2935, 1.2903, 1.2880, 1.2835, 1.2802, 1.2781 and 1.2733. Here, we continue to follow the development of the downward structure from May 3. The continuation of the movement to the bottom is expected after the breakdown of the level of 1.2835. In this case, the goal is the level of 1.2802. Meanwhile, in the range of of 1.2802 - 1.2781, there is a consolidation. The breakdown of the level of 1.2780 will lead to the movement to the potential target - 1.2733. Upon reaching which, we expect a rollback to the top. Short-term upward movement is possible in the range of 1.2880 - 1.2903. The breakdown of the latter value will lead to a prolonged correction. Here, the target is the level of 1.2935. This level is a key support for the downward structure. The main trend is the downward cycle of May 3rd. Trading recommendations: Buy: 1.2880 Take profit: 1.2900 Buy: 1.2904 Take profit: 1.2935 Sell: 1.2835 Take profit: 1.2802 Sell: 1.2780 Take profit: 1.2735 For the dollar / franc pair, the key levels on the H1 scale are: 1.0124, 1.0095, 1.0075, 1.0045, 1.0017 and 0.9981. Here, we continue to follow the development of the downward structure of May 7. At the moment, the price is in the correction and forms the potential for the top of May 13. Continuation of the movement to the bottom is expected after the breakdown of the level of 1.0045. In this case, the first goal is the level of 1.0017, wherein consolidation is near this level. For the potential value for the bottom, we consider the level of 0.9981. After reaching which, we expect a rollback to the top. Consolidated movement is possible in the range of 1.0075 - 1.0095. The breakdown of the latter value will lead to a prolonged movement. Here, the target is the level of 1.0124. This level is a key support for the downward structure. The main trend is the downward structure of May 7. Trading recommendations: Buy : 1.0075 Take profit: 1.0093 Buy : 1.0097 Take profit: 1.0124 Sell: 1.0045 Take profit: 1.0017 Sell: 1.0015 Take profit: 0.9988 For the dollar / yen pair, the key levels on the scale are : 110.17, 109.92, 109.70, 109.26, 109.01, 108.77 and 108.30. Here, we continue to monitor the local downward structure of May 3. At the moment, the price is in correction and forms the potential value for the top of May 13. Continuation of the movement to the bottom is expected after the breakdown of the level of 109.26. In this case, the first goal is the level of 109.01. Short-term downward movement is possible in the range of 109.01 - 108.77. The breakdown of the latter value will allow to expect movement towards a potential target - 108.30. After reaching which, we expect a rollback to the top. Short-term upward movement is expected in the range of 109.70 - 109.92. The breakdown of the last value will have to form the initial conditions for the upward cycle. In this case, the potential target is the level of 110.17. The main trend: a local downward structure of May 3, the formation of a potential for the top of May 13. Trading recommendations: Buy: 109.70 Take profit: 109.90 Buy: 109.94 Take profit: 110.17 Sell: 109.26 Take profit: 109.05 Sell: 109.00 Take profit: 108.78 For the Canadian dollar / US dollar pair, the key levels on the H1 scale are: 1.3568, 1.3526, 1.3511, 1.3493, 1.3451, 1.3434, 1.3415 and 1.3378. Here, we are following the formation of the ascending structure of May 10. Continuation of the movement to the top is expected after the breakdown of the level of 1.3493. In this case, the target is the level of 1.3511, wherein consolidation is near this level. The price pass of the noise range 1.3511 - 1.3526 should be accompanied by a pronounced upward movement to the potential target - 1.3568. From this level, we expect a rollback to the bottom. Consolidated movement is possible in the range of 1.3451 - 1.3434. The breakdown of the last value will lead to a prolonged correction. Here, the target is the level of 1.3415. This level is a key support for the top. The main trend is the formation of the ascending structure of May 10, the stage of initial conditions. Trading recommendations: Buy: 1.3493 Take profit: 1.3510 Buy : 1.3526 Take profit: 1.3566 Sell: 1.3433 Take profit: 1.3417 Sell: 1.3412 Take profit: 1.3385 For the pair Australian dollar / US Dollar, the key levels on the H1 scale are : 0.6986, 0.6968, 0.6959, 0.6948, 0.6928, 0.6916 and 0.6894. Here, we are following the development of the downward structure of May 7th. Short-term downward movement is expected in the range of 0.6928 - 0.6916. For the potential value for the downward trend, we consider the level of 0.6894. The movement to which is expected after the breakdown of the level of 0.6916. Care in the correction is possible after the breakdown of the level of 0.6948. Here, the goal is the level of 0.6959. Short-term upward movement is expected in the range of 0.6959 - 0.6968. The breakdown of the latter value will have to form an ascending structure. In this case, the potential target level is 0.6986. The main trend is the downward structure of May 7. Trading recommendations: Buy: 0.6948 Take profit: 0.6959 Buy: 0.6970 Take profit: 0.6984 Sell : 0.6926 Take profit : 0.6916 Sell: 0.6914 Take profit: 0.6896 For the euro / yen pair, the key levels on the H1 scale are: 123.59, 123.26, 123.05, 122.50, 122.32, 121.92, 121.80 and 121.51. Here, we follow the formation of the local structure for the bottom of May 10th. Continuation of the movement to the bottom is expected after the passage of the price of the noise range 122.50 - 122.32. In this case, the first goal is the level of 121.92. Meanwhile, in the range of 121.92 - 121.80, there is a consolidation. For the potential value for the bottom, we consider the level of 121.51. After reaching which, we expect a rollback to the top. Short-term upward movement is expected in the range of 123.05 - 123.26. The breakdown of the last value will have to form an upward structure. In this case, the first target is the level of 123.59. We consider the level of 123.93 to be a potential value for the top, to which we expect the registration of expressed initial conditions. The main trend is the local downward structure of May 10. Trading recommendations: Buy: 123.05 Take profit: 123.24 Buy: 123.28 Take profit: 123.59 Sell: 122.30 Take profit: 121.94 Sell: 121.80 Take profit: 121.51 For the pound / yen pair, the key levels on the H1 scale are : 141.88, 141.33, 140.97, 140.23, 139.68, 139.15 and 138.45. Here, we are following the development of the downward structure of May 10th. Continuation of the movement to the bottom is expected after the breakdown of the level of 140.23. In this case, the goal is the level of 139.68, wherein consolidation is near this level. The breakout of the level of 139.68 will lead to the movement to the level of 139.15. From this level, there is a high probability of a reversal to the top. For the potential value for the bottom, we consider the level of 138.45. After reaching which, we expect a rollback to the top. Short-term upward movement is possible in the range of 140.97 - 141.33. The breakdown of the latter value will lead to in-depth correction. Here, the target is the level of 141.88. This level is a key support. The main trend is the local downward structure of May 10. Trading recommendations: Buy: 140.97 Take profit: 141.31 Buy: 141.34 Take profit: 141.88 Sell: 140.22 Take profit: 139.70 Sell: 139.66 Take profit: 139.15 The material has been provided by InstaForex Company - www.instaforex.com |
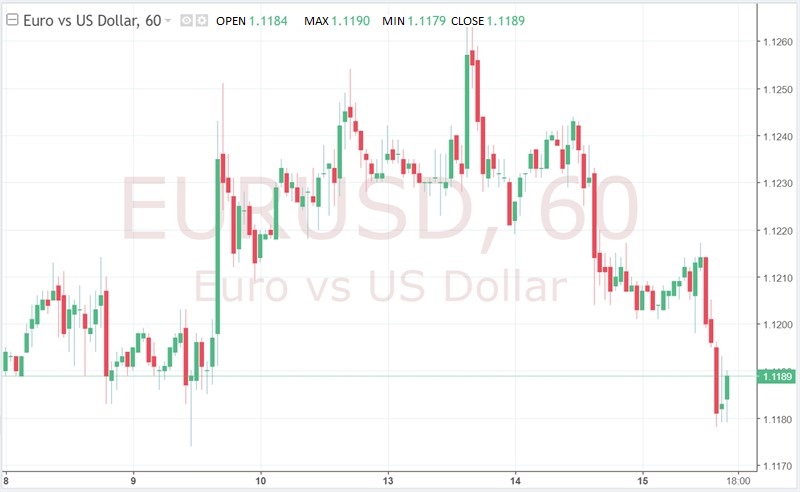
| EUR/USD 3 Star Sell Signal | Fundamental + Technical Analysis Posted: 15 May 2019 05:47 PM PDT
Fundamentals: Heightened transatlantic tensions drove the currency lower as EU is ready to retaliate against $23 billion of US goods with US auto tariffs deadline of 18 May approaching. Those duties would be based on the same national - security grounds invoked for controversial American levies on foreign steel and Aluminum. US tariffs on European cars and auto parts will mark a significant escalation of transatlantic tensions because the value of EU automotive exports to the America market is about 10 times greater than that of the bloc's steels and aluminum exports combined. Hence, if the auto tariffs are imposed, EU retaliatory duties would target a bigger amount of US exports to Europe. Elsewhere, Italian 2 year yield rose sharply while EUR plummeted on as Italy Deputy Prime Minister Matteo Salvini said the nation is ready to break EU fiscal rules if necessary to boost employment. Technical analysis: Price is starting to break an ascending support line and we expect it to drop further to 1.1180. It reacted perfectly from our resistance level yesterday and is on track to reaching its profit target. The material has been provided by InstaForex Company - www.instaforex.com |
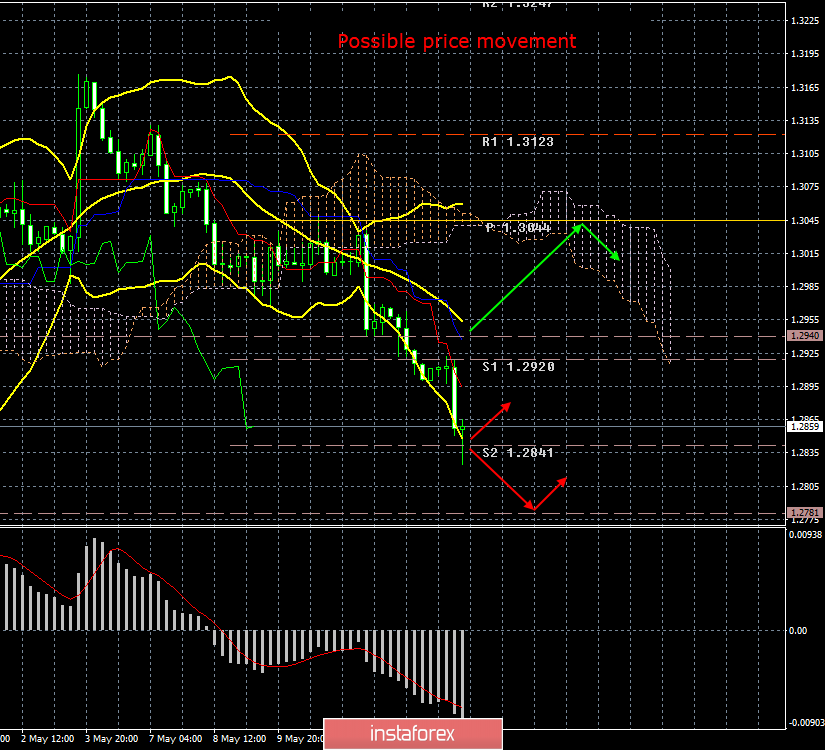
| Posted: 15 May 2019 03:31 PM PDT 4-hour timeframe The amplitude of the last 5 days (high-low): 93p - 69p - 57p - 100p - 69p. Average amplitude for the last 5 days: 78p (82p). Despite the fact that today there were no macroeconomic publications in the UK, and very weak macroeconomic data came from the United States, the pound sterling continued to fall against the US currency. It seems that the optimism of traders have dried up once again. Theresa May is still trying to negotiate with Labour in order to gain at least some kind of additional support before the new Parliamentary vote on the same document, which has already been voted for three times. I wonder what the point is with more and more new votes if nothing changes in the document. Even if the Parliament approves the "deal" with the EU, what will it look like from the outside? Parliament was three times against this "deal" - and suddenly approved it! In general, from our point of view, it is not surprising that the pound is falling again. By the way, today the pound/dollar pair overcame the previous local low - 1.2865. Thus, based on technical analysis, it is also possible to predict a downward movement. The ichimoku indicator clearly indicates a downward trend. The price rebound from the support level of 1.2841 can provoke and, most likely, will trigger a round of upward correction, after which we can expect the resumption of a downward trend. The MACD indicator may soon begin to discharge, since it is at fairly low levels. The pair will consolidate until tomorrow morning. No important reports are planned for tomorrow, but now the pair is also concerned about the topic of the trade war between China and the United States, as well as, of course, the topic of Brexit and the events around it. Trading recommendations: GBP/USD continues its downward movement. Therefore, now it is recommended to either maintain sell orders that were opened earlier, or wait for the completion of the correction, due to a rebound from the level of 1.2841, and then resume shorts with a goal of 1.2781. Buy orders can be considered in small lots only when the price has consolidated above the Kijun-sen line with the first target of the pivot level at 1.3044. In addition to the technical picture, also take into account the fundamental data and the time of their release. Explanation of the illustration: Ichimoku indicator: Tenkan-sen - the red line. Kijun-sen - the blue line. Senkou Span A - light brown dotted line. Senkou Span B - light purple dotted line. Chikou Span - green line. Bollinger Bands indicator: 3 yellow lines. MACD Indicator: Red line and histogram with white bars in the indicator window. The material has been provided by InstaForex Company - www.instaforex.com |
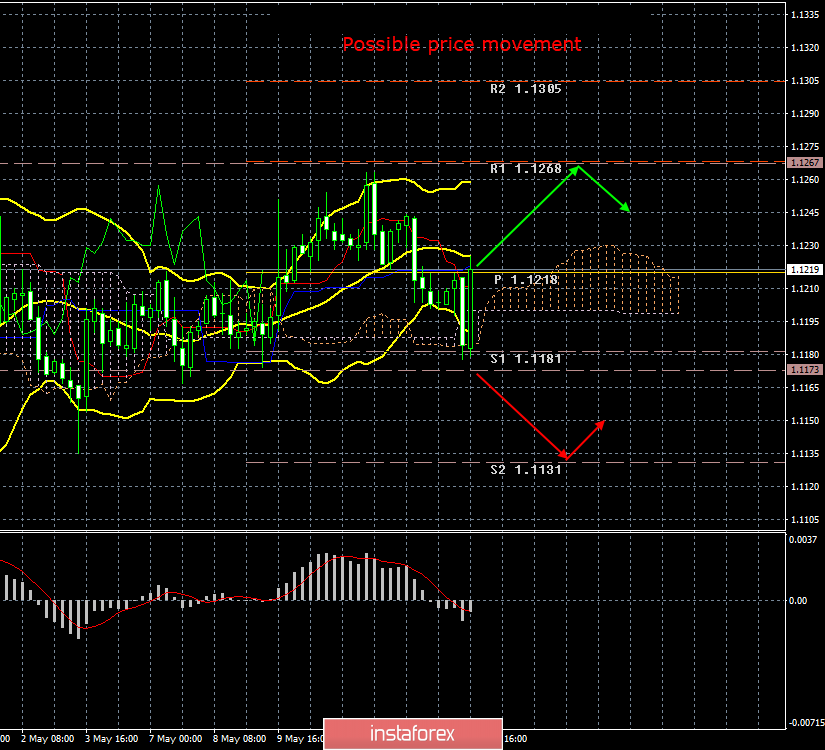
| EUR/USD. May 15. Results of the day. Donald Trump continues to threaten China with new tariffs Posted: 15 May 2019 03:31 PM PDT 4-hour timeframe The amplitude of the last 5 days (high-low): 31p - 77p - 41p - 42p - 43p. Average amplitude for the last 5 days: 47p (48p). The EUR/USD started the third trading day of the week exactly as planned. Macroeconomic reports from the eurozone did not impress or surprise traders at all. The preliminary GDP value of the largest economy - Germany - for the first quarter fully complied with the forecast of 0.7% y/y. The same applies to the GDP of the entire eurozone. +1.2% in the first quarter. Thus, the euro currency continued to fall against the US dollar on May 15. During the US trading session, traders had to be a little nervous, since most of them probably had already tuned in to the new downward trend, and both American reports on industrial production and retail sales failed. There were reductions in short positions, which led to a rebound in prices from the support level of 1.1181. However, we believe that these weak reports will not change the general mood of traders and selling will still resume, just after a short pause. In the meantime, Donald Trump managed to make a statement regarding the escalation of the trade conflict with China. There was a solemn phrase "America has been treated unfairly for many years," and the US president also argued that the negotiations did not come to a standstill. Trump said that negotiations with China continue and this dialogue is "good." In general, in the end, countries are likely to agree, because in general, trade war is not beneficial to anyone. Although, of course, it is China that will suffer more from it, since it exports much more goods to the United States than it receives in the opposite direction. On the other hand, Trump uses his favorite weapon in the negotiations - threats, understanding that it is more unprofitable for Beijing to fight with the United States. Trading recommendations: The EUR/USD continues to move down. Therefore, it is now recommended that you consider sell orders with a target of 1.1131, but after overcoming the level of 1.1173, since the pair rebounded from this level. Buy-positions can be returned if traders manage to gain a foothold back above the critical line. In this case, the first target for the longs will be again be the resistance level of 1.1268. In addition to the technical picture, you should also take into account the fundamental data and the time of their release. Explanation of the illustration: Ichimoku indicator: Tenkan-sen - the red line. Kijun-sen - the blue line. Senkou Span A - light brown dotted line. Senkou Span B - light purple dotted line. Chikou Span - green line. Bollinger Bands indicator: 3 yellow lines. MACD Indicator: Red line and histogram with white bars in the indicator window. The material has been provided by InstaForex Company - www.instaforex.com |
| EUR/USD. Trump drove the pair to a "roller coaster" Posted: 15 May 2019 03:31 PM PDT The euro-dollar pair continues to demonstrate a wave-like movement within a given price band of 1.1170-1.1240. Today, bears of the pair made another attempt to put pressure amid the general growth of anti-risk sentiment in the market and loud statements by Italian politicians who rebelled against budgetary restrictions from the European Union. But during a period of the US session, the pair sharply turned by 180 degrees and even managed to update its high of the day, reaching 1.1225. Although a further increase in prices remains a big question, the downward blitzkrieg also ended in failure - at least within the framework of today. EUR/USD bears were let down by US president Donald Trump. To be precise, the pair turned on the rumors that Trump would postpone the introduction of 25 percent customs duties on imports of European cars. In February, he announced that he would take a decision until May 18, after which he periodically "reminded" his European colleagues about such intentions. Let me remind you that in July last year, following the results of the meeting between Donald Trump and Jean-Claude Juncker, the parties agreed not to introduce additional trade duties and barriers. Instead, Washington and Brussels set up a working group on trade relations, whose members have been engaged in sluggish negotiations on import duties on steel and aluminum all this time. However, since then no additional agreements or decisions have been taken: Juncker was able to "put out the fire" then, and, by and large, only managed to delay the problem. According to rumors, the head of the EC called for Trump to create a customs agreement - between the United States and the EU, as well as with third countries exporting cars. According to the overwhelming majority of experts, this idea was initially doomed to failure, given the position of Trump under the conditional name "America first." Therefore, it should be recognized that the problem of trade relations between the US and the EU has not disappeared at all, and in the coming days such a reminder will surface. The European Union (primarily Germany) is the largest exporter of cars in the world, while the United States are the largest buyers. According to some estimates, the cost of European cars delivered to the US is almost ten times higher than the supply of steel and aluminum, for which duties were introduced last year. Therefore, Trump's possible decision will be a painful blow to the European economy, which has just begun to show signs of recovery. In particular, according to analysts polled, the automotive sector in Germany alone could collapse by 12% literally in the first days after the introduction of 25 percent duties. This dynamic will pull down the German stock market, bonds, in turn, will affect investor sentiment in general, and the notorious "domino effect" will follow. In addition, Trump's actions in relation to the EU will entail retaliatory steps. For example, last year the European Union was preparing new duties on American goods worth a total of $20 billion for such a case. At the same time, the German foreign minister said that Europe would not allow discussions with the language of ultimatums, and the EU is ready to respond with symmetrical economic measures. I believe that today, in the conditions of the election campaign in the European Parliament, the rhetoric of German politicians is unlikely to soften. Thus, if the US president still opens the "second front" of the trade war, anti-risk sentiment in the foreign exchange market will increase again, providing support to the dollar. But according to American journalists, Trump is not sure that amid escalating tensions between the US and China, he should complicate relations with the European Union. According to journalists, many reputable economists, "go" in Trump's social circle, dissuade him from such a step, as do some of his advisers (among them, US Trade Representative Robert Lighthizer). If the US president listens to them and the White House officially postpones the resolution of this issue for half a year, then the EUR/USD pair will receive a reason for further corrective growth. However, even in this case it will be impossible to talk about the resumption of an upward trend: the bears will only lose a powerful trump card for price pressure, but no more. With a high degree of probability, the pair will continue to trade in the price range of 1.1170-1.1240, reacting reflexively to current macroeconomic data. The fundamental background for the pair will in any case be contradictory: the dollar is under the pressure of slowing US inflation and vague prospects from the Fed, while the euro is under the same pressure - but due to the ECB's soft position and the obstinacy of Italian politicians. We should also not forget about Brexit, whose prospects remain under a big question. In other words, in the near future, Trump could either aggravate the position of EUR/USD or maintain the flat movement within the above range. The material has been provided by InstaForex Company - www.instaforex.com |
| Euro and aussie suffer from China Posted: 15 May 2019 03:31 PM PDT Data from China pointed to a slowdown in the economy. Retail sales, industrial production, investment in fixed assets - all these indicators did not reach the forecast values, and this was significant. It seems that the effect of monetary policy easing in previous months and weeks has not yet had a tangible impact on the economy. It is not excluded that China needs additional incentives - more significant ones. EUR/USD Today, quotes of the EUR/USD pair went down to the round mark of $1.12 and began to develop a further retreat. The reasons for the pessimism of the European currency is sufficient both economically and politically. Next week there will be elections to the European Parliament. If euro skeptics get a good result, this will increase concern about the future of the EU. Recent lending data in the region signals a growing risk of a slowdown in the economy in the near future. An unpleasant surprise on Tuesday came from the indicator of business sentiment in Germany from ZEW. Instead of the expected growth, the indicator returned to negative territory. German business, as a rule, reacts sharply to the escalation of trade disputes. The EUR/USD pair may once again be under pressure in the event of a strengthening of the markets in the safe-haven assets. As a result of this, it can remain within the descending channel from the beginning of the year. AUD/USD Since mid-April, the AUD/USD pair has lost about 4%. Weak data from China and continuing concerns about trade wars fuel the downward trend. The Australian dollar continues its steady plunge into the area of 3-year lows. It should be noted that its fall against the dollar was supported by a large and increased volume, which is an indicator of the strength of sellers among major market participants. In addition, it is necessary to allocate a new resistance level of 0.6958, where a large volume is concentrated. Thus, it is necessary to look at short positions. Meanwhile, on Thursday morning, traders will focus on data on the Australian labor market, which remains strong. A new portion of good data may slightly ease the pressure on the Australian dollar. The material has been provided by InstaForex Company - www.instaforex.com |
| Trade wars increase the risk of pulling down EUR/USD Posted: 15 May 2019 03:31 PM PDT In recent days, the greenback has been strengthening in hopes that the trade war between Washington and Beijing will cause more damage to the economies of other countries than the US. However, it is hardly worth expecting that consumers and companies in the United States will be able to avoid problems. "If the White House introduces 25% import duties on remaining Chinese goods worth $325 billion, then the net income of the companies in the S&P 500 index will fall by 1.5%. This will be quite enough to suppress investment activity in the corporate sector," said Morgan Stanley strategist Mike Wilson. According to John Normand of JPMorgan Chase, the trade war could drive key US economic indicators to levels of recession. "The risk lies in the fact that some important indicators that fall under the influence of the exchange of tariffs, approach crisis levels. These are industrial activity, business activity indices, capital costs and corporate profits, "said the expert. According to UBS estimates, if the United States imposes tariffs of 25% on all Chinese imports, American GDP will lose 0.75-1% over the course of a year. Against the dollar, the yen is near its lowest values since the beginning of February. According to experts of Mizuho Bank, the potential to pull down theUSD/JPY pair is limited. "Technical indicators show that the greenback is oversold and the yen is overbought. Progress in the trade negotiations between Washington and Beijing could force Japanese investors to step up purchases of US currency, and foreign players to close longs in the yen," representatives of the bank said. Citigroup analysts, in turn, believe that one should not underestimate the consequences of the escalation of a trade war between the two largest economies in the world. "The development of a downward trend for USD/JPY under the prevailing conditions is the way of the least resistance. We believe that the idea of selling the pair with the expectation of a decline to 107.25 in the next two weeks is attractive. Moreover, the surge of volatility can return the rate to the level of 104," they said. It should be noted that the last time the USD/JPY pair was trading near this level was back in January, when news of a slowdown in Chinese GDP growth caused a sharp reduction in short positions in the yen. According to Citi, the new US tariffs could cut China's GDP by 0.5%, exports by 2.7%, and jobs by 2.1 million. In addition to China, the United States is changing its trade policy with the European Union. In February, the US Department of Commerce submitted a report to Donald Trump with a positive opinion on the negative impact on the US auto industry by importing cars and foreign-made components. The head of the White House had 90 days to get acquainted with the report and deliver a verdict. Deadline expires next Saturday. D. Trump can postpone the deadline, which Europeans and investors are hoping for, but could also introduce duties of up to 25% on imported cars and parts. Against this background, there is a rather high probability that euro traders can liquidate their positions before the decision is made by the US leader. This may create prerequisites for a decline in the EUR/USD pair in case support breaks at 1.1165-1.117. The "soft" monetary policy of the ECB, which provides for maintaining low rates for a long time, is now taking the side of sellers of the pair. |
| The dollar does not allow gold to shine Posted: 15 May 2019 03:31 PM PDT Donald Trump stopped the offensive rush of XAU/USD bulls, as he mentioned that the deal with China would be concluded earlier than what people thought and on favorable terms for the United States. Stock indices reacted to the words of the US president with friendly growth, and the improvement in the global risk appetite forced some buyers of gold to take profits. However, the market has long been accustomed to believe in actions rather than words, so without signs of a de-escalation of the trade conflict, the S&P 500 is unlikely to recover lost ground. Over the past 9 days, it closed in the red zone 6 times and lost about 3.9% of its value. The trade war has kept on going, which adversely affects international trade and allows the IMF to predict the slowest growth in global GDP since the global economic crisis of 2008. According to two of the three Bloomberg experts, China and the US will sign an agreement this year, almost one fifth of respondents believe that this will happen in 2020, about 13% of analysts think that the dispute will not be resolved within five years. 45% of 40 economists predict that in response to the slowdown in the US economy due to the adverse impact of high tariffs, the Fed will be forced to lower the federal funds rate. Donald Trump calls on the central bank to do it now in order to win the trade war. They say that Beijing will pour a lot of money into it to keep its economy afloat, and if Jerome Powell and his team do the same, then China will have to accept the conditions set by the United States. Reviving QE, according to the owner of the White House, can accelerate US GDP to 5%, and who can resist such a powerful rival? Fears about the fate of the world economy, falling stock indices and yields on treasury bonds, as well as an increase in the likelihood of the Fed's monetary expansion create fertile ground for the return of gold bulls. The growth of open interest in the precious metal market is a confirmation of this assumption. Dynamics of open interest in gold In my opinion, if it were not for the stability of the US dollar, gold would already have been quoted at least at $1320-1330 per ounce. It is interesting that the USD index positively perceived the words of Donald Trump regarding the signing of a contract with China and the associated rally of US stock indices. High rates of debt market in the United States relative to other developed countries deprive its currency unit of the status of the funding currency, therefore the escalation of the conflict leads to an increase in EUR/USD and a fall in USD/JPY and vice versa. Uncertainty adds fuel to the fire. Most likely, before the June meeting of Donald Trump and Xi Jinping at the G20 summit in Japan, the situation with the trade wars will not be clarified, which should be regarded as a bullish factor for XAU/USD. Technically, on the daily gold chart, the implementation of the "Wolfe Wave" pattern continues, the first target of which is located near the $1,320 mark per ounce. The breakthrough of resistance is in the form of the upper boundary of the downward trading channel which makes it possible for bulls to enter the operational space. The material has been provided by InstaForex Company - www.instaforex.com |
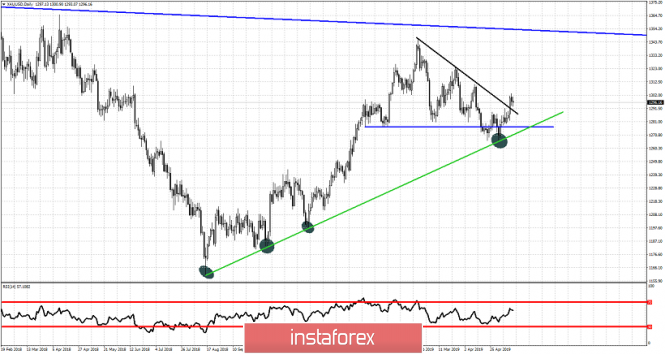
| Posted: 15 May 2019 01:31 PM PDT Gold price has made no progress today either to the upside or the downside. Gold price remains above the broken trend line resistance. Gold price has recently given a bullish sign, however price remains below the critical $1,300 level.
Green line - support Blue horizontal line- support Gold price is trading above the blue neckline support at $1,276 and above the broken black downward sloping trend line resistance that was recently violated to the upside. Gold price shows signs of a reversal, but today's price action was very light as price mainly consolidated near its recent highs just below $1,300. The RSI has not reached overbought levels yet so I believe we might have more upside in Gold price. The material has been provided by InstaForex Company - www.instaforex.com |
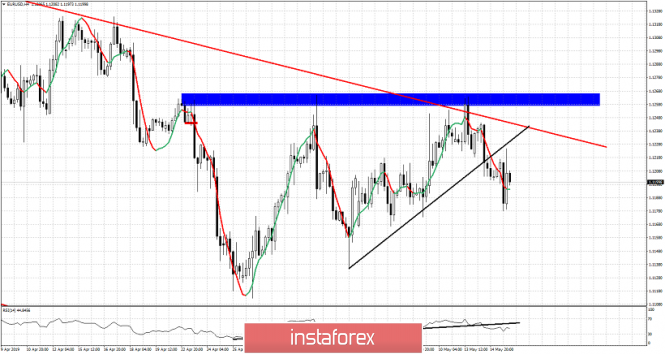
| EURUSD back tests broken short-term support and get rejected Posted: 15 May 2019 01:20 PM PDT EURUSD today bounced strongly back towards the broken support trend line and after back testing it price got rejected. Price action today gave another short-term bearish signal for EURUSD as bulls could not push price above 1.1230.
Blue rectangle - horizontal support Black lines- short-term support trend lines Yesterday EURUSD broke below the short-term upward sloping support trend line. Today price bounced for a back test and got rejected. Support is now found at 1.1180 and resistance at 1.1230. EURUSD has made no bullish move today so bulls have a lot of work if they want to change the trend in this pair. Bears remain in control of the short- and medium-term trend as long as price is below 1.1260. The material has been provided by InstaForex Company - www.instaforex.com |
| May 15, 2019 : EUR/USD Intraday technical analysis and trade recommendations. Posted: 15 May 2019 11:13 AM PDT
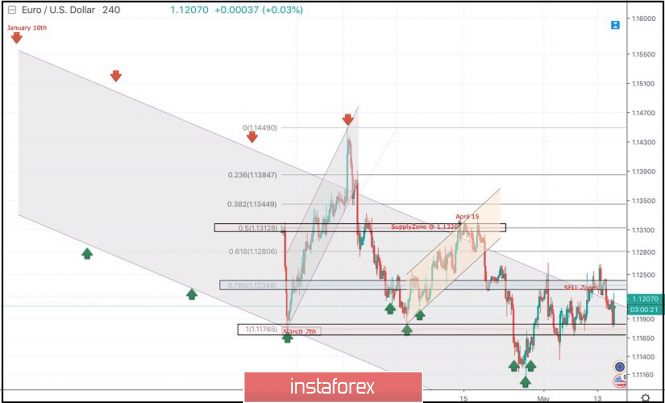
Few weeks ago, a bullish Head and Shoulders reversal pattern was demonstrated around 1.1200. This enhanced further bullish advancement towards 1.1300-1.1315 (supply zone) where significant bearish rejection was demonstrated on April 15. Short-term outlook turned to become bearish towards 1.1280 (61.8% Fibonacci) then 1.1235 (78.6% Fibonacci). For Intraday traders, the price zone around 1.1235 (78.6% Fibonacci) stood as a temporary demand area which paused the ongoing bearish momentum for a while before bearish breakdown could be executed on April 23. That's why, the price zone around 1.1235-1.1250 has turned into supply-zone to be watched for bearish rejection. On the other hand, the market has failed to sustain bearish pressure below the price Level of 1.1175 during last week's consolidations. That's why, another bullish pullback was expected to occur towards the price zone of 1.1230-1.1250 where significant bearish pressure managed to push the EURUSD towards 1.1175 once more. On the other hand, a bullish engulfing H4 candlestick has originated around 1.1180 earlier today. That's why, the pair remains trapped between the depicted key-levels (1.1175-1.1235) until breakout occurs in either direction. For the bearish side to regain dominance, early bearish breakout below 1.1175 is needed to pursue towards 1.1115. Trade recommendations : Conservative traders who were advised to have a SELL entry around the depicted supply zone (1.1235-1.1250) should lower their S/L towards 1.1235 to offset the associated risk. Initial Target levels should be located around 1.1200, 1.1175 and 1.1115. The material has been provided by InstaForex Company - www.instaforex.com |
| May 15, 2019 : GBP/USD Intraday technical analysis and trade recommendations. Posted: 15 May 2019 10:50 AM PDT
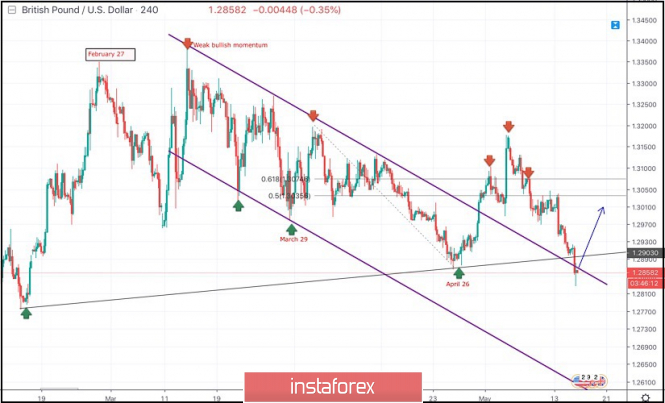
On March 29, the price levels of 1.2980 (the lower limit of the newly-established bearish movement channel) demonstrated significant bullish rejection. This brought the GBPUSD pair again towards the price zone of (1.3160-1.3180) where the upper limit of the depicted bearish channel was located. Since then, Short-term outlook has turned into bearish with intermediate-term bearish targets projected towards 1.2900 and 1.2850. On April 26, a bullish pullback was executed towards the price levels around 1.3035 - 1.3070 (50% - 61.8% Fibonacci levels) where temporary bearish rejection was demonstrated. Shortly after, a bullish breakout above 1.3075 was temporarily being demonstrated until bearish breakdown below 1.3035 (50% Fibonacci level) was achieved last week. Hence, a bearish Head and Shoulders pattern was being demonstrated on the H4 chart with neckline located around 1.2985. As anticipated, The price zone of 1.3030-1.3060 turned to become a prominent supply-zone where a valid bearish entry was offered by the end of last week's consolidations. Bearish persistence below 1.2985 (Neckline of the reversal pattern) enhanced further bearish decline. Initial bearish Targets were already reached around 1.2905-1.2850 (the backside of the broken channel) where another short-term bullish pullback is expected to be initiated towards 1.2985 before further bearish decline can occur. Trade Recommendations: For those who had a valid SELL entry around the price levels of (1.3035-1.3070). It's already running in profits. S/L should be lowered to 1.2920 to secure more profits. Risky traders can look for short-term bullish positions anywhere around 1.2850 with T/P level around 1.2900 and 1.2985. S/L to be located below 1.2800. The material has been provided by InstaForex Company - www.instaforex.com |
| Posted: 15 May 2019 08:07 AM PDT The data in the first half of the day on the German economy and the eurozone maintained the downward momentum of the euro against a number of world currencies. Berlin managed to avoid a recession at the end of last year, but further upward momentum, which was formed in the 1st quarter of 2019, raises a number of questions. Concerns about the prospects for world trade remain high. According to the report of the National Bureau of Statistics Destatis, the flagship economy of the eurozone in the 1st quarter of this year showed an increase of 0.4% compared with the previous quarter, which fully coincided with economists' forecasts. Most of the support was provided by the growth of private consumption in Germany, as well as by the construction industry. On an annualized basis, in the 1st quarter of 2019, Germany's economy grew by 0.6%, while economists had expected a 0.7% growth. As for the future prospects, the problems in world trade that remain due to the conflict between the United States and China, will continue to be a deterrent to economic growth, as German exports continue to face pressure. There is also a fairly high uncertainty around the UK exit from the EU. Against this background, it is not surprising that the overall simple GDP of the eurozone in the 1st quarter of this year was fairly restrained, but the recession was still avoided. According to the data, the eurozone economy grew in the 1st quarter of this year by 0.4% compared to the 4th quarter of 2018, and by 1.2% per annum. The data completely coincided with economists' forecasts. All the problems that affect Germany fully apply to the entire economy of the eurozone. As for the technical picture of the EURUSD pair, the movement continues to evolve under a bearish scenario, and the next target of risky assets sellers is the support area of 1.1160, a breakthrough of which will only increase the pressure on the trading instrument and lead to new lows of 1.1130 and 1.1100. The Canadian dollar ignored data on annual inflation in Canada, which accelerated slightly in April of this year. The increase was due to higher prices for cars and vegetables. According to the National Bureau of Statistics of Canada, CPI in April rose by 2.0% compared with the same period of the previous year. Economists also expected the index to grow by 2.0%. Compared with the previous month, the index in April rose by 0.4%, which contributed to the short-term increase in gasoline prices. As for the basic consumer price index, the figure in April rose by 1.9% after rising by 2%. Let me remind you that the target inflation rate is 2%. The material has been provided by InstaForex Company - www.instaforex.com |
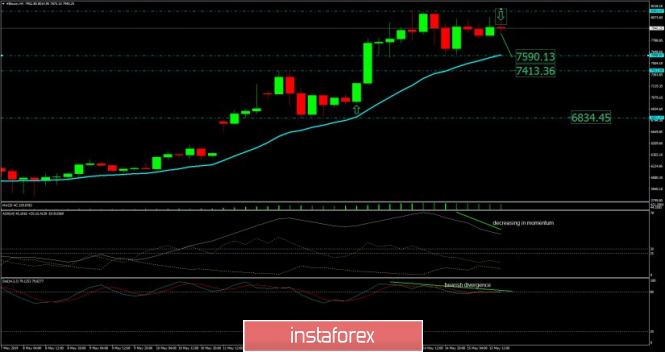
| Bitcoin analysis for May 15, 2019 Posted: 15 May 2019 07:09 AM PDT BTC has been trading sideways at the price of $7.944. We see potential for the pullback and downward correction.
According to the H4 time-frame, we found that there is momentum up decreasing, which is sign that buying looks risky. BTC is in extended run phase and potential pullback is expected. We found the bearish divergence on the slow Stochastic oscillator, which is another sign of the potential pullback incoming. The ADX is going down indicating potential weakness on BTC. Upward references: Swing high – $8.153 Downward: Swing low – $7.590 Previous high became support - $7.413 Swing low - $6.834 The material has been provided by InstaForex Company - www.instaforex.com |
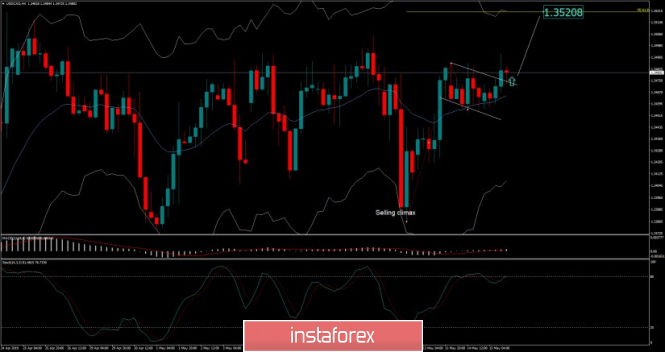
| USD/JPY analysis for May 15, 2019 Posted: 15 May 2019 07:00 AM PDT USD/CAD has been trading upside. The price tes
ted the level of 1.3492. We are expecting more upside on the USD/CAD. According to the H4 time-frame, we found that there is the breakout of the bullish flag and the rejection of the 20EMA, which is sign for the potential upside continuation. There is also a new up momentum on the MACD oscillator, which is another sign of the potential strength. We placed Fibonacci expansion to find potential upside target. We got Fibonacci expansion 61.8% at the price of 1.3520. Watch for buying opportunities with the target at 1.3520. Upward references are set: Swing high – 1.3504 Fibonacci expansion 61.8% - 1.3520 Downward references are set: Swing low – 1.3455 Major low – 1.3380 The material has been provided by InstaForex Company - www.instaforex.com |
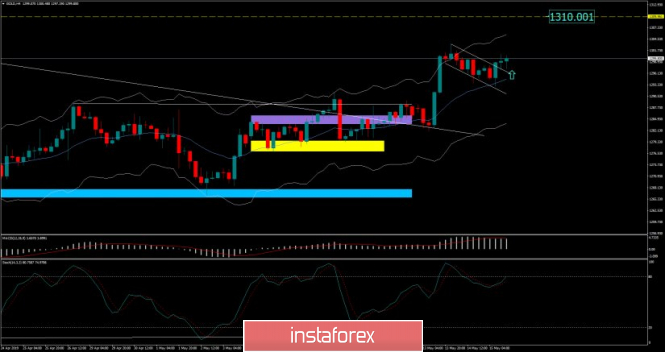
| Analysis of Gold for May 15, 2019 Posted: 15 May 2019 06:51 AM PDT Gold has been trading upwards in pat 12 hours as we expected. The price tested the level of $1.299. We are still expecting upside.
According to the H4 time-frame, we found that there is the breakout of the bullish flag and the rejection of the 20EMA, which is sign for the potential upside continuation. There is also a rising momentum on the MACD oscillator, which is another sign of the potential strength. Watch for buying opportunities with the target at $1.310. Upward references are set: Previous day high - $1.303 Daily swing high - $1.310 Downward references are set: Swing low - $1.292 Resistance became support - $1.288 The material has been provided by InstaForex Company - www.instaforex.com |
| Posted: 15 May 2019 06:05 AM PDT The mood of investors in world markets has somewhat improved on Tuesday due to new injections of "optimism" by the American president regarding negotiations with Beijing on trade. Trump has long been a newsmaker and conducts financial markets to his advantage. In recent months, a strong link has been established between Donald Trump's actions as president and the local stock market. If a few months ago, it was the dynamics or rather the collapse of the stock market and the rise of interest of market players in government bonds of the US Treasury that made Trump declare the need for the Fed to reduce interest rates and generally support the growth of stock indexes in every way, but now the opposite is true. By his decision to tighten the US position on trade negotiations with Beijing, the president meant raising customs duties of up to 25% on Chinese imports in the amount of $ 200 billion caused by the collapse of the local stock market, which naturally pulled the world markets along. And here, Trump began to save him, like Batman, with his Twitter entries in every way extolling the trade negotiation process. Moreover, the stock market did not remain in debt, as they say. It "rose up", however, it was not able to manage to compensate for the loss of Monday. This behavior of investors can be explained by the exercise of caution since it is already clear to everyone that negotiations have reached an impasse and can completely fail. But, oddly enough, the market is trying not to lose heart, hoping that the escalation of the trade war will ultimately force the Fed to lower interest rates to compensate for the impact of increasing customs duties and perhaps even in the near future. The regulator will have to resort to incentive measures, which will be positive for the growth in demand for risky assets and of course, this will put pressure on the US dollar as it was after the 2008 crash. Such a scenario keeps the dollar from its noticeable growth against competing currencies but at the same time there are still concerns that the US will fall into recession, in which case, the dollar will be in demand on the contrary. In general, the situation of uncertainty, which is already fed up with everything, will continue to generate high volatility in the stock and commodity markets. But it seems that currency markets will continue to stagnate until the situation with the prospect of not only trade relations between Beijing and Washington but also the world economy, which is completely cleared up. Forecast of the day: The EUR/USD pair is trading above the support level of 1.1200, forming the "ascending flag" figure. If this level resists, we should expect a price increase to 1.1270. At the same time, its breakthrough may lead to a promising local price drop to 1.1125. The AUD/USD pair remains under pressure in the wake of the uncertainty of the outcome of negotiations on trade between the US and China, as well as the publication of weak data on industrial production in China. The preservation of the negative can stimulate further price reduction first to 0.6900 and then to the local minimum of January 2016 at 0.6825. |
| GBP/USD: plan for the US session on May 15. The pound waited for news on Brexit Posted: 15 May 2019 06:01 AM PDT To open long positions on GBP/USD, you need: The technical picture has not changed compared with the morning forecast. Buyers of the pound, to stop the downward trend, need a return and consolidation above the level of 1.2930, which they lost yesterday in the afternoon after a small upward correction. Only above the range of 1.2930 can we expect a more substantial demand for the pound, which will lead to an update of the highs of 1.2983 and 1.3037, where I recommend fixing the profits. In the scenario of reducing GBP/USD and further, long positions are best to look at the rebound from the low of 1.2877-70. To open short positions on GBP/USD, you need: The lack of news on Brexit and disagreements between the UK parties are increasing the pressure on the pound. The goal of sellers today is to form a false breakdown in the resistance area of 1.2930, which will be the first signal to open short positions that could easily lead GBP/USD to the area of minimums 1.2870 and 1.2812, where I recommend fixing the profits. In the case of a pound rising above the resistance of 1.2930, short positions can be considered to rebound from a high of 1.2983. Indicator signals: Moving Averages Trading is below 30 and 50 moving averages, which indicates the bearish nature of the market. Bollinger Bands The volatility of the indicator has decreased, which does not give signals on entering the market. Description of indicators
|
| Posted: 15 May 2019 06:01 AM PDT To open long positions on EURUSD, you need: This morning I talked about the fact that the weak reports on the GDP of the eurozone and Germany would push the euro down, which is what happened. Buyers in the afternoon still need to return and consolidate above the resistance of 1.1220, which can only happen after US retail sales data. In this scenario, we can expect a new bullish momentum in order to update the highs of 1.1251 and 1.1275, where I recommend fixing the profits. If the pressure on EUR/USD continues further, purchases can be returned after the formation of a false breakdown in the support area of 1.1188, and it is best to rebound from a minimum of 1.1166. To open short positions on EURUSD, you need: Sellers did not even have to defend the level of 1.1220, which indicates the absence of real euro buyers. The task for the second half of the day is a correction to the intermediate support area of 1.1188, however, the main purpose of the bears today will be to return and consolidate below this level, which will push EUR/USD down to the minimum area of 1.1166, where I recommend fixing the profits. In the case of the euro growth scenario, against the background of weak data on the US economy, it is best to open short positions on a rebound from the maximum of 1.1251. Indicator signals: Moving Averages Trading is conducted below 30 and 50 moving averages, which indicates the preservation of the downward correction. Bollinger Bands In the case of euro growth in the second half of the day, it will limit the upward movement of the upper border of the indicator in the area of 1.1220. Description of indicators
|
| Control zones of USD/JPY pair on 05/15/19 Posted: 15 May 2019 05:46 AM PDT Work in the current phase of correction involves the search for favorable prices for the sale of the instrument. The 1/2 WCZ of 109.98-109.89 will be the determining resistance. As long as the pair is trading below this zone, the bearish momentum will continue with a probability of 70% and update the May low. This must be used to enter a position or to keep sales already open. Within the 1/2 WCZ, there is a significant level and above which, one could observe an accumulation of limit orders last week. The test of this range should be used to search for the "false probe" pattern. To change the downward impulse to a bullish one, it will be necessary to close today's trading above 109.98. This will lead to a change in the market phase. The goal of growth will be the weekly CZ of 110.94-110.77 and the probability of the movement will increase to 70%. Do not forget that while this model is auxiliary and the probability of its implementation does not exceed 30%. Daily CZ - daily control zone. The area formed by important data from the futures market, which changes several times a year. Weekly CZ - weekly control zone. The area formed by marks from the important futures market, which changes several times a year. Monthly CZ - monthly control zone. The area is a reflection of the average volatility over the past year. The material has been provided by InstaForex Company - www.instaforex.com |
| Posted: 15 May 2019 05:06 AM PDT Wave counting analysis: On May 14, the GBP / USD pair lost another 55 basis points. Yesterday in the UK, reports were issued on unemployment (down to 3.8%) and on changes in average wages (a rise of 3.2%). The unemployment outlook was worse, and the wage was better. Thus, the overall news background was neutral for the pound. Nevertheless, the markets continued to sell the pound, which once again makes us pay attention to Brexit. According to the latest information, the UK will take part in the elections to the European Parliament despite the fact that in the coming months, it wants to leave the EU. Theresa May determined the new date of voting for her Brexit project - June 3. A pound sterling reacts to this by a fall, and a successful attempt to break through the minimum of the wave y will indicate that the pair is ready for a new decline. However, the wave pattern remains extremely ambiguous and confusing. Purchase goals: 1.3182 - 61.8% Fibonacci 1,3259 - 76.4% Fibonacci Sales targets: 1.2867 - 0.0% Fibonacci General conclusions and trading recommendations: Wave picture suggests a continuation of the pair 's decline. Thus, now, I recommend selling the pair with targets located around 1.2867, which corresponds to 0.0% Fibonacci, and you can save if you successfully try to break through the sale. Nevertheless, the wave pattern of the previous weeks is characterized by frequent and deep correctional waves- you should be careful with the MACD reversals. The material has been provided by InstaForex Company - www.instaforex.com |
| Wave analysis of EUR / USD for May 15. Euro: new entry to update the lows. Posted: 15 May 2019 05:06 AM PDT Wave counting analysis: On Tuesday, May 14, trading ended for EUR / USD by 20 bp lower. The volume of industrial production of the European Union in March decreased by 0.6%, while the sentiment index in the business environment of the ZEW Institute turned out to be completely negative (-1.6). Thus, the news support for the euro currency was absent. The wave pattern again shows the pair's readiness to build a new descending wave, presumably 3, 3, 3. If this is true, then the decline will continue from the current positions with targets located under the 11 figure. Today, I recommend paying attention to reports on changes in the volume of industrial production and retail sales in America. Strong values may force markets to continue buying US currencies. Two unsuccessful attempts to break through the 50.0% Fibonacci level also speak in favor of a downward wave. Sales targets: 1.1097 - 161.8% Fibonacci 1.1045 - 200.0% Fibonacci Purchase goals: 1.1324 - 0.0% Fibonacci General conclusions and trading recommendations: The pair is still in the process of building a downward trend. The current wave counting suggests a continuation of the pair's decline with the targets of 1.1097 and 1.1045, which corresponds to 161.8% and 200.0% Fibonacci. Thus, now, I recommend selling a pair with these goals and restrictive orders above the 50.0% Fibonacci level. The material has been provided by InstaForex Company - www.instaforex.com |
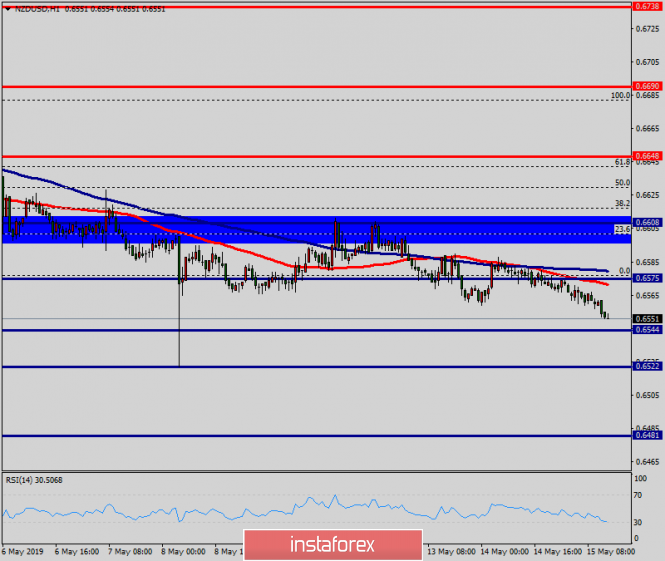
| Technical analysis of NZD/USD for May 15, 2019 Posted: 15 May 2019 04:34 AM PDT Overview: Pivot: 0.6605. The NZD/USD pair is showing signs of weakness following a breakout of the lowest level of 0.6648. On the H1 chart, the level of 0.6648 coincides with 23.6% of Fibonacci, which is expected to act as minor support today. Since the trend is below the 23.6% Fibonacci level, the market is still in a downtrend. However, the major resistance is seen at the level of 0.6690. Furthermore, the trend is still showing strength above the moving average (100). Thus, the market is indicating a bearish opportunity below the above-mentioned support levels, for that the bearish outlook remains the same as long as the 100 EMA is headed to the downside. Therefore, strong resistance will be found at the level of 0.6690 providing a clear signal to buy with a target seen at 0.6575. If the trend breaks the minor resistance at 0.6575, the pair is likely to move downwards continuing the bearish trend development to the level 0.6544. The material has been provided by InstaForex Company - www.instaforex.com |
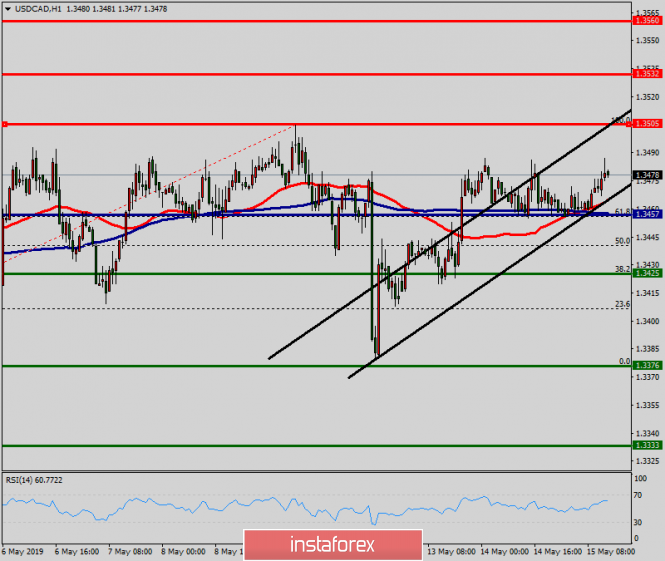
| Technical analysis of USD/CAD for May 15, 2019 Posted: 15 May 2019 04:20 AM PDT Overview: The USD/CAD pair continues to move upwards from the level of 1.3457. The pair rose from the level of 1.3457 (the level of 1.3457 coincides with a ratio of 61.8% Fibonacci retracement) to a top around 1.3505. But it rebounded from the top pf 1.3505 to 1.3477. Today, the first support level is seen at 1.3457 followed by 1.3425, while daily resistance 1 is seen at 1.3457. According to the previous events, the USD/CAD pair is still moving between the levels of 1.3505 and 1.3457; for that we expect a range of 48 pips (1.3505 - 1.3457). On the one-hour chart, immediate resistance is seen at 1.3505. Currently, the price is moving in a bullish channel. This is confirmed by the RSI indicator signaling that we are still in a bullish trending market. The price is still above the moving average (100), Therefore, if the trend is able to break out through the first resistance level of 1.3505, we should see the pair climbing towards the daily resistance at the levels of 1.3532 and 1.3560. It would also be wise to consider where to place stop loss; this should be set below the second support of 1.3425. The material has been provided by InstaForex Company - www.instaforex.com |


| You are subscribed to email updates from Forex analysis review. To stop receiving these emails, you may unsubscribe now. | Email delivery powered by Google |
| Google, 1600 Amphitheatre Parkway, Mountain View, CA 94043, United States | |
No comments:
Post a Comment