
Forex analysis review |
- EUR/JPY Approaching Major Resistance, Could We See A Big Drop?
- EUR/USD 5 Star Sell Signal | Fundamental + Technical Analysis
- EUR/USD. Not a trace of optimism remains: Trump is still in thought
- The growth of China's gold reserves is breaking records
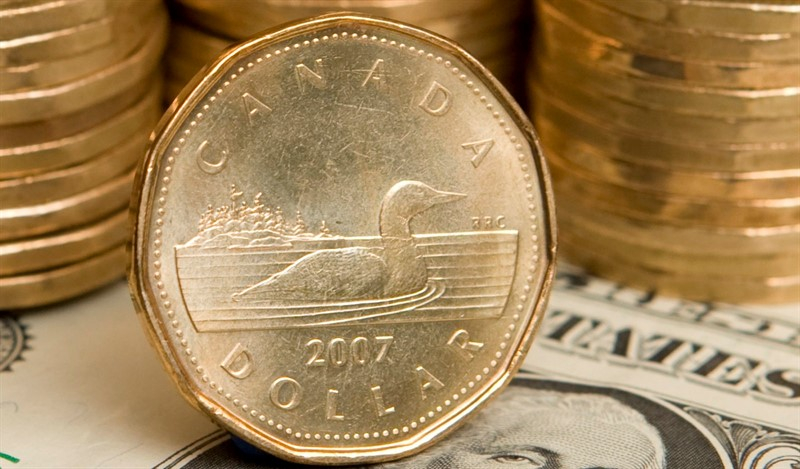
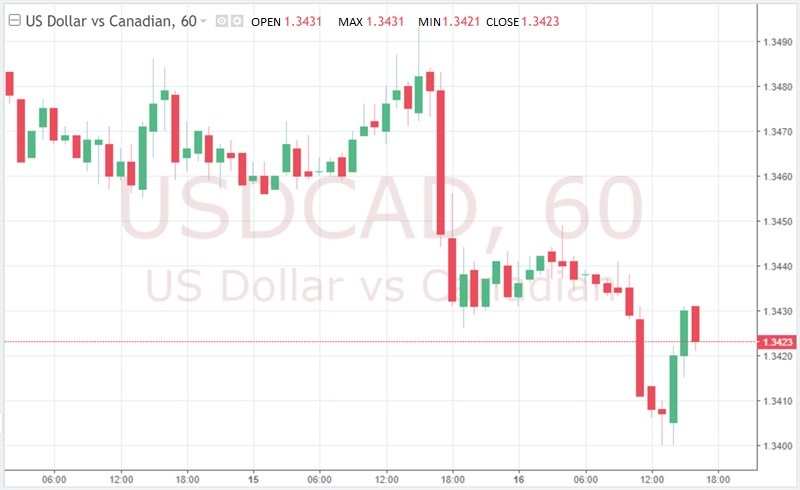
- USD/CAD: the loonie's potential to weaken remains
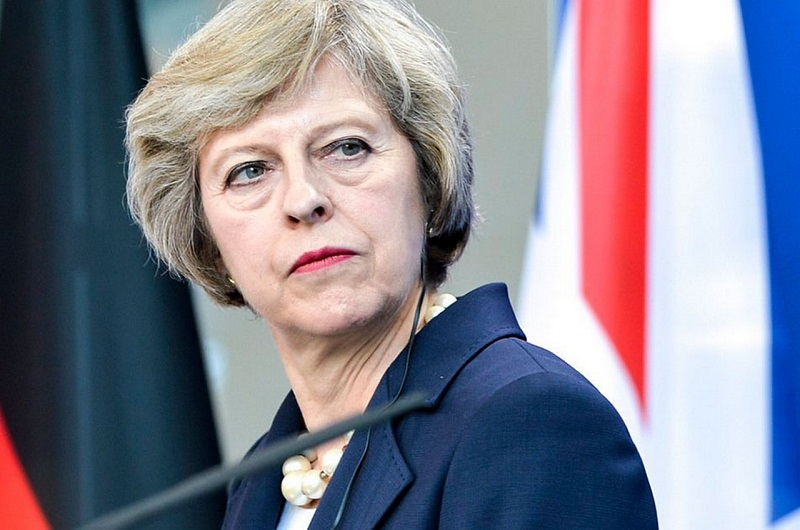
- May kicked out, what will happen to the pound?
- GBP/USD. 16th of May. Results of the day. Theresa May is asked to resign again
- EUR/USD. 16th of May. Results of the day. Donald Trump refused to conduct a trade war on two fronts
- Technical analysis of EURUSD for May 16, 2019
- Technical analysis of Gold for May 16, 2019
- May 16, 2019 : GBP/USD Intraday technical analysis and trade recommendations.
- Bitcoin analysis for May 16, 2019
- USD/JPY analysis for May 16, 2019
- EUR./USD analysis for May 16, 2019
- EUR and CAD: The euro continues to decline amid negative news, while the Canadian dollar strengthened its position
- GBP/USD: plan for the US session on May 16. The pound continues to move down, forming more bullish divergences
- EUR/USD: plan for the US session on May 16. The demand for US dollar returns
- Technical analysis of GBP/USD for May 16, 2019
- Technical analysis of EUR/USD for May 16, 2019
- The euro was inspired by the fact that Trump can spare Europe and the pound is still hostage to Brexit
- Control zones for Bitcoin on 05/06/19
- GBP/USD 5 Star Sell Signal | Fundamental Analysis
- The Fed, reassuring everyone, does not know what to do: Expecting further decline in the AUD/USD and NZD/USD pairs
- Trading recommendations for the GBPUSD currency pair - placement of trading orders (May 15)
- NZD/USD testing an intermediate support, could we see a bounce?
| EUR/JPY Approaching Major Resistance, Could We See A Big Drop? Posted: 16 May 2019 06:47 PM PDT
Description : EURJPY near key resistance, a drop to first support is possible Entry: 123.26 Why it's good :100% Fibonacci extension, 38.2% & 23.6% Fibonacci retracement, horizontal swing high resistance Stop Loss : 124.25 Why it's good :100% Fibonacci extension,50% Fibonacci retracement,horizontal swing high resistance Take Profit : 122.10 Why it's good: 61.8% Fibonacci extension, horizontal swing low support The material has been provided by InstaForex Company - www.instaforex.com |
| EUR/USD 5 Star Sell Signal | Fundamental + Technical Analysis Posted: 16 May 2019 06:43 PM PDT
Currently we can see that price dropped perfectly to our support as expected from yesterday's forecast. Now we expect it to bounce up a bit, maybe 50+ pips to 1.1258 before reaching our 1st resistance level. If it reaches that level, we can see a strong reaction and can sell from there. The material has been provided by InstaForex Company - www.instaforex.com |
| EUR/USD. Not a trace of optimism remains: Trump is still in thought Posted: 16 May 2019 03:58 PM PDT Yesterday, there was no trace of optimism from EUR/USD traders. Rumors that Trump will postpone the imposition of duties on the import of European cars have not gained any real form, despite the widespread announcement of this decision. According to US Secretary of Commerce Wilbur Ross, the president is still thinking about this, and the final decision will be made on Saturday, May 18. At the same time, he clarified that at the moment all options for the development of further events are being considered - including the option of introducing fees. Given this ambiguous rhetoric, EUR/USD traders have to go through an alarming weekend, as the odious Trump can present a very unpleasant surprise. Although the likelihood of a new trade war is relatively small, it cannot be ruled out. In such conditions, it was difficult for the European currency to count on correctional growth, so today the price has returned to the area of the 11th figure again. However, Trump is not the only problem of the single currency. The euro is under pressure and other fundamental factors. In particular, today it became known that the eurozone trade surplus (seasonally adjusted) fell to 17.9 billion euros, whereas in the previous reporting period, in February, this figure was 20.6 billion euros. The surplus was also lower than the forecast values (which amounted to 19.4 billion euros). Disappointed with the weak growth of exports - the figure increased by only 0.9%, while imports grew by 2.5%. On the one hand, these figures are belated (let me remind you that we learned the March figures today) - but on the other hand, they again reminded traders of the precariousness of economic growth in Europe. Italian politicians are also distressing traders of the pair. Let me remind you that this week Italy, represented by Deputy Prime Minister Salvini, stated that it was ready to break the EU budget rules in order to reduce unemployment. According to him, the Italian Cabinet of Ministers intends to reduce the unemployment rate from 10% to 5%, even if it will be necessary to increase the budget deficit (exceeding the 3% debt-to-GDP ratio ceiling) and temporarily increase the national debt. Although half a year ago, the Italians managed to literally avoid a disciplinary action by Brussels (in the form of a fine of 0.2% of GDP), they are now aggressively returning to populist and anti-European rhetoric. Of course, this behavior can be explained by the election campaign in the European Parliament. Nevertheless, Italian politicians, regardless of the elections, will have to make difficult decisions, fulfilling EU requirements. In particular, we are talking about value added tax. Even the predecessors of the current government wanted to raise the VAT, but they managed to shift this "mission" to the current composition of the cabinet of ministers. The leaders of the League and 5 stars, even before the Parliamentary elections, promised not to let the sales tax increase - and now they don't change the tone of their rhetoric. In turn, the Minister of Economy and Finance Giovanni Tria has already warned that in order to cancel the increase in VAT, the authorities need to additionally find 23 billion euros per year. In other words, when discussing the budget for the next year, this issue will be an edge: either the sales tax increases, or Rome reduces expenses. All other options are fraught with disciplinary action by the European Union. Against the background of mutual accusations, relations between Rome and Brussels deteriorate again, and this fact does not bypass the markets. Traders get rid of Italian government bonds, buying German bonds instead, which look more reliable (especially against the background of rising inflation and GDP in Germany). All this led to the fact that the spread between the yields of government bonds reached three-month highs, thereby putting pressure on the single currency. Thus, the prevailing fundamental picture allows EUR/USD bears to test the support level of 1.1130 again (the bottom line of the Bollinger Bands indicator on the daily chart). If we talk about the prospects of declining to the 10th figure, then a more heavy reason is needed - for example, if Trump still decides to open a "second front" of the trade war. If the US president postpones this issue until the end of this year (and announces his decision until the end of the trading week), then a strong corrective pullback to the mid-12th figure is likely. Furthermore, traders of the pair should pay attention to tomorrow's inflation rate in the eurozone (final data for April will be published). The preliminary estimate turned out to be much better than expected - the general consumer price index jumped to 1.7%, while core inflation rose to 1.2%. According to the overwhelming majority of experts, these figures will not be revised downward. This fact may provide additional support for the euro. However, the hypothetical correctional growth also has its price ceiling - in this case, it stands at 1.1270 - this is the lower boundary of the Kumo cloud, which coincides with the upper line of the Bollinger Bands indicator on the daily chart. The material has been provided by InstaForex Company - www.instaforex.com |
| The growth of China's gold reserves is breaking records Posted: 16 May 2019 03:58 PM PDT According to some analysts, Chinese authorities are showing a growing appetite for increasing the country's gold reserves. Last week, the central bank of China announced its purchase of a record amount of the precious metal. Analysts are certain that this is not the limit, and that China will continue to increase its reserves of the yellow metal. Last week, the financial authorities of China released a statement, which confirmed the growth of the country's gold reserves by 14.9 tons, to a mark of more than 1900 tons in April of this year. According to analysts, the gold reserves of China have been growing for five months in a row. Since December 2018, the Chinese regulator has increased their volume by 58 tons. Note that from October 2016 to November last year, Chinese authorities did not disclose information about their gold reserves. Analysts believe that this indicates the absence of official purchases. Analysts of the precious metals market are confident that the real volume of gold reserves in China is much more than official sources say. According to the World Gold Council, at the end of 2018, 1,506 tons of ferrous metal were imported into the country, and 17 tons were exported, while the precious metal production was 404 tons. Some experts have suggested that the Chinese authorities are not telling the whole truth, so as not to cause a rise in world prices for the yellow metal. At present, China is also the main holder of US state bonds. In 2010, China's share in US government bonds was 14%. At the moment, it does not exceed 5%, although experts are confident that the trend to diversify international reserves will continue with the help of the yellow metal. The material has been provided by InstaForex Company - www.instaforex.com |
| USD/CAD: the loonie's potential to weaken remains Posted: 16 May 2019 03:58 PM PDT After another failure of an attempt to break through the 1.3500 mark yesterday, the USD/CAD pair dropped sharply against the background of a steady increase in oil prices due to the escalation of the conflict in the Middle East. Today, oil prices continued to grow, which supported the loonie. Interest in the loonie was also driven by optimism about the abolition of tariffs from the United States for the supply of metals from Canada. On the eve of the US Treasury Secretary Stephen Mnuchin said that the United States is close to resolving the dispute on steel and aluminum tariffs with Canada and Mexico. It is assumed that if the new trade agreement between the United States, Mexico and Canada is not ratified, Washington and Ottawa will still be able to find a common language in trade matters. Given that the United States accounts for 75% of all Canadian exports, it is clear that this is in the interests of both countries. According to experts, despite the local strengthening, the loonie still retains the potential for weakening. According to data released on the eve, in April, the value of the basic consumer price index in Canada on an annualized basis decreased from 1.6% to 1.5%. This dynamics of core inflation, apparently, reflects the problems with the activity of consumers in the domestic market. It is possible that under such conditions, the Canadian central bank will have to return to the issue of lowering the interest rate. Today, the head of the Bank of Canada Stephen Poloz is set to speak, in the course of which he may well hint at the open question of further easing of the monetary rate, especially given the continuing uncertainty in foreign trade. The material has been provided by InstaForex Company - www.instaforex.com |
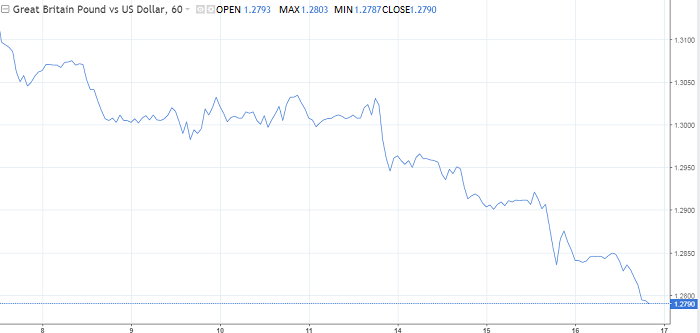
| May kicked out, what will happen to the pound? Posted: 16 May 2019 03:58 PM PDT Market participants have lost faith in the fact that the British prime minister will be able to cope with the heat of passion. "She has failed, and her authority has been undermined," according to May's former co-workers. On Wednesday, the pound fell to its lowest level in three months, and dropped to $1.2790 by Thursday at the end of the European session. The annual low has been updated, what next? Today, Theresa May meets with party members who want to oust her from the post of prime minister. She had faced such pressure before, but this time everything is much more serious. The chances of adopting her Brexit plan look extremely weak, the deputies' patience is running out. Earlier this week, May promised to present her plan in early June. So she wants to win more time for herself. By the way, Donald Trump is scheduled to visit the United Kingdom at the same time. Here the question arises, will she be able to hold out these extremely disturbing few weeks? According to sources, representatives of the Tories are very serious and will insist on the early resignation of the British prime minister. MPs may require Theresa May to leave her post until mid-June, and if this does not happen, they can initiate a new vote on a vote of no confidence. Boris Johnson has confirmed that he will submit his candidacy as a receiver to May. Earlier, the prime minister agreed to leave her post only in exchange for the approval of her version of the agreement. Note that the British pound in tandem with the US dollar showed a significant and sharp drop in large volumes. This is an excellent "bearish" signal, since it means that it is the big players who continue to push the price down. The material has been provided by InstaForex Company - www.instaforex.com |
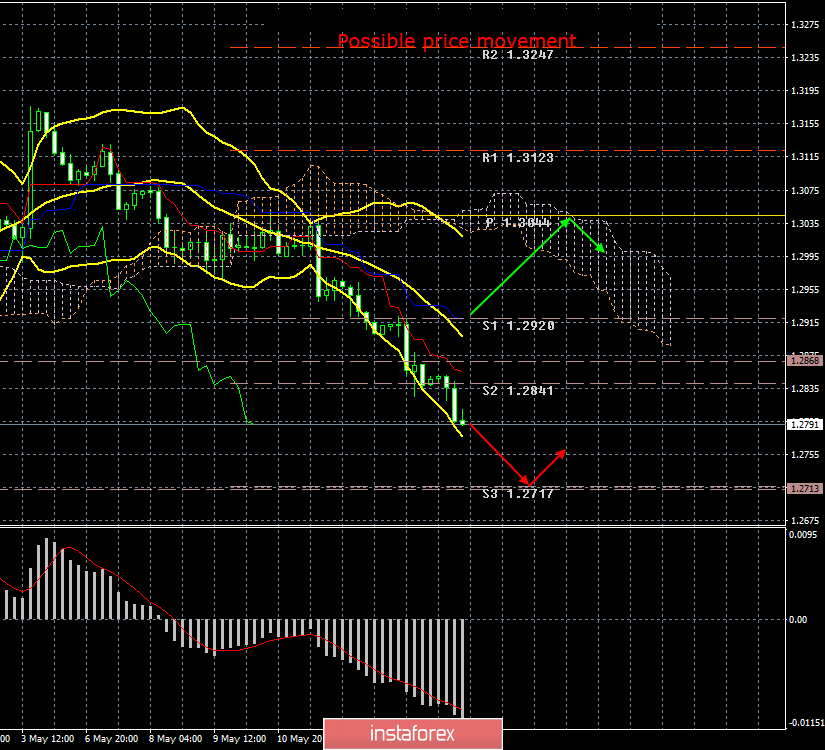
| GBP/USD. 16th of May. Results of the day. Theresa May is asked to resign again Posted: 16 May 2019 03:42 PM PDT 4-hour timeframe The amplitude of the last 5 days (high-low): 69p - 57p - 100p - 69p - 97p. Average amplitude for the last 5 days: 78p (78p). The pound sterling has stepped into its most terrible stage. A stage of systematic but daily decline. Usually, strong falls are often replaced by strong corrections. The most dangerous thing for any currency is when it loses its positions every day. That is what is happening with the British currency. Meanwhile, Theresa May is dismissed by her own party members. It seems that the prime minister will be able to move Brexit from a "dead center", but no one believes in this, neither party members, nor the Parliament, nor the European Union, nor traders. Theresa May is invited to voluntarily resign immediately after the elections to the European Parliament. If she refuses again, they can put forward a new vote of no confidence. It seems that the chances for parliamentary approval of this vote are much greater than the chances for the adoption of the entire same draft agreement on Brexit from the fourth attempt. There is no information about a breakthrough in the negotiations between the Conservatives and Labour. Accordingly, a vote on June 3 in Parliament may once again turn into a farce. I wonder what will May's reaction be, if the Parliament refuses to accept her version of Brexit for the fourth time? And what will be the reaction of the world community to the fact that Britain had voted 4 times for the same deal? Although the reaction of the world community can already be judged by the statement of the main candidate for the post of European Commission President Manfred Weber, who compared Brexit with the series "Game of Thrones" on steroids. In general, the pound has only one road - downwards. A reversal of the MACD indicator to the top will indicate the beginning of an upward correction, but the indicator may also begin to discharge, since it is already at its lowest position. Trading recommendations: The GBP/USD pair continues its downward movement. Therefore, it is now recommended to maintain sell orders opened earlier, with a target of a support level of 1.2717. Buy orders can be considered in small lots only when the price has been consolidated above the Kijun-sen line with the first target of a pivot level of 1.3044, which is not expected in the near future. In addition to the technical picture, also take into account the fundamental data and the time of their release. Explanation of the illustration: Ichimoku indicator: Tenkan-sen - the red line. Kijun-sen - the blue line. Senkou Span A - light brown dotted line. Senkou Span B - light purple dotted line. Chikou Span - green line. Bollinger Bands indicator: 3 yellow lines. MACD Indicator: Red line and histogram with white bars in the indicator window. The material has been provided by InstaForex Company - www.instaforex.com |
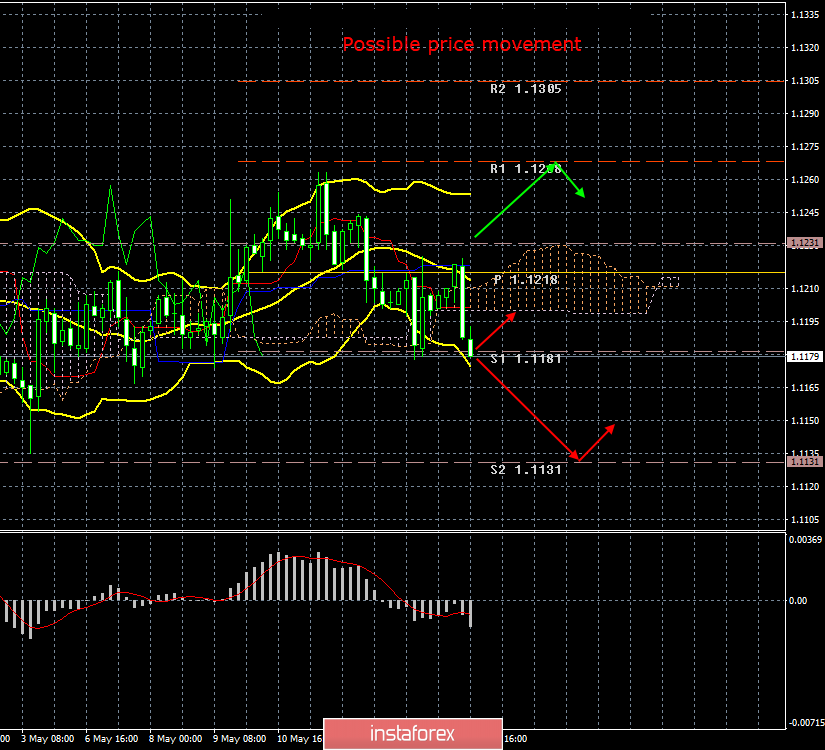
| EUR/USD. 16th of May. Results of the day. Donald Trump refused to conduct a trade war on two fronts Posted: 16 May 2019 03:22 PM PDT 4-hour timeframe The amplitude of the last 5 days (high-low): 77p - 41p - 42p - 43p - 47p. Average amplitude for the last 5 days: 50p (47p). In recent days, the EUR/USD currency pair clearly can not determine the direction of its movement. First, traders are happy to buy the dollar, but only intraday, on the news about the escalation of the trade conflict with China. Then they buy the dollar on the news that Trump has postponed the decision to impose trade duties on the European auto industry. In this case, it is extremely important to pay close attention to the technical picture. The graph clearly shows that every next highest price is lower than the previous one. Although there are some corrections, there is a steady downward trend in 2019. Just a few days ago, the pair made another attempt to move above the previous high. It was unsuccessful. Thus, we currently expect an update of the previous low, the level of 1.1111 in particular. There were no important macroeconomic reports today in the European Union nor in the United States. Secondary reports from the US were unambiguously in the dollar's favor (the number of applications for unemployment benefits is less than the forecast, the number of houses being built is more than the forecast). Meanwhile, Donald Trump signed a decree imposing a national emergency in communications in connection with a threat to national security. As you can guess, we are talking about Chinese suppliers of equipment and, first of all, Huawei. A national emergency is introduced for a period of one year. The reason is the US leader's suspicion that China can conduct espionage at various levels with the help of its equipment imported into the US. We are also talking about banning the sale of Huawei's US parts. Trading recommendations: The EUR/USD pair has adjusted to the critical line and is now trying to resume a downward movement. Just like the day before, it is recommended to consider sell orders with a target of 1.1131, but after overcoming the level of 1.1181, since the pair could rebound from this level again. Buy-positions can be returned if traders manage to consolidate above the critical line. In this case, the first target for longs will be the resistance level of 1.1268. In addition to the technical picture also take into account the fundamental data and the time of their release. Explanation of the illustration: Ichimoku indicator: Tenkan-sen - the red line. Kijun-sen - the blue line. Senkou Span A - light brown dotted line. Senkou Span B - light purple dotted line. Chikou Span - green line. Bollinger Bands indicator: 3 yellow lines. MACD Indicator: Red line and histogram with white bars in the indicator window. The material has been provided by InstaForex Company - www.instaforex.com |
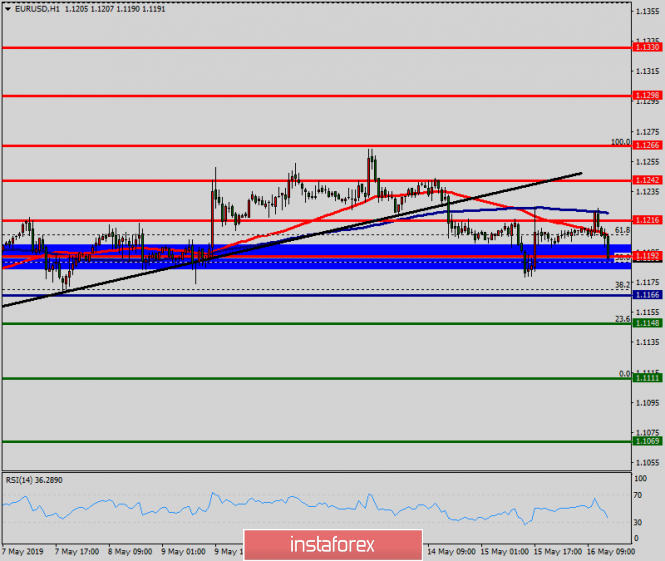
| Technical analysis of EURUSD for May 16, 2019 Posted: 16 May 2019 01:07 PM PDT Bulls made another try today at the 1.1230 resistance but price got rejected again. EURUSD is now challenging 1.1170 support. Bulls need to act now otherwise we should expect a move towards 1.11 and lower. Trend remains bearish as long as price is below 1.1260.
Black line - trend line support Blue rectangle - resistance Red line - upper channel boundary resistance EURUSD continues to make lower lows and lower highs. EURUSD is challenging important short-term support and could very well break it and move towards 1.11 and lower. Resistance is at 1,1230 and next at 1.1260. Price continues to trade inside the medium-term trend bearish channel. Trend remains bearish. The material has been provided by InstaForex Company - www.instaforex.com |
| Technical analysis of Gold for May 16, 2019 Posted: 16 May 2019 01:02 PM PDT Gold price pulled back below $1,290 after reaching and testing the resistance of $1,300. As we said in previous posts Gold price made an important break above $1,288 but we also needed to keep an eye on $1,300. So far Gold shows reversal signs after bottoming at $1,266 but bulls will need to defend $1,276.
Blue horizontal line - neckline support Black line - short-term resistance Gold price is turning back below the black trend line that it recently broke upwards. Gold has support at $1,276 and this is the most important level to watch. Breaking below it will open the way for a move below $1,266 towards $1,250-30 area. If Gold price holds above $1,280-76 and breaks $1,300 then we should expect Gold price to see at least the 2019 highs again. The material has been provided by InstaForex Company - www.instaforex.com |
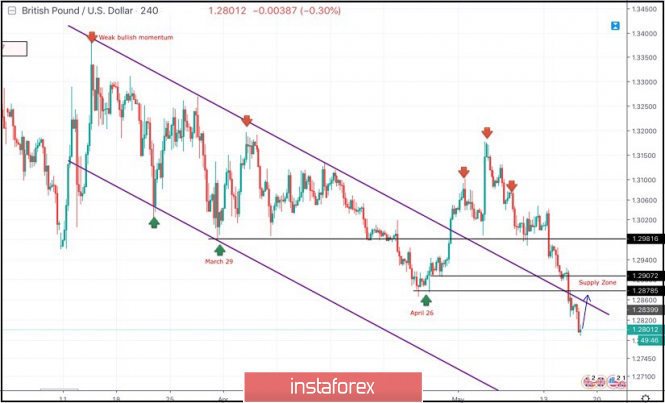
| May 16, 2019 : GBP/USD Intraday technical analysis and trade recommendations. Posted: 16 May 2019 09:23 AM PDT
On March 29, the price levels of 1.2980 (the lower limit of the newly-established bearish movement channel) demonstrated significant bullish rejection. This brought the GBPUSD pair again towards the price zone of (1.3160-1.3180) where the upper limit of the depicted bearish channel was located. Since then, Short-term outlook has turned into bearish with intermediate-term bearish targets projected towards 1.2900 and 1.2850. On April 26, a bullish pullback was executed towards the price levels around 1.3000 (the bottom of March 29) where bearish rejection was demonstrated. Hence, a bearish Head and Shoulders pattern was being demonstrated on the H4 chart with neckline located around 1.2985. As anticipated, The price zone of 1.3030-1.3060 turned to become a prominent supply-zone where a valid bearish entry was offered by the end of last week's consolidations. Bearish persistence below 1.2980 (Neckline of the reversal pattern) enhanced further bearish decline. Initial bearish Targets were already reached around 1.2900-1.2870 (the backside of the broken channel) which is failing to provide any immediate bullish support for the GBPUSD pair. Trade Recommendations: For those who had a valid SELL entry around the price levels of (1.3035-1.3070). It's already running in profits. S/L should be lowered to 1.2860 to secure some profits. Conservative traders should wait for another bullish pullback towards 1.2870-1.2905 (newly-established supply zone) to look for valid sell entries. S/L should be placed above 1.2950. The material has been provided by InstaForex Company - www.instaforex.com |
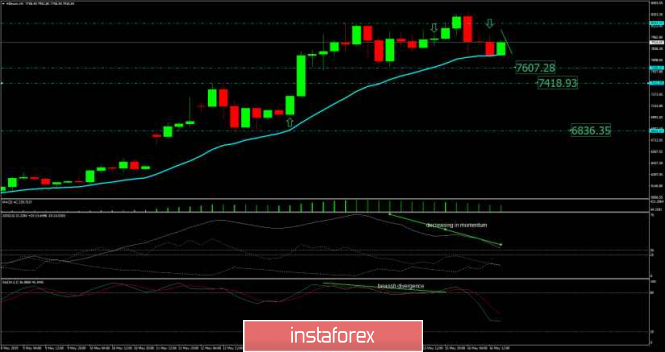
| Bitcoin analysis for May 16, 2019 Posted: 16 May 2019 08:17 AM PDT BTC has been trading sideways at the price of $7.895. Our bearish scenario is still valid and we expect more downside.
According to the H4 time-frame, we found that bullish momentum continues with decreasing, which is sign that buying looks risky. BTC is in extended run phase and potential pullback is expected. We found the bearish divergence on the slow Stochastic oscillator, which is another sign of the potential pullback incoming. The ADX is going down indicating potential weakness on BTC. Additionally, there is the fake breakout of the high $8.153. Watch for selling opportunities. Upward references: Swing high – $8.153 Downward: Swing low – $7.590 Previous high became support - $7.413 Swing low - $6.834 The material has been provided by InstaForex Company - www.instaforex.com |
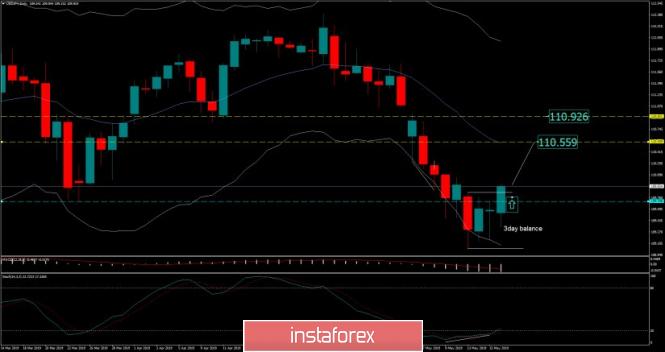
| USD/JPY analysis for May 16, 2019 Posted: 16 May 2019 08:10 AM PDT USD/JPY has been trading upside. The price tested the level of 109.94 The breakout of 3-balance is present. Watch for buying opportunities.
According to the Daily time-frame, we found that there is the breakout of the 3-day balance, which is sign that buyers too control from sellers. We also found bullish divergence on the Stochastic oscillator and rejection of the lower Keltner band at 109.07. Watch for buying opportunities with targets at 110.55 and 11.92. Downwards references are set: Balance high – 109.83 Daily low – 109.30 Upward references are set: 20 EMA – 110.56 Swing low acting like resistance – 110.92 The material has been provided by InstaForex Company - www.instaforex.com |
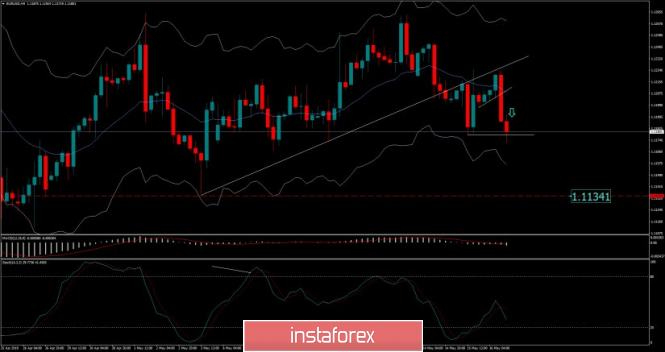
| EUR./USD analysis for May 16, 2019 Posted: 16 May 2019 07:59 AM PDT Gold has been trading downwards in pat 8 hours. The price tested the level of 1.1172. We are still expecting more downside.
According to the H4 time-frame, we found that there is the breakout of the upward trendline (support) in the background, which is sign that there is change in trend dynamic from bullish to bearish. Additionally, we found successful re-test of the broken support at 1.1220, which is another sign of the weakness. Watch for selling opportunities on the rallies with the potential target at 1.1134. Upward references are set: Previous swing low became resistance – 1.1197 Daily swing high – 1.1224 Downward references are set: Swing low – 1.1134 The material has been provided by InstaForex Company - www.instaforex.com |
| Posted: 16 May 2019 07:30 AM PDT The euro continues to remain under pressure after an unsuccessful morning attempt to get out of the large resistance level of 1.1215. The eurozone balance sheet report put pressure on the pair in the first half of the day, as its decline was recorded. However, economists can breathe a little, as yesterday the administration of President Donald Trump postponed the decision to impose import duties on cars from Europe. According to the data, the trade surplus fell to 17.9 billion euros in March of this year from 20.6 billion euros in February. The reduction was due to the fact that imports grew faster than exports. Excluding the correction, the eurozone's foreign trade surplus in March was 22.5 billion euros and against 26.9 billion euros in March 2018. As for trade with the United States, the balance fell to 33.9 billion euros from 36.2 billion euros a year earlier. Exports from the EU to the United States in the 1st quarter, though growing, imports were even more. The report indicates that compared to the same period in 2018, US exports grew by 8.2%, while EU imports from the US grew by 16.3%. As for the technical picture of the EURUSD pair, it remained unchanged compared with the morning forecast. After an unsuccessful attempt to grow the euro above the resistance of 1.1215, pressure on the trading instrument resumed. The bears almost pushed EURUSD to the support of 1.1180, the breakthrough of which would lead to a larger sale in the area of 1.1150 and 1.1100. The USDCAD pair fell today after the release of a good report on sales in the manufacturing sector of Canada, which showed quite strong growth. This once again confirms the regulator's expectations that the Canadian economy has overcome a period of temporary weakness. According to the Bureau of Statistics of Canada, sales in the manufacturing sector in March 2019 increased by 2.1% compared with the previous month and amounted to 57.97 billion Canadian dollars. Economists had expected growth of only 1.7%. The Australian dollar continues to be under pressure after the morning report, in which it was shown that the unemployment rate in Australia rose in April, despite the increase in the number of jobs. According to the Australian Bureau of Statistics, unemployment in Australia rose to 5.2%. In March, unemployment was 5.1%, against a previous estimate of 5.0%. The number of jobs increased by 28,400, while economists expected growth of 15,000. The share of the economically active population rose to 65.8% versus 65.7% in March. The material has been provided by InstaForex Company - www.instaforex.com |
| Posted: 16 May 2019 07:12 AM PDT To open long positions on GBP/USD, you need: The pound continued to decline in the first half of the day, however, bullish divergences on the MACD indicator continue to form, which may lead to the end of the intraday downward trend at any time. The task of the bulls in the afternoon will be to return to the resistance level of 1.2812, which will lead to the closure of a number of short positions and a larger upward correction in the maximum area of 1.2877, where I recommend fixing the profits. In the scenario of further decline of GBP/USD on the trend, it is best to look at long positions on the rebound from the minimum of 1.2769. To open short positions on GBP/USD, you need: Bears have coped with the task of securing below the level of 1.2812, and while trading is conducted under this range, the pressure on the pound will remain. The main goal of sellers for the second half of the day is a minimum of 1.2769, where I recommend fixing the profit. In the scenario of a return to the resistance of 1.2812, it is best to consider new short positions for a rebound from the maximum of 1.2877. Indicator signals: Moving Averages Trading is below 30 and 50 moving averages, which indicates the bearish nature of the market. Bollinger Bands In the case of the pound growth in the second half of the day, the upper limit of the indicator in the area of 1.2865 will limit the upward movement. Description of indicators
|
| EUR/USD: plan for the US session on May 16. The demand for US dollar returns Posted: 16 May 2019 07:12 AM PDT To open long positions on EURUSD, you need: Another weak data on the eurozone economy led to a decline in the euro in the first half of the day. At the moment, only the formation of a false breakdown in the support area of 1.1183 will be a signal to open long positions in EUR/USD. Otherwise, buying the euro immediately to the rebound is best from a minimum of 1.1155. The main task of the bulls in the afternoon will be the return and consolidation above the resistance of 1.1215, which will open a direct road to the area of a weekly high of 1.1242, where I recommend fixing the profits. To open short positions on EURUSD, you need: Sellers managed to form a false breakdown in the resistance area of 1.1215, which led to a new wave of short positions in European currency. At the moment, the task of the bears is to breakdown and consolidate below the support of 1.1183, but the main goal remains at least 1.1155, where I recommend fixing the profits. In the case of the euro growth scenario in the second half of the day, it is best to open short positions to rebound from a maximum of 1.1242. Indicator signals: Moving Averages Trading is below 30 and 50 moving averages, which indicates the preservation of the downward correction. Bollinger Bands In the case of euro growth in the second half of the day, it will limit the upward movement of the upper border of the indicator in the area of 1.1220. Description of indicators
|
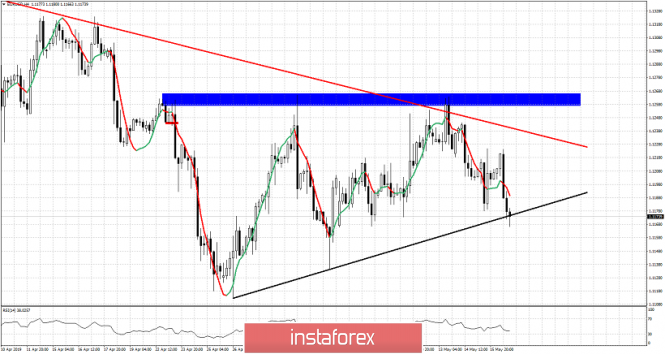
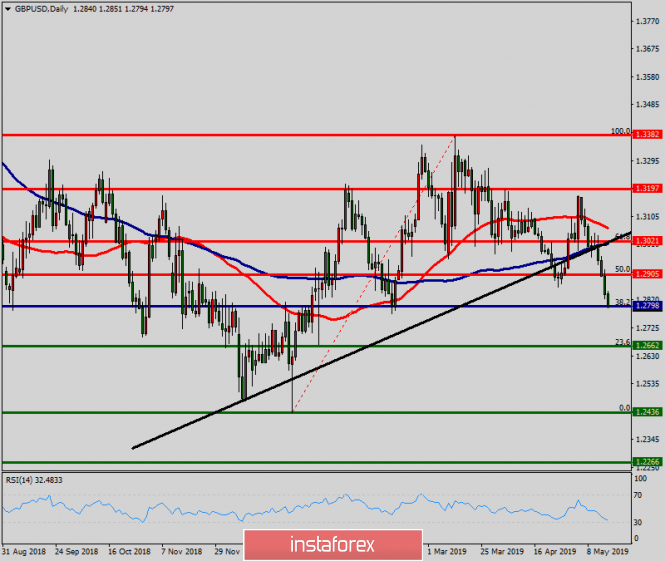
| Technical analysis of GBP/USD for May 16, 2019 Posted: 16 May 2019 06:29 AM PDT In the long term, the GBP/USD pair continues to move downwards from the level of 1.2905. This week, the pair rose from the level of 1.2905 to a top around 1.2800 and it set around the spot of 1.2800. The first resistance level is seen at 1.2905 followed by 1.2963 , while daily support 1 is seen at 1.2798 (38.2% Fibonacci retracement). According to the previous events, the GBP/USD pair is still moving between the levels of 1.2700 and 1.2610; so we expect a range of 90 pips in coming hours. Furthermore, if the trend is able to break out through the first support level at 1.2662, we should see the pair climbing towards the double bottom (1.2436) to test it later. Therefore, sell below the level of 1.2800 with the first target at 1.2610 in order to test the daily resistance 1 and further to 1.2436. Also, it might be noted that the level of 1.2436 is a good place to take profit because it will form a double bottom. On the other hand, in case a reversal takes place and the GBP/USD pair breaks through the resistance level of 1.2905, then the stop loss should be placet at 1.2930. The material has been provided by InstaForex Company - www.instaforex.com |
| Technical analysis of EUR/USD for May 16, 2019 Posted: 16 May 2019 05:58 AM PDT Pivot point: 1.1166. The EUR/USD pair continues to move downwards from the level of 1.1192. Last week, the pair dropped from the level of 1.1192 to the bottom around 1.1111. Today, the first resistance level is seen at 1.1192 followed by 1.1216, while daily support 1 is seen at 1.1111. According to the previous events, the EUR/USD pair is still moving between the levels of 1.1192 and 1.1111; for that we expect a range of 81 pips. If the EUR/USD pair fails to break through the resistance level of 1.1111, the market will decline further to 1.1069. This would suggest a bearish market because the RSI indicator is still in a positive area and does not show any trend-reversal signs. The pair is expected to drop lower towards at least 1.1069 with a view to test the second support. On the other hand, if a breakout takes place at the resistance level of 1.1192 (major resistance), then this scenario may become invalidated. Major support levels: 1.1069 | 1.1111 | 1.1148 Major resistance levels: 1.11216 | 1.1142 | 1.1266 The material has been provided by InstaForex Company - www.instaforex.com |
| Posted: 16 May 2019 04:59 AM PDT On the eve, the EUR / USD pair managed to recover and overcome the 1.12 mark . The main driver of growth for the pair were the reports that US President Donald Trump plans to postpone the decision on customs duties on imports of cars from the EU to the United States for up to six months. According to CNBC sources, the head of the White House intends to postpone this decision in connection with the protracted trade conflict with the Middle Kingdom. The official statement of the American leader on this issue is expected closer to Saturday. "It seems that Donald Trump decided that it would be better, for now, to wage a trade war on one front and focus on China," said Shaun Osborne, chief currency strategist at Scotiabank. According to Goldman Sachs experts, the trade disputes of Washington and Beijing can put pressure on the single European currency, which will suffer from any sign of a slowdown in economic growth in the Middle Kingdom. Moreover, according to experts, the European Central Bank is a step closer to easing the monetary rate - much closer than the US Federal Reserve. According to the forecast of Goldman Sachs, the euro may fall in price against the dollar to $1.10 over the next 3 months. The British currency has become the main outsider. On the eve, the GBP/USD pair could not use the stabilization at the level of 1.2900 to return at least above the level of 1.2920. News that the British government could not find a common language with the opposition. Although it didn't become a big surprise, it turned out to be a sufficient reason to send the GBP/USD pair to the figure below. Negotiations of the Labor Party and the Conservatives are likely to continue, but the behavior of investors suggests that they do not really believe in reaching a compromise. Meanwhile, the pressure on Theresa May is growing as they are expected to have a date of resignation, but she made it clear that she would not leave her post until Parliament approves the "divorce" agreement with the European Union. Considering that no significant changes were made to the document and inter-party negotiations have yet come to nothing, it is highly likely that another vote on the deal in the House of Commons scheduled for the first week of June will fail. It should be recognized that the overall performance of the British economy is consistently good, especially compared to the EU, but the continuing uncertainty on the Brexit does not allow the pound to recover. It is possible that the next stop for the GBP/USD pair may be the 1.2773 mark. |
| Control zones for Bitcoin on 05/06/19 Posted: 16 May 2019 04:30 AM PDT Now, Bitcoin is in the process of forming a defining model. If there are willing to sell the instrument at such favorable prices, this will lead to the formation of a correctional model. The purpose of the correction will be to return first to the range of the average move of the week and then possibly, to the month. The first target is at $7,800 per bitcoin. Closing trades above this mark will indicate a 90% chance of returning to it next week. Now, you need to find a pattern that will allow you to open a corrective sale or block purchases for those who are already in a long position. It is important to understand that the current momentum is strong, therefore, it is necessary to follow simple rules for partially fixing sales and quickly moving positions to breakeven in order to work in the opposite direction. An alternative model has a probability of less than 30% and continues to grow Bitcoin to the next psychological mark. Updating today's high and closing trades above will indicate continued growth. This will force them to get rid of sales opened by the "false breakdown" pattern of yesterday's extremum. A bargain shopping zone will start at $7,500, thus, the first sales fixation will also be required in the event of a depreciation. Daily CZ - daily control zone. The area formed by important data from the futures market, which changes several times a year. Weekly CZ - weekly control zone. The area formed by marks from the important futures market, which changes several times a year. Monthly CZ - monthly control zone. The area is a reflection of the average volatility over the past year. The material has been provided by InstaForex Company - www.instaforex.com |
| GBP/USD 5 Star Sell Signal | Fundamental Analysis Posted: 16 May 2019 03:30 AM PDT
FUNDAMENTALS: Pound extended its decline to a 3 month low on escalating trade tensions between US and China and fading optimism that Brexit can be resolved. Sterling is the worst performer among its peers this week as the market is unconvinced that the UK Parliament can get her Brexit deal through the Parliament on the fourth try next month. With the opposition Labour saying that they would not support the bill in the current form, which Theresa May aims to pass it through the Parliament by June 3, it suggests a higher risks of a hard Brexit in November if Theresa May steps down, raising concerns about the prospect of an economically damaging deal. Options traders have increased bearish bets on the currency this week while asset managers remain short and leveraged funds cut their net long position to the lowest since March, according to latest data from the Commodity Futures Trading Commission. The material has been provided by InstaForex Company - www.instaforex.com |
| Posted: 16 May 2019 02:57 AM PDT Fed officials continue to calm themselves and financial markets, despite the fact of trade standoff as the US economy feels pretty good Such thoughts are presented by all heads of federal banks, without exception, including Fed Chairman Jerome Powell. Thus, head of the Federal Reserve Bank of Richmond, Tom Barkin, echoed his colleagues, discussing the state of the American economy and the prospects for interest rates on Wednesday. He noted that there is "a sense to maintain patience on the prospect of a change in rates given the current economic climate in the United States," that there is no reason for either raising or lowering them. At the same time, he reported that the economy is healthy and economic growth "remains healthy." In general, everything is good and just need to wait. Indeed, the latest data shows the annualized GDP growth to be 3.2%, the inflation rate at a comfortable level of 2.0%, and the unemployment rate of 40-year low at 3.6%. The numbers are really impressive and the statements of officials that the trade war with China will not cause significant damage to the country and probably reassure someone, but not the financial markets. Bidders are still cautious. They note that the main indicators of the state of the American economy are clearly showing signs of a slowdown and added yesterday's retail sales data for April, which not only fell in growth but drop by 0.2%. The core retail sales index fell to 0.1% from 1.3%, while it was expected to decline in growth to 0.7%. In addition, the second quarter GDP estimate for the Atlanta Federal Reserve Bank, which shows a drop in GDP growth in the second quarter to 1.1% from 1.6% makes one think. An important point is also the dynamics of real private investment within the country, which decreased in the second quarter from 3.2% and -3.7% to 3.0% and -5.7%, respectively. Given the lack of clear certainty in the future, the business will not be active in investing in its own business and a possible failure in negotiations with the Chinese will be a catalyst for negative processes in the American economy, contributing to its inhibition. While the Federal Reserve, investors and financial markets are actually frozen in anticipation of a denouement, which is still not coming. On this wave, there is high volatility in the stock and commodity markets but the foreign exchange market seems to be quite still for a long period of time to remain "boring" because of the pause, which the world central banks actually occupied and not only did they watched everything. Forecast of the day: The AUD/USD pair remains in a downtrend in the wake of uncertainty as a result of trade negotiations between the US and China. We expect the continuation of a smooth decline in prices to a local minimum of 0.6825 after overcoming the mark of 0.6900. The NZD/USD pair is also trading lower amid the lack of positive news on the negotiations between the Americans and the Chinese. We expect the continuation of a smooth decline in prices to 0.6525 and then to 0.6500. |
| Trading recommendations for the GBPUSD currency pair - placement of trading orders (May 15) Posted: 16 May 2019 02:09 AM PDT For the last trading day, the pound / dollar currency pair showed high volatility of 94 points. As a result, a rapid decline continues--taking another profit from the market. From the point of view of technical analysis, we see that the bearish interest has not gone away and our predicted coordinates, 1.2920 - 1.2880, have been reached. Now, in an orderly manner, the correctional phase on May 9 made it possible to regroup the trading forces, due to which we dashingly broke through the level of 1.3000 held by us, but then we had an inertial move that overtook a number of periodic levels on its way. At the same time, we do not overlook the price fixing below the local minimum of 1.2865 (April 25), which was quite unexpected due to the growing overheating. So what supported the sellers? In fact, for a long time I have been trying to convey the idea that a pound fall in relation with their problems in Britain, but this is not what happened on the information background. The Conservative Party of Great Britain is already in a rather rigid form, by June 15, it is necessary to submit a draft agreement with the EU to the House of Commons that would suit everyone. And until then, Theresa May should resign. The conservatives also threatened May with the introduction of a new bill to the parliament, which could be prompted by the country's withdrawal without any deal with the EU. Today, in terms of the economic calendar, we have the publication of statistics on the United States, which, according to forecasts, are quite good. The number of building permits issued in April is growing from 1.288M to 1.290M. The number of initial claims for unemployment benefits is reduced from 228K to 220K. At the same time, if the negative background in Britain persists, the dollar will have another stimulus for growth. Further development Analyzing the current trading chart, we see that the downward interest remains and a fleeting pullback has passed into the "Low" update. Many may say that there is already a significant overheating of short positions. It has been shown, but at the same time, there is a strong downward background. And the quotation has a lot to decline. It is likely to assume that the bears will try to decline to the level of 1.2770-1.2720, which reflects our support and the low of February of the current year. At this coordinate, many traders consider profit taking and a possible correction. Based on the available data, it is possible to decompose a number of variations, let's consider them: - Buy positions are considered in case of finding a pivot near the level of 1.2770, where a correction is possible in the case of working off. - Positions for sale remain in the direction of the level of 1.2770-1.2720. Indicator Analysis Analyzing a different sector of timeframes (TF ), we see that indicators in all time frames tend to decrease, which is caused by the general background of the market. Weekly volatility / Measurement of volatility: Month; Quarter; Year Measurement of volatility reflects the average daily fluctuation, based on monthly / quarterly / year. (May 16, was based on the time of publication of the article) The current time volatility is 31 points. Since there is a pivot point in the face of the level of 1.2770, volatility can be limited within the framework of the average daily indicator. However, if the inertial course continues with the support of the information background, the indicator might change. Key levels Zones of resistance: 1.2880 (1.2865-1.2880) *; 1.2920 * 1.3000 **; 1.3180 *; 1,3300 **; 1.3440; 1.3580 *; 1.3700 Support areas: 1.2770 (1.2720 / 1.2770) **; 1.2620; 1,2500 *; 1.2350 **. * Periodic level ** Range Level The material has been provided by InstaForex Company - www.instaforex.com |
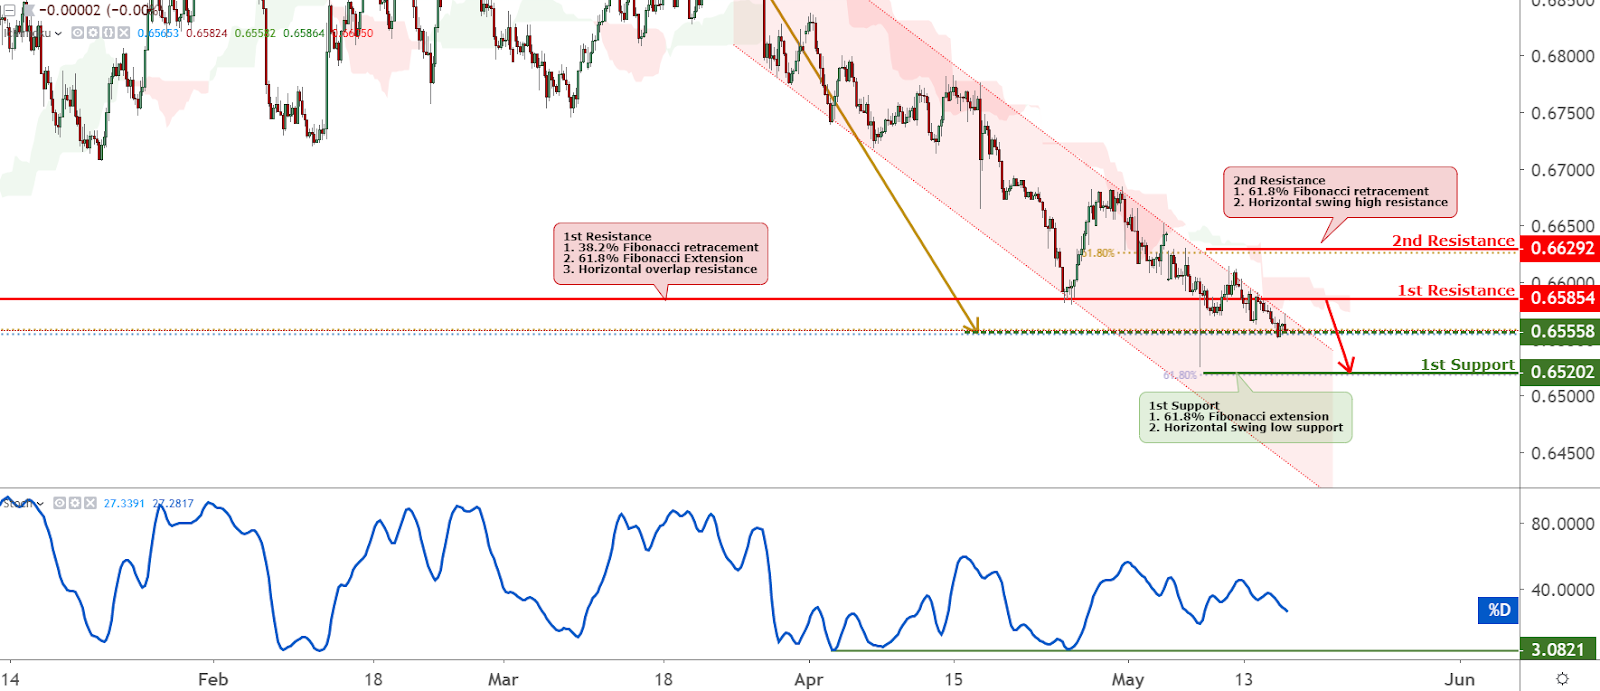
| NZD/USD testing an intermediate support, could we see a bounce? Posted: 16 May 2019 01:45 AM PDT
Description : Price is currently testing an intermediate support at 0.6558. If broken, it will confirm a further move down to its next support at 0.6520. Entry : 0.6585 Why it's good : horizontal pullback resistance, 100% Fibonacci extension Stop Loss : 0.6629 Why it's good : 61.8% Fibonacci retracementThe material has been provided by InstaForex Company - www.instaforex.com |


| You are subscribed to email updates from Forex analysis review. To stop receiving these emails, you may unsubscribe now. | Email delivery powered by Google |
| Google, 1600 Amphitheatre Parkway, Mountain View, CA 94043, United States | |
No comments:
Post a Comment