Forex analysis review |
- EURGBP reversed below resistance, potential for further drop! ( 5 star setup )
- AUD/USD breaking out of its key support, potential for further move down! ( 3 Star )
- USD/JPY Approaching Swing High Resistance, Prepare For A Drop ( 3 star )
- In the shadow of Brexit: the pound ignored the hawkish hints of the Bank of England
- EUR/USD 5 Star Sell Signal | Fundamental + Technical Analysis
- GBP/USD. May 2. Results of the day. Mark Carney: we need to stop stimulating the economy, but not now
- EUR/USD. May 2. Results of the day. The euro exhausted its potential?
- May 2, 2019 : EUR/USD Intraday technical analysis and trade recommendations.
- Technical analysis for EURUSD for May 2, 2019
- Short-term technical analysis of Gold for 2 May, 2019
- Key reristance on the test - Bitcoin analysis for May 05,2019
- GBP/USD: plan for the US session on May 2. The Bank of England left interest rates unchanged
- EUR/USD: plan for the US session on May 2. Production activity in the eurozone leaves much to be desired
- EUR and GBP: the eurozone suffers from weak manufacturing activity. The Bank of England may raise rates earlier than many
- USD/JPY analysis for May 02, 2019
- May 2, 2019 : GBP/USD Intraday technical analysis and trade recommendations.
- EUR./USD analysis for May 02, 2019
- Analysis of Bitcoin for May 2, 2019
- Fundamental Analysis of AUDUSD for May 2, 2019
- Fundamental analysis of USD/CAD for May 2, 2019
- Experts: buy a dollar in May for profit
- Technical analysis of AUD/USD for May 02, 2019
- Technical analysis of EUR/USD for May 02, 2019
- Hard times await Lira. Turkey will not be able to solve problems with currency
- EUR / USD: Fed chief did a disservice to the pair
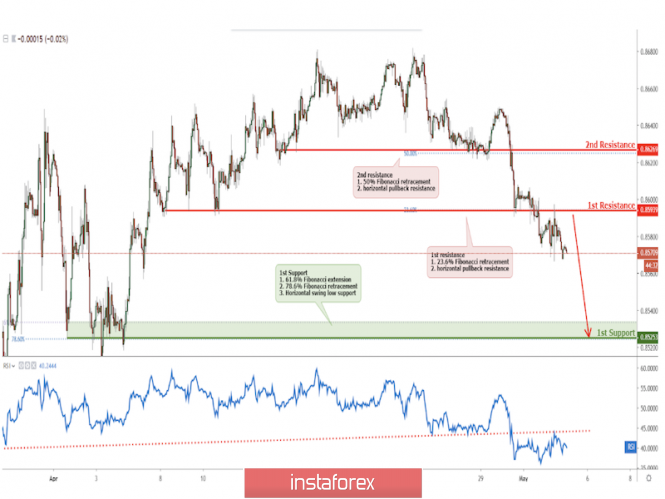
| EURGBP reversed below resistance, potential for further drop! ( 5 star setup ) Posted: 02 May 2019 07:27 PM PDT Price reversed nicely below our first resistance where we might see a further drop in price to our first support level. Entry : 0.8593 Why it's good : horizontal pullback resistance, 23.6% fibonacci retracement Stop Loss : 0.8626 Why it's good : 50% fibonacci retracement, horizontal pullback resistance Take Profit : 0.8525 Why it's good : horizontal swing low support, 78.6% Fibonacci retracement, 61.8% Fibonacci extension
|
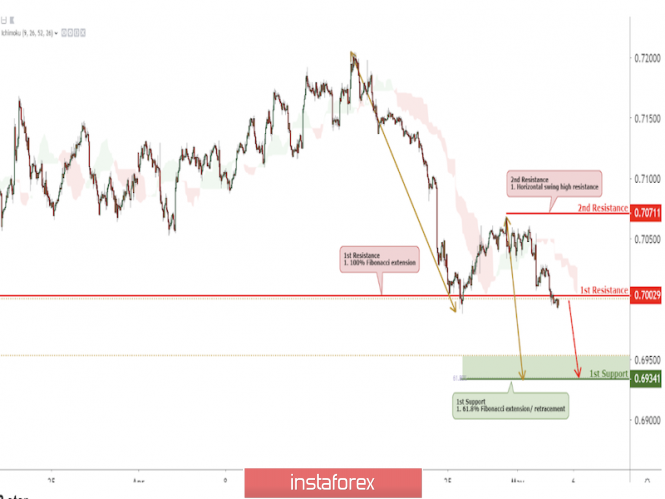
| AUD/USD breaking out of its key support, potential for further move down! ( 3 Star ) Posted: 02 May 2019 07:22 PM PDT Price is testing its major support-turned-resistance at 0.7002, a break out will give a confirmation of a further move down towards its support at 0.6934. Entry : 0.7002 Why it's good : horizontal pullback resistance, 100% fibonacci extension Stop Loss : 0.7071 Why it's good : Horizontal swing high resistance Take Profit : 0.6934 Why it's good : 61.8% fibonacci extension
|
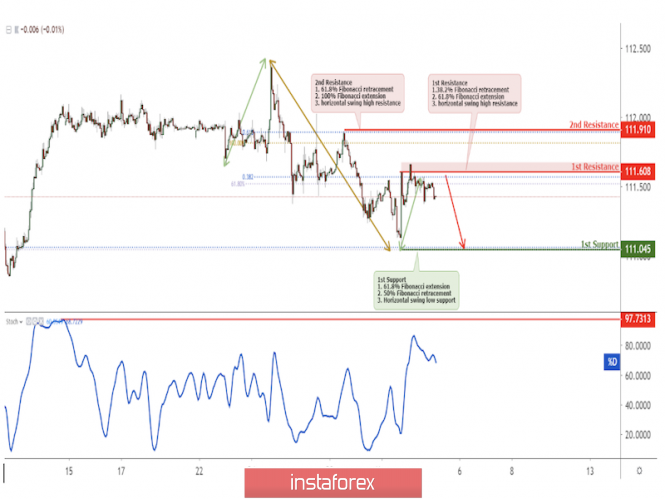
| USD/JPY Approaching Swing High Resistance, Prepare For A Drop ( 3 star ) Posted: 02 May 2019 07:20 PM PDT Price is approaching a key resistance at 111.608 where it could potentially reverse to its support. Entry : 111.608 Why it's good : horizontal swing high resistance,38.2% fibonacci retracement, 61.8% Fibonacci extension Stop Loss : 111.910 Why it's good :61.8% fibonacci retracement,100% Fibonacci extension, horizontal swing high resistance Take Profit : 111.045 Why it's good : horizontal swing low support,50% fibonacci retracement.61.8% Fibonacci extension
|
| In the shadow of Brexit: the pound ignored the hawkish hints of the Bank of England Posted: 02 May 2019 04:34 PM PDT The pound actually ignored the so-called "super-Thursday": despite the abundance of information, the GBP/USD pair repeated yesterday's trajectory, remaining within the 30th figure. Although by and large, all the prerequisites for increased volatility for the pair were: within one day, the most important fundamental events took place - the Bank of England meeting, the publication of the quarterly report on inflation, Mark Carney's press conference, and the publication of PMI data in the construction sector of Great Britain. Such a set of information drivers could have a significant impact on the dynamics of the pair, but as often happens, overstated market expectations did not coincide with reality. Such a phlegmatic reaction from the market was primarily due to the "shadow of Brexit". Against the background of yesterday's statements by British politicians, all other fundamental factors have been relegated to the background - including the English regulator's meeting. Traders do not risk opening large positions for the pair, focusing on the prospects of the "divorce process". In the near future it will become clear whether Teresa May was able to negotiate with the Labour Party or whether the question of approving the transaction will remain in limbo until October 31. Naturally, in the conditions of such uncertainty, it is rather difficult to make trading decisions, even if there are certain signals from the Bank of England. To date, the rebus is complicated by the fact that the English regulator also voiced a very controversial position. So, immediately after the announcement of the results of the central bank's May meeting, the pound rose to a two-day high against the dollar, as the regulator raised its growth forecast of the country's economy to 1.5% in annual terms (from the previous value of 1.2%). Recall that according to the latest data, economic growth in February was 2% (y/y) - this is the highest growth rate since the end of 2017. The volume of production in the manufacturing industry also surprised a significant increase of 0.9% compared with the previous period. In other words, the English regulator's latest decision looks quite logical and justified, given the dynamics of key macro-indicators. In addition, today, the Bank of England responded to the dynamics of inflation indicators. Mark Carney acknowledged that the growth rate of wages, as well as the increase in the number of employees exceeded expectations. Following these indicators, consumer spending "caught up" (which is quite logical). In other words, domestic inflationary pressure remains stable, and therefore the regulator is likely to need a tighter monetary policy - if inflationary growth exceeds forecast values. The last phrase surprised investors, because the market did not expect this year more than one round of interest rate increases - and even then, if the "soft" Brexit is implemented. But now there is a possibility of a double increase on the horizon, but again, provided that there is a civilized divorce between Britain and the European Union. Against the background of such prospects, the pound initially rose, but nearly immediately lost the points it scored. The mood of investors has changed after the central bank published a lowered forecast for inflation. According to members of the regulator, further inflation will slow down - firstly, because of lower energy prices, and secondly, due to the revaluation of the British currency. This fact cooled the fervor of GBP/USD bulls, after which the pair returned to the level of today's discovery, that is, to the bottom of the 30th figure. In addition, traders were disappointed by the fact that all members of the Committee voted for the preservation of the rate in the same form, while some experts expected that at least one of the regulator's representatives would vote for tightening monetary policy. Thus, the Bank of England's May meeting can not be called "dovish." First, the regulator raised its forecast for GDP growth, and second, it allowed a double increase in the interest rate by the end of this year. In the light of these prospects, a decrease in the inflation forecast does not look catastrophic, especially given the growth of the oil market. However, the main anchor for the pound is Brexit, or rather, the uncertainty about its prospects. Last year, the Bank of England"tied" the issue of raising rates with a soft Brexit scenario, and today once again reminded traders of this. Therefore, the main focus of GBP/USD traders will now switch to the negotiation process again. According to rumors, the parties made some progress in the negotiations, but no one officially recognized this fact. Politicians' comments are rather vague: Laborites say that the cabinet has changed its approach regarding the prospects for creating a customs union, while government representatives still praise the deal that was agreed with the EU. In turn, during her speech in the House of Commons, Theresa May announced that the vote on the Brexit deal will take place "well before October 31." In other words, the hints of politicians are optimistic, but there are no real steps to approve the deal yet. Next week, negotiations between the government and the Labour Party will continue. Given the fact that May plans to go to a vote before the elections to the European Parliament (May 25), the events can develop rapidly. The focus of market attention will now shift to this negotiation process - the fate of monetary policy and the fate of the pound will depend on its outcome. The material has been provided by InstaForex Company - www.instaforex.com |
| EUR/USD 5 Star Sell Signal | Fundamental + Technical Analysis Posted: 02 May 2019 04:24 PM PDT
Fundamental analysis: EU GDP expanded by 0.4% in the first quarter beating estimates of 0.3%, showing that policy makers may have got it just right. President Mario Draghi indicated that the industrial sectors were going through a rough patch caused mainly by one-off factors such as disruptions in Germany's automotive sectors and trade tensions between US and China. Given the recent PMI data, it seems that the EU economy is picking up, with Italy, France, and EU PMI coming in ahead of estimates while Germany's PMI fell just slightly short of its estimates of 44.5, coming in at 44.4. Meanwhile, there is no sign that the labor market getting weaker: The region's unemployment rate fell to 7.7 percent in March from 7.8 percent in February, hitting the lowest level in more than ten years. These improvements, alongside rising wages, will continue to help the services sector, which is more dependent on domestic spending. This allows a reassessment of the decision to delay the first hike in interest rates to at least the start of 2020, boosting the currency. Technical analysis: We are looking to sell below major resistance at 1.2506 for a push down to major support at 1.1132. Stop loss would be at 1.1279. The material has been provided by InstaForex Company - www.instaforex.com |
| Posted: 02 May 2019 04:16 PM PDT 4-hour timeframe The amplitude of the last 5 days (high-low): 69p - 42p - 125p - 123p - 73p. Average amplitude for the last 5 days: 86p (82p). Over the past two days, the British pound also moved away from local highs. The Bank of England meeting was held in the UK today, however, it is highly expected that monetary policy remains unchanged. The key rate is kept at 0.75%. All 9 members of the monetary committee voted to maintain the current level of the rate, so there is no suggestion of changing it in the coming months. The Bank of England's planned volume of the repurchase of assets also remained unchanged. In connection with today's most significant event, there is an expected speech from Mark Carney. However, just looking at the pair's schedule, it becomes clear that Carney did not say anything important or interesting. He only noted that further reductions in stimulating the economy are necessary, but not at the moment. He also highlighted a slight increase in wages, as well as the fact that companies do not expect resolution of the issue on Brexit in the near future. Inflation is still below the regulator's target levels. In principle, the market knew all this before the meeting, so there was no tangible reaction. Thus, the technical picture for the pair remains the same and is similar to that of the EUR/USD pair. The instrument is adjusted against the upward trend and has all chances to resume growth. Although here, similar to the euro's case, there is no fundamental background that was able to provide long-term support for the British currency. Therefore, we believe that the downward trend's resumption is more likely. Trading recommendations: The GBP/USD currency pair started a downward correction. Thus, now it is recommended to consider long positions with targets of 1,3084 and 1,3111, but after the completion of the current correction. Shorts will become relevant only after the reverse consolidation of the price below the Kijun-sen line with the first goal of 1.2939. The Bank of England meeting did not have a proper impact on the pair. In addition to the technical picture, one should also take into account the fundamental data and the time of their release. Explanation of the illustration: Ichimoku indicator: Tenkan-sen - the red line. Kijun-sen - the blue line. Senkou Span A - light brown dotted line. Senkou Span B - light purple dotted line. Chikou Span - green line. Bollinger Bands indicator: 3 yellow lines. MACD Indicator: Red line and histogram with white bars in the indicator window. The material has been provided by InstaForex Company - www.instaforex.com |
| EUR/USD. May 2. Results of the day. The euro exhausted its potential? Posted: 02 May 2019 04:15 PM PDT 4-hour timeframe The amplitude of the last 5 days (high-low): 45p - 63p - 42p - 53p - 78p. Average amplitude for the last 5 days: 56p (57p). There were few important macroeconomic events for today. In the morning, the index of business activity in the manufacturing sector of Markit for the euro area was published, which was 47.9 (slightly higher than the forecast, but still below the key value of 50.0). This release was not very important. In the United States, a report was published on applications for unemployment benefits (a slight excess of the forecast) and a change in the volume of production orders in March (an increase of 1.9% against the forecast of 1.5). However, all these data were of a secondary nature, so they did not have a special influence on the course of trading. Meanwhile, the US dollar continues to regain the losses it incurred at the beginning of the week. We have already mentioned several times that there is not enough weighty fundamental background to sharply strengthen the euro currency. It is the background, not the one-time reports. Thus, from our point of view, the resumption of the EUR/USD pair's fall is quite logical. Of course, the collapse is not worth waiting for, but the downward trend continues. So far, the current downward movement is seen as a downward correction, as the "golden cross" buy signal is retained. Therefore, the upward movement may still resume if the pair rebounds from the critical line. Now we are waiting for the critical line to be overcome, which will be a signal for further downward movement. Instrument volatility has increased slightly in recent days. Now it is a little more than 50 points a day, which is not as bad as it used to be, and contributes to more and more traders returning to the market. Trading recommendations: The EUR/USD started a downward correction with an aim of the critical Kijun-sen line. So far, the longs remain relevant with a target of 1,1234. To be able to open long positions, it is recommended to wait for the upward reversal of the MACD or the price rebound from the Kijun-sen. Short positions are recommended to be considered in small lots while aiming for the level of 1,1124, not earlier than when the price is consolidated below the critical line. In this case, the downward trend may resume. In addition to the technical picture, one should also take into account the fundamental data and the time of their release. Explanation of the illustration: Ichimoku indicator: Tenkan-sen - the red line. Kijun-sen - the blue line. Senkou Span A - light brown dotted line. Senkou Span B - light purple dotted line. Chikou Span - green line. Bollinger Bands indicator: 3 yellow lines. MACD Indicator: Red line and histogram with white bars in the indicator window. The material has been provided by InstaForex Company - www.instaforex.com |
| May 2, 2019 : EUR/USD Intraday technical analysis and trade recommendations. Posted: 02 May 2019 12:01 PM PDT
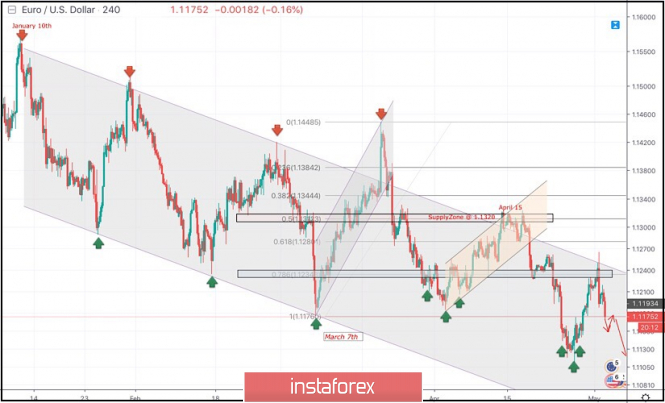
Few weeks ago, a bullish Head and Shoulders reversal pattern was demonstrated around 1.1200. This enhanced further bullish advancement towards 1.1300-1.1315 (supply zone) where significant bearish rejection was demonstrated on April 15. Short-term outlook turned to become bearish towards 1.1280 (61.8% Fibonacci) then 1.1235 (78.6% Fibonacci). For Intraday traders, the price zone around 1.1235 (78.6% Fibonacci) stood as a temporary demand area which paused the ongoing bearish momentum for a while before bearish breakdown could be executed on April 23. Currently, the price zone around 1.1235-1.1250 has turned into supply-zone to be watched for bearish rejection. Two days ago, a recent bullish head and shoulders pattern was being demonstrated around 1.1140 on the H4 chart. That's why, conservative traders were suggested to wait for another bullish pullback towards 1.1230-1.1250 for a valid SELL entry. Today, bearish persistence below 1.1175 is needed to ensure further bearish decline. Otherwise, another bullish pullback maybe executed towards 1.1190-1.1210. Trade recommendations : Conservative traders were suggested to have a valid SELL entry anywhere around 1.1250. It's already running in profits. S/L should be lowered to 1.1220 to secure some profits. Target levels to be located around 1.1170 and 1.1130. The material has been provided by InstaForex Company - www.instaforex.com |
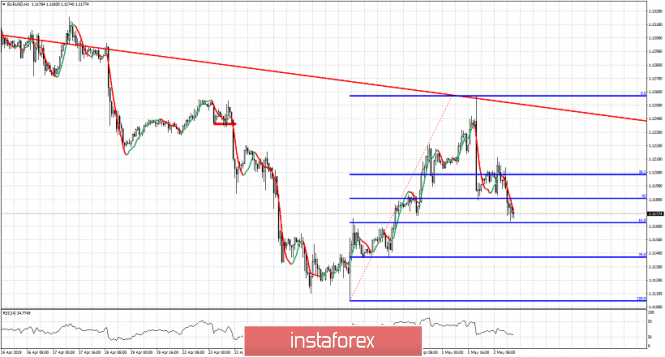
| Technical analysis for EURUSD for May 2, 2019 Posted: 02 May 2019 11:12 AM PDT EURUSD got rejected at the 1.1260 level where we find the upper channel boundary resistance. Price has now pulled back towards short-term support of 61.8% Fibonacci retracement of the last leg higher from 1.1112.
At 1.1170 we find important short-term Fibonacci support. At 1.1220 we find resistance and breaking above it will open the way for a move towards 1.1260 and the major red trend line resistance. Bulls need to reverse trend to the upside and place a higher low. This will increase the chances of breaking above 1.1260-1.13 and reversing medium-term trend. On the other hand, bears will need to keep prices below 1.1270 and the pair will eventually fall towards 1.11 or lower. The material has been provided by InstaForex Company - www.instaforex.com |
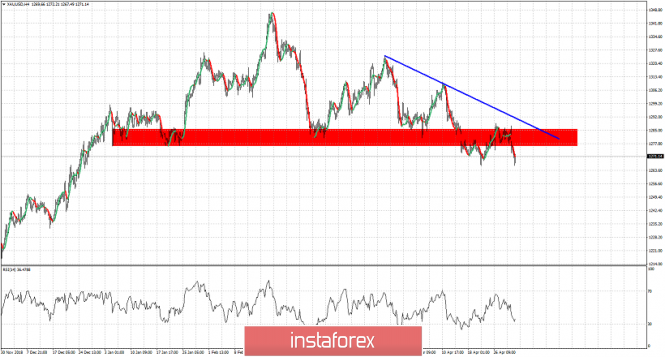
| Short-term technical analysis of Gold for 2 May, 2019 Posted: 02 May 2019 11:00 AM PDT Gold price made a low at $1,266 making a double bottom so far as prices bounce towards $1,270. Trend remains bearish in short and medium-term trend. Key level is at $1,300.
Blue line - resistance trend line Gold price is back to its 2019 lows. Gold is forming a double bottom as long as $1,266 holds. Price is below key level of $1,290-$1,300. Any bounce towards that area is considered a selling opportunity. We remain bearish short- and medium-term as long as price is below $1,300.Target for Gold is at $1,250-60 and maybe $1,225. Breaking above $1,290 will increase the chances of breaking above $1,290. Therefore I would not be short above $1,290. The material has been provided by InstaForex Company - www.instaforex.com |
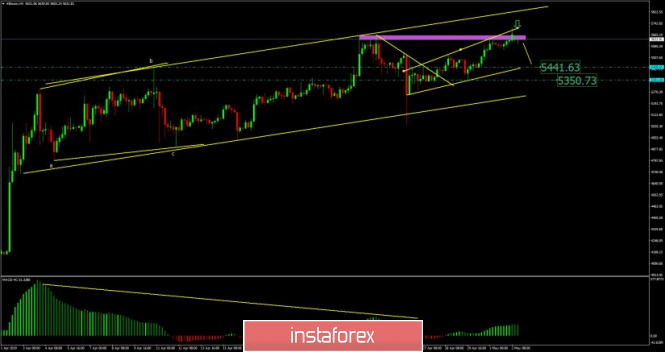
| Key reristance on the test - Bitcoin analysis for May 05,2019 Posted: 02 May 2019 07:05 AM PDT BTC has traded upward. The price tested the level of $5.715.BTC is at the key resistance $5.655 and buying at this stage looks risky. My advice is to watch for potential selling opportunities and downward correction.
Purple rectangle – Swing high (resistance) Smaller yellow channel – short-term channel BTC is on the key short-term resistance at the price of $5.655. The resistance is created from previous swing high and the upper diagonal of the upward channel. Since there is possibility that BTC is in overbought condition, you should focus on potential selling plays. Support levels are seen at the price of $5.441 and $5.350. In case that BTC still go higher, the top of the larger upper channel will be strong resistance at $5.840, so you can watch to sell from that point. The material has been provided by InstaForex Company - www.instaforex.com |
| GBP/USD: plan for the US session on May 2. The Bank of England left interest rates unchanged Posted: 02 May 2019 06:59 AM PDT To open long positions on GBP/USD, you need: The Bank of England's decision on interest rates led to a slight surge in market volatility, but the technical picture did not change compared to the morning forecast. At the moment, buyers of the pound need a return and consolidation above the resistance of 1.3057, which will return the demand and lead to a repeated test of a maximum of 1.3093 with its update in the area of 1.3129, where I recommend fixing the profits. With the scenario of further GBP/USD decline, it is best to return to long positions on a false breakdown in the area of 1.3018 or on a rebound from the low of 1.2983. To open short positions on GBP/USD, you need: Bears have formed a false breakout in the resistance area of 1.3057, and while trading is conducted below this range, you can count on a return to the support area of 1.3018, the breakdown of which will lead to a larger downward correction to the minimum of 1.2983, where I recommend fixing the profits. In the GBP/USD growth scenario above the resistance of 1.3057, it is best to consider short positions on the rebound from the high of 1.3093 and 1.3129. Indicator signals: Moving Averages Trading is conducted in the region of 30 and 50 moving averages, which indicates the lateral nature of the market. Bollinger bands In the case of a decrease in the pound in the afternoon, support will necessarily provide the lower limit of the indicator in the region of 1.3018. Description of indicators
|
| Posted: 02 May 2019 06:59 AM PDT To open long positions on EURUSD, you need: Weak data on eurozone manufacturing activity did not allow euro buyers to resume an upward correction. At the moment, the problematic level is the resistance area of 1.1227, the breakthrough of which will lead to further growth of EUR/USD and the renewal of the maximum of 1.1260, where I recommend fixing the profit. In the case of the euro decline in the afternoon, after the release of good reports on the US labor market and production orders, it is best to return to long positions on a false breakdown in the support area of 1.1188 or to rebound from a larger level of 1.1150. To open short positions on EURUSD, you need: The bears managed to return the pair to the morning resistance level of 1.1215, but so far it was not possible to create the necessary pressure to continue the downward trend. As long as trading continues below 1.1227, the probability of further decline of the euro will remain very high, and good data on the US economy can contribute to the fall of EUR/USD in the area of the lows of 1.1188 and 1.1150, where I recommend fixing the profits. In the growth scenario above the level of 1.1227, it is best to return to the short positions on the rebound from the maximum of 1.1260. Indicator signals: Moving Averages Trading is conducted in the region of 30 and 50 moving averages, which indicates the lateral nature of the market. Bollinger Bands In case of a decline in the euro in the second half of the day, the support will be provided by the lower limit of the indicator around 1.1180. Description of indicators
|
| Posted: 02 May 2019 06:59 AM PDT The European currency failed to properly recover from yesterday's fall against the US dollar after the publication of reports on industrial activity in the eurozone, which continued to show a slowdown. According to the data, the Purchasing Managers Index (PMI) for Italy's manufacturing sector rose to 49.1 points in April of this year, while it was projected at 47.7 points. In March, Italy's manufacturing PMI was 47.4 points. A similar index of Purchasing Managers Index (PMI) for the manufacturing sector in France in April managed to return to the level of 50.0 points, with a forecast of 49.6 points. In March, the manufacturing PMI of France was 49.7 points. Given the decline in production activity in the eurozone, which occurred directly due to trade conflicts and weak exports, the European currency remains under pressure paired with the US dollar. According to the statistics agency, the PMI purchasing managers' index for the manufacturing sector in the eurozone grew to 47.9 points in April of this year, while economists had predicted it in the area of 47.8 points. Back in March, the index was 47.5 points. Finding an index below 50 points indicates a decrease in activity. As for the technical picture of the EURUSD pair, it remained unchanged compared with the morning forecast. Further growth of risky assets is limited by the resistance of 1.1215. Only a return to this level will return new buyers to the market, who are counting on the renewal of major resistance of 1.1260, which yesterday has limited the upward trend. Bears will count on a breakthrough and a return below the support level of 1.1175, which will completely reverse the current upward trend, formed on April 24, and return the trading instrument to the lows of 1.1150 and 1.1110. All traders' attention in the first half of the day was focused on the decision of the Bank of England on interest rates, which led to only a small surge in volatility but did not allow the bulls to resume pound growth, even despite the fact that the regulator announced a more rapid tightening of monetary policy than previously predicted. However, it is really necessary to understand that while there will be no clarity and any specifics on Brexit, the British regulator will not act. Therefore, it will be possible to talk about real changes in the policy of the Central Bank not earlier than this autumn. According to the data, the Bank of England left a key interest rate at the level of 0.75% today, saying that, according to its expectations, monetary policy tightening may be required in the coming years, as inflation will rise above the target level. In general, a gradual and limited increase in the key interest rate is projected in the following years. Economists have also raised forecasts for the UK economy's growth in the coming years, which will certainly lead to increased inflationary pressure. UK GDP is expected to grow by 0.5% in the 1st quarter, but growth is likely to return to 0.2% in the 2nd quarter. Despite this, the Bank of England raised the UK GDP growth forecast in 2019 to 1.5% from 1.2%. As for the inflation background, it is predicted that by 2021 inflation will be above the target of 2% and will continue to grow. The technical picture of the GBPUSD pair in the next few trading days. The situation remains on the side of sellers, as the bulls are not yet able to quickly gain a foothold above the resistance level of 1.3060. Only a real breakthrough of this range will allow us to continue the upward trend formed on April 25, which will lead the trading instrument to the highs of 1.3130 and 1.3230. With a decrease in the pound, in the continuation of yesterday's downward correction, one can look at long positions after updating the larger support levels in the area of 1.2990 and 1.2940. The material has been provided by InstaForex Company - www.instaforex.com |
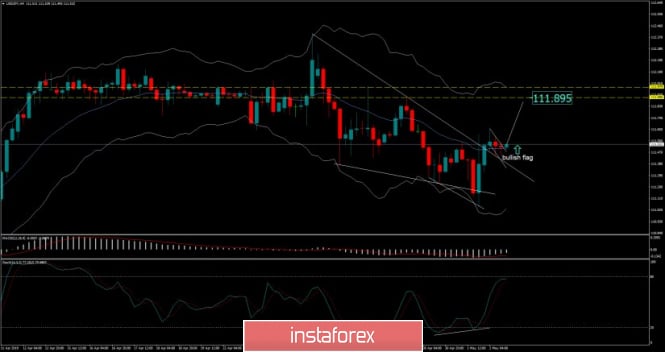
| USD/JPY analysis for May 02, 2019 Posted: 02 May 2019 06:55 AM PDT USD/JPY has been trading upwards post FOMC minutes. The price did test the level of 111.65. We are expecting more upside on the USD/JPY In the next period.
Yellow horizontal lines – Resistance levels Smaller white lines – bullish flag pattern (continuation) Larger white line – resistance trendline USD/JPY did break the key supply trendline in the background, which is sign that buyers took control from sellers. Watching the H4 time-frame, we found that there is the bullish divergence on the Stochastic oscillator in the background combined with the bullish flag after the breakout of resistance, which is strong sign for further upside. Resistance levels are seen at the price of 111.89 and 111.97. Key support remains at the price of 111.00. Watch for buying opportunities. The material has been provided by InstaForex Company - www.instaforex.com |
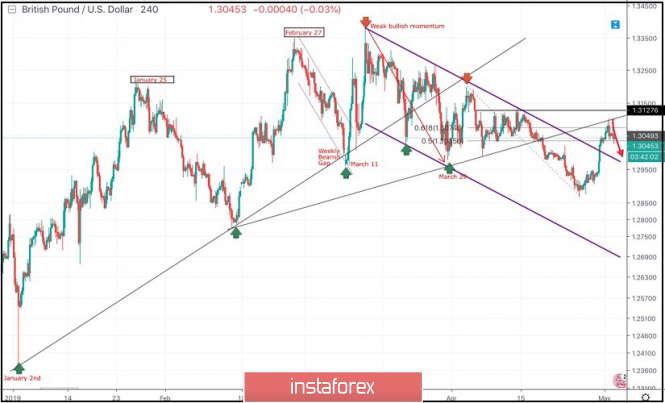
| May 2, 2019 : GBP/USD Intraday technical analysis and trade recommendations. Posted: 02 May 2019 06:54 AM PDT
On March 29, the price levels of 1.2980 (the lower limit of the newly-established bearish movement channel) demonstrated significant bullish rejection. This brought the GBPUSD pair again towards the price zone of (1.3160-1.3180) where the upper limit of the depicted bearish channel as well as the backside of the depicted broken uptrend line demonstrated significant bearish rejection. Since then, Short-term outlook has turned into bearish with intermediate-term bearish targets projected towards 1.2900, 1.2800 and 1.2750 where the lower limit of the depicted channel comes again to meet the GBPUSD pair. Earlier this week, a bullish pullback was executed towards the price levels around 1.3035 (50% Fibonacci) which is being temporarily breached to the upside. Short term outlook remains bearish provided that the price levels around 1.3075 remains defended by the bears. For the bearish side to gain sufficient momentum, a quick bearish H4 candlestick closure should be achieved below 1.3035. Otherwise, the pair remains trapped within the depicted Price-zone (1.3035 - 1.3090). Trade Recommendations: A Bearish SELL entry was suggested around 1.3090. It's already running in profits. Bearish Targets are located towards 1.3035, 1.2920, 1.2800. Any bullish breakout above 1.3074 (61.8% Fibonacci level) invalidates this bearish scenario. The material has been provided by InstaForex Company - www.instaforex.com |
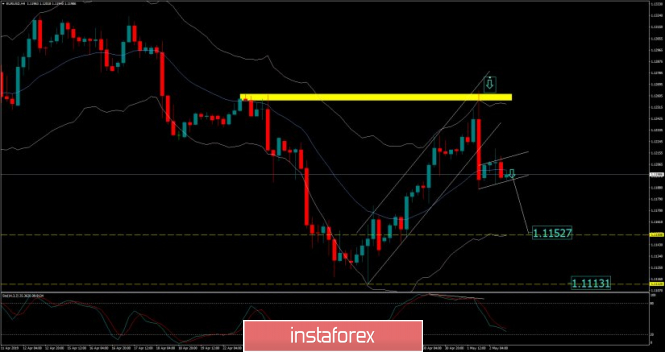
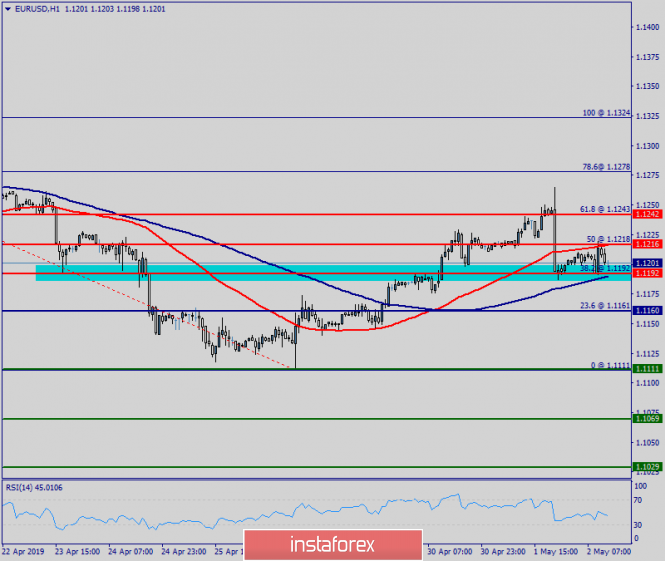
| EUR./USD analysis for May 02, 2019 Posted: 02 May 2019 06:43 AM PDT EUR/USD has been trading downwards. The price did drop after FOMC report yesterday and tested the level of 1.1187 with a high volume. Since the strong reaction from sellers of resistance at 1.1260, we are expecting further downward continuation.
Yellow rectangle – Swing high (resistance) Larger white channel – Upward trend (broken Smaller white lines - bearish flag Yesterday was the key price action clue for us. The resistance at the price of 1.1260 held successfully and price action confirmed big aggression from sellers and that is why we still expect further downside movement. The upward channel got broken and the bearish flag after the breakout confirmed that breakout Support levels are seen at the price of 1.1152 and 1.1113. The short-term high is set at the price of $1.1218. Watch for selling opportunities. The material has been provided by InstaForex Company - www.instaforex.com |
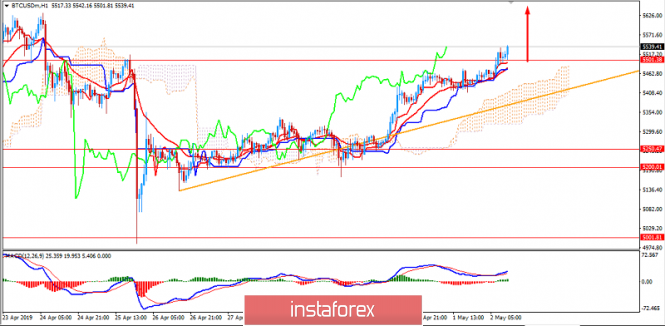
| Analysis of Bitcoin for May 2, 2019 Posted: 02 May 2019 06:07 AM PDT Bitcoin has been quite impulsive with the recent bullish momentum which resulted in a break above $5,500 area. Reportedly, Bitcoin exchanges in the US received significant investments which enabled the cryptocurrency to attract buyers. So, the ongoing rally is expected to continue. As seen on the H1 chart, the price has already broken above the $5,500 area. The next targets lie at $5850 and later towards $6,000 area in the future. After the recent rebounds towards the dynamic levels like 20 EMA, Tenkan and the Kijun line in the intraday chart, bitcoin is expected to gain bullish momentum in the process. The Kumo Cloud, having more wide area to support the price, indicates further upward pressure in the coming though certain correction and rebonds can be observed along the way.
SUPPORT: 5000, 5250, 5500 RESISTANCE: 5850, 6000 BIAS: BULLISH MOMENTUM: NON-VOLATILE The material has been provided by InstaForex Company - www.instaforex.com |
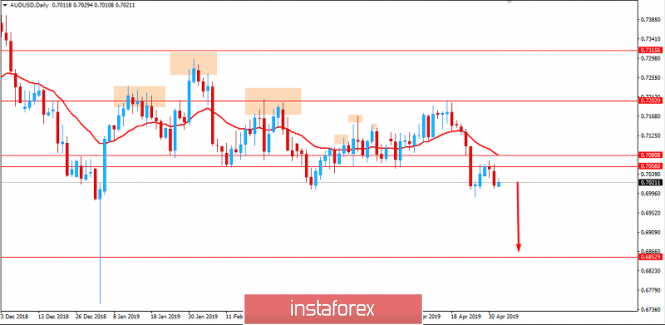
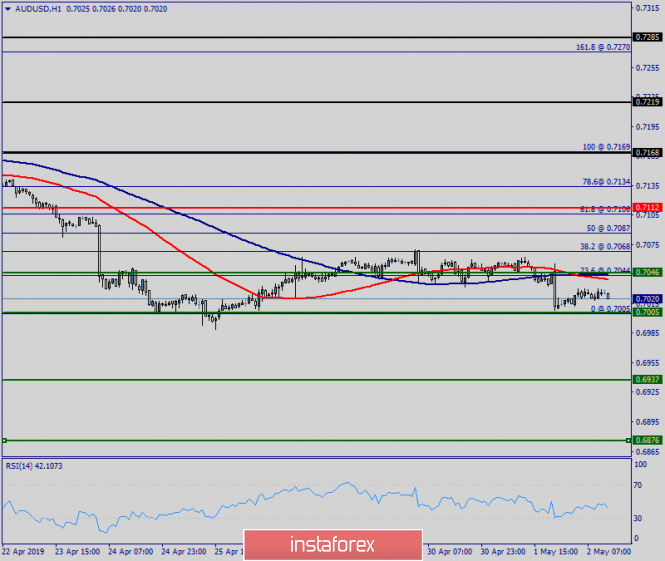
| Fundamental Analysis of AUDUSD for May 2, 2019 Posted: 02 May 2019 05:54 AM PDT AUD/USD broke below 0.7050 area and is set to decline further with target towards 0.6850. Australia released a positive employment change report but a negative unemployment rate report. As a result, the Australian currency weakened. Other econmic reports reinforsed the downward pressure. Thus, home prices declined again in April amid lackluster demand and tight credit, though the pace of losses eased as auction clearance rates stabilized in the major cities. The Reserve Bank of Australia may be forsed to cut the interest rate at its next policy meeting in the coming days. Consequently, the Australian dollar may take a nosedive against the US dollar. Tomorrow, Australia's Building Permits report is going to be published which is expected to decrease significantly to -12.5% from the previous positive value of 19.1%. Additionally, the AIG Services Index report is also going to be published which previously was at 44.8. Recently, the AIG Manufacturing Index was published with an increase to 54.8 from the previous figure of 51.0, so the AIG Services Index is also expected to have a positive reading. On the other hand, the Federal Reserve kept the interest rate unchanged at 2.50% and presented a dovish statement. Some analysts expected that the Fed might somehow signal they are shifting or perhaps biased toward a rate cut. The focus is still on the fact that the inflation is below the Fed's target, so the Fed officials may be reluctant to make any dramatic changes to its policy in the coming months. The non-farm employment change report which is expected to show a decrease 181k from the previous figure of 196k. At the same time, the average hourly earnings report is expected to increase to 0.3% from the previous value of 0.1% and the unemployment rate is expected to be unchanged at 3.8%. Amid a deluge of economic data, the US dollar will come under the spotlight. On the back of the upbeat GDP report, the American currency has all the chances to extend gains. As of the current scenario, USD is expected to sustain the bearish momentum as AUD may struggle further with downbeat economic reports to be published in the coming days. Though the Fed has been quite dovish in the recent meeting, any positive outcome on the employment reports may result in impulsive gains on the USD side. Now let us look at the technical view. The price has recently retested the 0.7050 area after the impulsive bearish break which is expected to lead the price to the next important support area at 0.6850 in the coming days. The price broke below the 4-months lows with a strong bearish daily close which is expected to result in more downward pressure. As the price remains below 0.71 area with a daily close, the bearish bias is expected to continue.
|
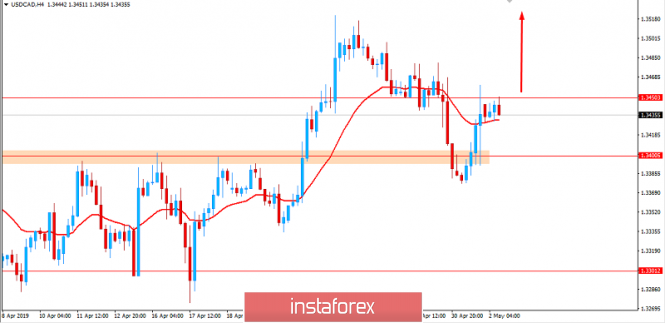
| Fundamental analysis of USD/CAD for May 2, 2019 Posted: 02 May 2019 05:00 AM PDT USD/CAD has been quite volatile with the recent price action above 1.3400 area. Previously, an impulsive break above this level was seen at a daily close. The Federal Reserve has taken a dovish stance, keeping the rates unchanged. It is expected to lead to further weakness of USD against CAD in the coming days. At its latest monetary policy meeting, the FOMC left the funds rate unchanged at 2.50%. There had been some expectations regarding the Fed's intentions to shift towards a rate cut. The focus is still on the fact that the inflation rate is below the Fed's target which suggests that the central bank is reluctant to make any dramatic changes in the coming months. The non-farm employment change report which is expected to show a decrease 181k from the previous figure of 196k. At the same time, the average hourly earnings report is expected to increase to 0.3% from the previous value of 0.1% and the unemployment rate is expected to be unchanged at 3.8%. Amid a deluge of economic data, the US dollar will come under the spotlight. On the back of the upbeat GDP report, the American currency has all the chances to extend gains. On the other hand, Canada's central bank also left the interest rate unchanged at 1.75%. Nonetheless, CAD managed to gain momentum against USD due to the recent dovish statements of the Fed. The Bank of Canada provided rather feeble outlook for the economic growth, so it would be surprising if the actual results undershoot the estimates. The is a 50% chance that the BOC will decide on an interest rate cut this year, but this kind of tepid growth projection has raised the bar for policy easing. The Canadian GDP forecast for the year was decreased to 1.2% from the previous estimate of 1.7%. Remarkably, the Bank of Canada is monitoring the economic developments, especially in household spending, the oil market and global trade. BOC Governor Stephen Poloz is still quite optimistic and sees developing economy, expecting a rate hike if the consistency is ensured in the future. As of the current scenario, USD can be highly volatile ahead of high-impact economic reports and amid the Fed's dovish sentiment observed recently. On the other hand, if CAD fails to gain ground against USD according to the current scenario, then USD is expected to advance in the coming days. Now let us look at the technical view. The price is currently residing below 1.3450 area after certain retest while being quite corrective and volatile. Though certain bearish pressure is currently observed, a break above 1.3450 with a daily close is expected to lead the price higher with the target towards 1.40 price area in the future. As the price remains above 1.3400 area, the bullish bias is expected to continue further.
|
| Experts: buy a dollar in May for profit Posted: 02 May 2019 03:59 AM PDT According to analysts for many years, the peak of the growth of the American currency usually falls on May. This is backed by the data collected over 10 years. In the last month of spring, the US dollar appreciated 8 times, experts emphasized. At present, analysts note that the dollar against a basket of six world currencies, as the main US trading partners, is growing for three months in a row. Experts believe that the "bulls" in the US dollar can be expected to rise in the fourth month that is in May. According to a study by specialists from JPMorgan Chase, the largest bank, the US dollar index rose at least eight times in May over the past decade. For the American currency this is the strongest month of the year, as emphasized by analysts. Last week, the US dollar index updated the annual maximum and reached a record of 97.458 points. The coming month is also the strongest for the "American" against the euro. Over ten years, the US currency strengthened in May against the European currency by an average of 1.8%. In the last month of spring, the market volatility of the EUR / USD rate rises as a rule. In the first trading day of May, the US currency marked a dizzying rally. This has contributed a lot to the actions of the Fed. The US dollar won back previous losses and significantly strengthened after Fed Chairman Jerome Powell ruled out the possibility of easing monetary policy. Recall that following the meeting, the American regulator retained the key rate unchanged. Positive comments by the Fed Chairman marked the beginning of a strong rally of the US currency. As a result, the EUR/USD pair fell below the 1.12 mark, while on the contrary, the USD/JPY pair rose to the level of 111.60 from the previous level of 111.05. Experts point out two main reasons for the further strengthening of the US dollar. First, the Fed chairman expects an improvement in the prospects for the American economy as statistics recovers. Secondly, he sees no reason for lowering interest rates. However, his point of view differs from the opinion of other regulators who are seriously concerned about the strengthening of the American currency. Last month, there were differences in the monetary policies of a number of states that led to a strengthening of the US dollar, noted by analysts. Experts summed up that this trend will continue and will contribute to an increase in demand for the American currency. The material has been provided by InstaForex Company - www.instaforex.com |
| Technical analysis of AUD/USD for May 02, 2019 Posted: 02 May 2019 03:37 AM PDT |
| Technical analysis of EUR/USD for May 02, 2019 Posted: 02 May 2019 03:18 AM PDT |
| Hard times await Lira. Turkey will not be able to solve problems with currency Posted: 02 May 2019 02:11 AM PDT Investors are still in the dark about what is happening with the foreign currency assets of Turkey. The published report of the Central Bank of Turkey on inflation showed what exactly is happening with the monetary policy of the country and how quickly foreign exchange reserves are reduced. But even after its publication, the situation remains obscure. Lira recovered slightly after the head of the Central Bank announced that another round of raising interest rates is possible if it is necessary to stop inflation. But if this is a real opportunity, then why was it excluded from the monthly report of the Monetary Policy Committee? This frightened the currency markets because investors' confidence in Turkey has eroded and although the regulator has done its best to calm the market, this cannot be considered good news. In addition, the head of the Central Bank was unable to clarify the situation with foreign exchange reserves. Recognizing the "need for further action on reserves," he was unable to voice any of these "follow-up actions" either in the press briefing or in the report. In any case, even the figures voiced by the head of the Central Bank of 80 billion dollars for foreign currency reserves and a net amount of 27 billion dollars are not insufficient to cover Turkey's short-term foreign currency debt of 120 billion dollars. This is a serious problem for the current government. One rhetoric does not support the lyre. Investors must believe that the Central Bank is sincerely committed to its fight against inflation and independent of government intervention. Until there is a more credible official response, the lira will fall. |
| EUR / USD: Fed chief did a disservice to the pair Posted: 02 May 2019 02:07 AM PDT Yesterday, the euro/dollar bulls attempted to consolidate above the key resistance level of 1.1240, which was the middle line of the Bollinger Bands indicator on the daily chart that would allow them to rise to the 13th figure and above in the future. After the announcement of the results of the May meeting of the Fed, the pair impulsively reached the mark of 1.1265, thereby updating the two-week high. But Jerome Powell's subsequent comments were in favor of the US currency as the head of the Fed smoothed over the "sharp edges" of the accompanying statement, refuting market rumors about the regulator's further steps towards easing monetary policy. As a result, the EUR/USD pair is now at the level of yesterday's discovery at the base of the 12th figure. Both upward and downward impulsive price movements did not receive their continuation. Neither the bulls nor the EUR/USD bears found support from the majority of traders and the pair actually remained in their previous positions, awaiting the next fundamental driver. Despite Jerome Powell's confident rhetoric about the prospects for the American economy, the tone of the accompanying statement was worried. The regulator expectedly drew attention to the reduction of key inflation indicators. In fact, it would be surprising if the Fed ignored this trend. Indeed, over the past few weeks, almost all inflation indicators went out in the "red zone" worse than expected. In general and especially the core inflation, there was negative dynamics, the price index of GDP updated the three-year minimum and the main index of expenditures on personal consumption fell to zero for the first time since March last year. Plus, a weak wage growth rate amid a general strengthening of the labor market. The negative picture is clearly systemic, therefore, the regulator in its final communique expressed particular concern about this fact. According to Fed members, the slowdown in inflation is not caused only by lower energy prices (especially considering the dynamics of the oil market). So in this case, the Fed is not dealing with a temporary seasonal phenomenon but with a steady trend. At the same time, the regulator did not specify in the text of the accompanying statement whether he is considering the option of reducing the rate among other scenarios or not. The Fed just repeated the phrase about the need to "be patient", without defining any time guidelines. The "dovish" rhetoric of the accompanying statement put strong pressure on the dollar, after which, the greenback fell in price across the entire market. The situation hastened to fix Jerome Powell. At his traditional press conference, he stated that he currently does not see compelling reasons for changing the base interest rate both upward and downward. He acknowledged that core inflation declined "quite unexpectedly", but this dynamic may be due to "temporary factors." It is worth noting that in this case, Powell's rhetoric goes against the rhetoric of the accompanying statement. Fed members do not consider the current trend as a "temporary phenomenon," indicating an alarming trend. Therefore, the position of the head of the Federal Reserve in this context looks quite surprising. Nevertheless, the market heeded the words of Powell and the dollar made up the lost positions in a matter of minutes to the basket of major currencies. In general, the position of the Fed chairman was "cautiously optimistic". He announced the strengthening of the US economy with the GDP growth in the first quarter exceeded forecasts, noting separately the strengthening of the labor market, amid growing Nonfarm and reducing unemployment. At the same time, he started a slowdown in consumer spending and business investment but global financial conditions have softened, according to Powell. Factors including the progress in trade negotiations between Washington and Beijing, a decrease in the likelihood of a "tough" Brexit, an increase in the key indicators of China and the EU, reduce the likelihood of a slowdown in the global economy. In other words, the head of the Fed is quite optimistic about the prospects for global growth in general and the US economy in particular. However, he did not express particular concern about the slowdown in inflation, associating this trend with the influence of temporal factors. Such a peace-loving tone supported the dollar. In my opinion, the optimism of dollar bulls is premature. Of course, greenback received a powerful reason for its recovery - at least in the short term. But if inflationary indicators continue to show negative dynamics, Powell will no longer be able to "brush off" this problem, explaining the current dynamics by temporary factors. In this context, Nonfarm will play an important role, namely the dynamics of wage growth. If this indicator disappoints investors, the dollar will again be under considerable pressure. In technical terms, EUR/USD buyers still need to gain a foothold above the resistance level of 1.1240. At this price point, the Bollinger Bands midline was not only drawn on the daily chart but also the Tenkan-sen and Kijun-sen lines. If the bulls overcome this target, they can count on a return to the area of the 13th figure. Otherwise, the bears will again return the price to the base of the 11th level. The material has been provided by InstaForex Company - www.instaforex.com |
| You are subscribed to email updates from Forex analysis review. To stop receiving these emails, you may unsubscribe now. | Email delivery powered by Google |
| Google, 1600 Amphitheatre Parkway, Mountain View, CA 94043, United States | |


No comments:
Post a Comment