
Forex analysis review |
- Fractal analysis of major currency pairs for May 23
- EUR/GBP approaching resistance, potential drop!
- AUD/NZD approaching resistance, potential reversal!
- USD/JPY reversed off key resistance, a drop is possible!
- EUR / USD h4 vs USD / JPY h4 vs EUR / JPY. Comprehensive analysis of movement options from May 23, 2019. Analysis of APLs
- EUR/USD 5 Star Sell Signal | Fundamental + Technical Analysis
- May will resign this weekend
- Euro: a new argument for selling
- The pound is in a steep dive: the draft deal with the EU is doomed to failure
- GBP/USD. 22nd of May. Results of the day. The pound sterling showed signs of life for a very short time
- EUR/USD. 22nd of May. Results of the day. The minutes of the Fed meeting are interesting, but all the "numbers" have long
- Technical analysis for EURUSD for May 22, 2019
- Technical analysis for Gold on a weekly time frame
- May 22, 2019 : EUR/USD Intraday technical analysis and trade recommendations.
- May 22, 2019 : GBP/USD Intraday technical analysis and trade recommendations.
- Bitcoin analysis for May, 22.2019
- Analysis of Gold for May, 22.2019
- GBPUSD: Pound sellers ignore strong inflation, although this should not be done
- GBP/USD: plan for the US session on May 22. The pound is expected to continue to decline
- GBP/USD analysis for May, 22.05.2019
- Bitcoin to surge higher above $8,000? May 22, 2019
- The dollar has cut gold wings
- EUR/USD: plan for the US session on May 22. The euro remains in the channel before important elections
- What will be said on the "minutes" of the Fed?
- Trading Plan for EUR/USD pair on 05/22/2019
| Fractal analysis of major currency pairs for May 23 Posted: 22 May 2019 07:35 PM PDT Forecast for May 23: Analytical review of H1-scale currency pairs: For the euro / dollar pair, the key levels on the H1 scale are: 1.1222, 1.1212, 1.1197, 1.1184, 1.1156, 1.1144 and 1.1112. Here, we continue to follow the development of the downward structure of May 13. Short-term downward movement is expected in the range between levels 1.1156 - 1.1144. The breakdown of the last value should be accompanied by a pronounced downward movement. In this case, the potential target is 1.1112. We expect a rollback to the top from this level. Short-term ascending movement is possible in the range between levels 1.1184 - 1.1197. Breaking the last value will lead to a prolonged correction. Here, the goal is 1.1212. The range 1.1212 - 1.1222 is a key support for the downward movement. We expect the initial conditions for the ascending cycle to reach it. The main trend is the downward structure of May 13. Trading recommendations: Buy 1.1184 Take profit: 1.1195 Buy 1.1198 Take profit: 1.1210 Sell: 1.1156 Take profit: 1.1145 Sell: 1.1142 Take profit: 1.1116 For the pound / dollar pair, the key levels on the H1 scale are: 1.2811, 1.2737, 1.2693, 1.2612, 1.2553, 1.2478 and 1.2428. Here, the next targets for the downward movement is determined from the local structure on May 21. Continuation of the movement to the bottom is expected after the breakdown at level 1.2612. Here, the target is -1.2553. The breakdown of which must be accompanied by a pronounced downward movement. In this case, the target is 1.2478. We consider the level of 1.2428 to be a potential value for the bottom. Upon reaching this level, we expect consolidation in the corridor 1.2478 - 1.2428, as well as a departure to the correction. Short-term upward movement is possible in the corridor 1.2693 - 1.2737. The breakdown of the latter value will have to form an upward movement. Here, the target is 1.2811. The main trend is a local downward structure of May 21. Trading recommendations: Buy: 1.2693 Take profit: 1.2735 Buy: 1.2738 Take profit: 1.2810 Sell: 1.2612 Take profit: 1.2555 Sell: 1.2550 Take profit: 1.2478 For the dollar / franc pair, the key levels on the H1 scale are: 1.0160, 1.0142, 1.0131, 1.0113, 1.0084, 1.0072 and 1.0048. Here, the price has entered an equilibrium state. Continuation of the movement to the top is expected after the breakdown at level 1.0113. In this case, the target is 1.0131 in the corridor 1.0131 - 1.0142 where a short-term upward movement is expected, as well as consolidation. The potential value for the top is considered to the level of 1.0160. After reaching which, we expect a rollback to the bottom. Short-term downward movement is possible in the corridor 1.0084 - 1.0072. The breakdown of the latter value will is necessary for the development of the downward structure. Here, the potential target is 1.0048, and up to this leve,l we expect the initial conditions for the downward cycle. The main trend is the equilibrium state. Trading recommendations: Buy : 1.0113 Take profit: 1.0130 Buy : 1.0142 Take profit: 1.0160 Sell: 1.0084 Take profit: 1.0073 Sell: 1.0070 Take profit: 1.0050 For the dollar / yen pair, the key levels on the scale are : 111.59, 111.31, 110.98, 110.81, 110.51, 109.96, 109.73 and 109.47. Here, we are following the development of the ascending cycle of May 13. Continuation of the movement to the top is expected after the breakdown of 110.51. In this case, the first target is 110.81. Short-term upward movement is possible in the corridor 110.81 - 110.98. The breakdown of the last value should be accompanied by a pronounced upward movement. Here, the goal is 111.31. A potential value for the top is considered at the level of 111.59. After reaching which, we expect a rollback to the bottom. The range of 109.96 - 109.73 is a key support for the upward movement. Its price passage will have to build up the potential for the downward cycle. In this case, the goal is 109.47. The main trend: the rising structure of May 13. Trading recommendations: Buy: 110.51 Take profit: 110.80 Buy: 111.00 Take profit: 111.30 Sell: 109.94 Take profit: 109.75 Sell: 109.70 Take profit: 109.48 For the Canadian dollar / US dollar pair, the key levels on the H1 scale are: 1.3541, 1.3516, 1.3482, 1.3468, 1.3452, 1.3425, 1.3409 and 1.3389. Here, we are following the formation of the potential value to the top on May 22. The breakdown at the level of 1.3452 will lead to the formation of a pronounced structure Here, the goal is 1.3468. The price passage of the noise range 1.3468 - 1.3482 must be accompanied by a pronounced upward movement. Here, the target is 1.3516. Potential value to the top is considered at the level of 1.3541. After reaching which, we expect a rollback to the bottom. Short-term downward movement is possible in the corridor 1.3425 - 1.3409. The breakdown of the latter value will lead to a prolonged correction. Here, the target is 1.3389. This level is a key support to the top. The main trend is the formation of the potential for upward movement of May 22. Trading recommendations: Buy: 1.3452 Take profit: 1.3468 Buy : 1.3484 Take profit: 1.3516 Sell: 1.3425 Take profit: 1.3410 Sell: 1.3407 Take profit: 1.3392 For the pair Australian dollar / US dollar pair, the key levels on the H1 scale are : 0.6932, 0.6917, 0.6901, 0.6891, 0.6861, 0.6848, 0.6838, 0.6813 and 0.6795. Here, we follow the formation of local initial conditions for the downward movement of May 20. Continuation of the movement to the bottom is expected after the breakdown of 0.6861. Here, the target is 0.6848. Consolidation is near this level. Passing through the noise range 0.6848 - 0.6838 will lead to the development of a pronounced movement. In this case, the target is 0.6813. Potential value for the bottom is considered at the level of 0.6795. After reaching which, we expect a rollback to the top. Short-term upward movement, perhaps is in the range of 0.6891 - 0.6901. The breakdown of the latter value will lead to a prolonged movement. Here, the goal is 0.6917. This level is a key support for the downward structure. The main trend is the formation of a local descending structure of May 20. Trading recommendations: Buy: 0.6891 Take profit: 0.6900 Buy: 0.6903 Take profit: 0.6916 Sell : 0.6860 Take profit : 0.6848 Sell: 0.6838 Take profit: 0.6815 For the euro / yen pair, the key levels on the H1 scale are: 124.43, 124.24, 123.91, 123.67, 123.40, 123.00, 122.68 and 122.34. Here, the price is close to the abolition of the ascending structure of May 15, which requires a breakdown of the level of 122.68. In this case, we expect the formation of the initial conditions for the downward cycle. The potential target is 122.34. Resumption of the upward trend is expected at level 123.40 after the breakdown. Here, the first potential target is 123.67, in the corridor 123.67 - 123.91. Short-term upward movement is expected as well as consolidation. The breakdown of the level of 123.91 should be accompanied by a pronounced upward movement to the level of 124.24. The potential value to the top is considered at level 124.43. After reaching which, we expect a rollback to the bottom. The main trend is the ascending structure of May 15, the stage of deep correction. Trading recommendations: Buy: 123.40 Take profit: 123.65 Buy: 123.68 Take profit: 123.90 Sell: 122.65 Take profit: 122.34 For the pound / yen pair, the key levels on the H1 scale are : 140.74, 140.22, 139.90, 139.14, 138.70, 138.36 and 137.49. Here, after the abolition of the ascending structure, we are following the local downward structure of May 21. Continuation of the movement to the bottom is expected after the breakdown of 139.14. In this case, the first goal - 138.70. Consolidation is in the corridor 138.70 - 138.36. For the potential value at the bottom, we consider the level of 137.50. The movement to which is expected after the breakdown of 138.34. Short-term upward movement is possible in the corridor 139.90 - 140.22. The breakdown of the latter value will lead to a prolonged correction. Here, the goal is 140.74. This level is a key support for the downward structure. The main trend is a local downward structure of May 21. Trading recommendations: Buy: 139.90 Take profit: 140.20 Buy: 140.24 Take profit: 140.72 Sell: 139.14 Take profit: 138.70 Sell: 138.34 Take profit: 137.55 The material has been provided by InstaForex Company - www.instaforex.com |
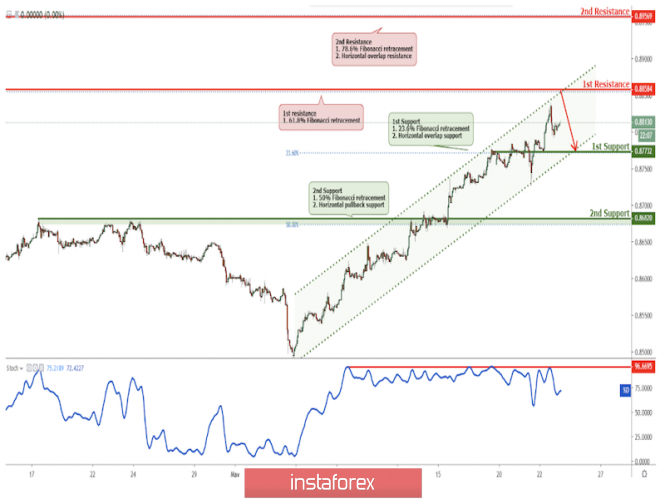
| EUR/GBP approaching resistance, potential drop! Posted: 22 May 2019 07:25 PM PDT
Price is approaching our first resistance level. Entry : 0.8858 Why it's good : 61.8% Fibonacci retracement, channel's resistance Stop Loss : 0.8956 Why it's good : horizontal overlap resistance, 78.6% Fibonacci retracement Take Profit : 0.8773 Why it's good :23.6% Fibonacci retracement, horizontal overlap support
|
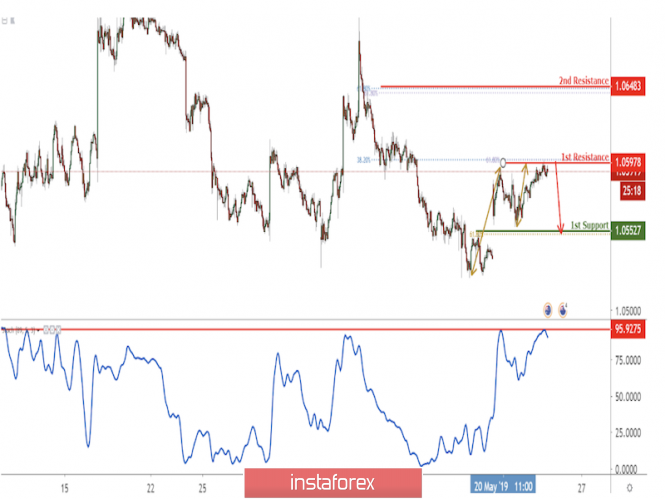
| AUD/NZD approaching resistance, potential reversal! Posted: 22 May 2019 07:22 PM PDT
Price is approaching its resistance at 1.0597 where it could potentially reverse to its support at 1.0552. Entry : 1.0597 Why it's good : horizontal swing high resistance, 61.8% Fibonacci extension,38.2% Fibonacci retracement Stop Loss : 1.0648 Why it's good : 61.8% Fibonacci extension, 61.8% Fibonacci retracement Take Profit : 1.0552 Why it's good : 61.8% Fibonacci retracement, horizontal pullback support
|
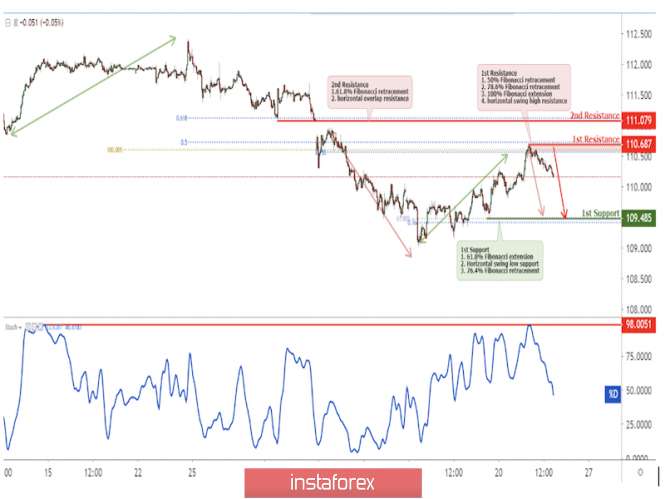
| USD/JPY reversed off key resistance, a drop is possible! Posted: 22 May 2019 07:19 PM PDT
USDJPY reversed off resistance, a drop to first support is possible Entry: 110.687 Why it's good : 100% Fibonacci extension, 78.6% & 50% Fibonacci retracement, horizontal swing high resistance Stop Loss : 111.079 Why it's good :61.8% Fibonacci retracement,horizontal overlap resistance Take Profit : 109.485 Why it's good: 61.8% Fibonacci extension, horizontal swing low support. 76.4% Fibonacci retracement
|
| Posted: 22 May 2019 06:16 PM PDT A comprehensive analysis of the options for the development of the movement from May 23, 2019 currency instruments EUR / USD h4 vs USD / JPY h4 vs EUR / JPY in the Minuette operating scale (H4 time frame) Minuette operational scale (h4) ____________________ Euro vs US Dollar The movement of the single European currency EUR / USD from May 23, 2019 will be determined by the direction of the breakdown of the range: -> resistance level of 1.1175 (reaction line RL23.6 Minuette operational scale forks); -> support level of 1.1160 (the initial line of the SSL Minuette operational scale forks). Accordingly, in the case of the breakdown of the resistance level of 1.1175 (RL23.6 Minuette), we will have an upward movement of this instrument to the boundaries of the 1/2 Median Line channel (1.1190 <-> 1.1205 <-> 1.1220) and the equilibrium zone (1.1220 <-> 1.1245 <-> 1.1265) Minuette operational scale fork. Thus, the downward movement of the EUR / USD pair will become possible with the breakdown of the support level of 1.1160 (the initial SSL line of the Minuette operational scale), whose goals will be -> the initial SSL line Minuette (1.1150) <-> 1/2 Median Line Minuette channel (1.1141 <-> 1.1120 <-> 1.1100). The marking options for the EUR / USD movements are shown in the animated graphic. ____________________ US dollar vs Japanese yen Further development of the USD / JPY movement from May 23, 2019 will be determined by testing the resistance level of 110.50 by 1/2 Median Line of the Minuette operational scale fork. If USD / JPY remains below the level of 110.50 (1/2 Median Line Minuette), then there will be an actual development of the downward movement of the exchange instrument to the boundaries of the equilibrium zone (110.10 <-> 109.70 <-> 109.25) Minuette operational scale fork. On the other hand, when the level of resistance 110.50 (1/2 Median Line Minuette) breakdown, then there will be an upward movement of the instrument which will be directed to the boundaries of the equilibrium zone (110.70 <-> 111.20 <-> 111.70) Minuette operational scale fork. The marking options for the USD / JPY movements can be seen at the animated graphic. ____________________ Euro vs Japanese Yen As of May 23, 2019, the development of the EUR / JPY cross-tool movement will occur, which will depend on the testing of the resistance level of 123.40 (upper boundary ISL61.8 of the Minuette operational scale fork). In case of a repeated breakdown of this resistance level - 123.40 (ISL61.8 Minuette) - the upward movement of the cross instrument will be directed to the 1/2 Median Line Minuette (123.70) and the equilibrium zone (124.30 <-> 125.00 <-> 125.6) of the Minuette operational scale fork. However, if the EUR / JPY price remains below the upper boundary of the ISL61.8 (123.40) equilibrium zone of the Minuette operational scale fork, then the movement of this instrument will be directed towards the targets -> Median Line of the Minuette (123.10) <-> ISL38.2 Minuette (122.7) <-> initial SSL line (122.25) Minuette operational scale fork. The marking options for the movements of the cross-instrument EUR / JPY are presented in the animated graphic. |
| EUR/USD 5 Star Sell Signal | Fundamental + Technical Analysis Posted: 22 May 2019 04:49 PM PDT
Fundamentals: Matteo Salvini's probable emergence with his league party expecting to boost the number of seats it holds from 6 to 27 currently could embolden a hardline stance on the nation's deficit or collapse the ruling coalition. Risks for Italian investors are two-fold in the wake of Parliamentary vote from 23-26 May if the League wins the elections which is in line with what the polls are suggesting. This adds on to the weakening sentiment driven by renewed tensions as US considers blacklisting 5 Chinese surveillance firms. Technicals: EUR/USD is in a bearish channel facing strong bearish momentum. We look to continue to play the drop down to our 1st support followed by our 2nd support. The material has been provided by InstaForex Company - www.instaforex.com |
| Posted: 22 May 2019 04:13 PM PDT The dollar went up before the "minutes" of the Fed. However, today's release, despite its significance, is likely to have a limited impact on the market. The US currency's growth is primarily due to the weak pound. The demand for the dollar is spurred by reports of new threats by the White House against Chinese technology companies. GBP issues The pound plunged to a new four-month low at 1.2641, since the latest version of Theresa May's plan to withdraw from the European Union was also a failure. The prime minister is almost completely deprived of support. May's position is not shared by either the opposition or her own party. A similar protest statement was received from the first minister of Scotland and the head of the Scottish National Party, Nicola Sturgeon. Traders saw this as a growing risk of a disorderly Brexit. "The responses of Tory, Labor and Eurosceptics were rather negative, and the new deal is unlikely to go through Parliament. The situation may change depending on the results of the Parliamentary elections in the EU, but it can also mean that May will resign over the weekend. Such a scenario was expected by the market, but yesterday it became more distinct," currency analysts wrote. Note that the elections to the European Parliament should be held from Thursday to Sunday. Nigel Faraj, a supporter of Brexit, has a good chance of winning. Opinions of leading Brexit strategists If in mid-March, banks surveyed by Reuters, saw a decreasing chance of Britain leaving the EU without a deal, now the situation has changed. This week, JPMorgan raised the probability of Brexit without a deal to 25% from 15%. Nordea estimates the probability of a "hard" exit at 15% versus 10% in March. The most pessimistic forecast was given by Mizuho strategists, estimating the chances of the chaotic "divorce" process at 50%. In addition, they warned of a possible precipitous fall in the GBP/USD pair before and after the elections in the EU. The remaining experts mainly adhered to previous forecasts, which ranged from 15-20%. The JPM reported that they were waiting for the Parliamentary elections and the postponement of Brexit until the end of the year. Broad market positioning on sterling suggests that the British currency is waiting for a storm. |
| Euro: a new argument for selling Posted: 22 May 2019 04:13 PM PDT As a rule, the dollar index increases if the US economy's growth accelerates, and the world economy slows down. The OECD lowered its estimate of global GDP in the current year to 3.2% from 3.3% previously and increased similar expectations across the US to 2.8% from 2.6%. This was another argument in favor of selling the EUR/USD pair. On Wednesday, the main pair traded at about the same levels as two days ago. On Tuesday, Brexit's topic provoked a jump in the volatility of European currencies, but later both the euro and the pound lost their points. The downward trend prevails, the euro is also under pressure from the upcoming elections to the European Parliament. Trade wars put pressure on the painful points of the world economy, and the US-China conflict turned out to be painful for it. If America introduces tariffs on all imports from China, this will subtract 0.6 pp from US GDP, and 0.8 pp from China for two years, the OECD estimated. However, the US stock indexes are trying to recover, despite the serious consequences of trade wars. Most market participants believe that Washington and Beijing will eventually come to a compromise. Most likely, this will not happen in June at the G20 summit in Japan, and later. However, the very fact of belief in resolving a trade conflict feeds risky assets. The topic of trade wars will be long-running, and this is a fact that is beyond doubt. The concerns of the FOMC representatives in this direction are absolutely justified. As noted by the head of the Federal Reserve Bank of St. Louis, James Bullard, weak inflation and the resumption of trade tensions are important arguments in favor of lowering the rate. He admitted that the Fed overdid it, tightening monetary policy in December. From the minutes of the Fed's May meeting, traders hope to receive a signal on future changes in interest rates. Few people expect to see "dovish" notes in the document. If there are any, the euro can go on a counterattack. A prerequisite for such a movement is a breakthrough of $1.119. If the main pair leaves the lower limit of the consolidation range of $1.1135-1.1265, it will open the way to the level of $1.1. Do not forget about the extremely unstable situation with Brexit, which continues to make itself felt. The British prime minister is under increasing pressure to withdraw from the deal and resign. |
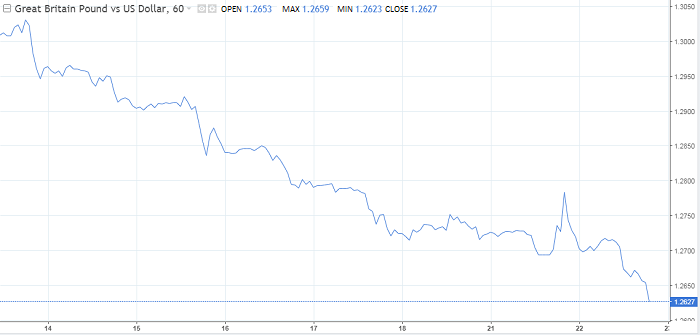
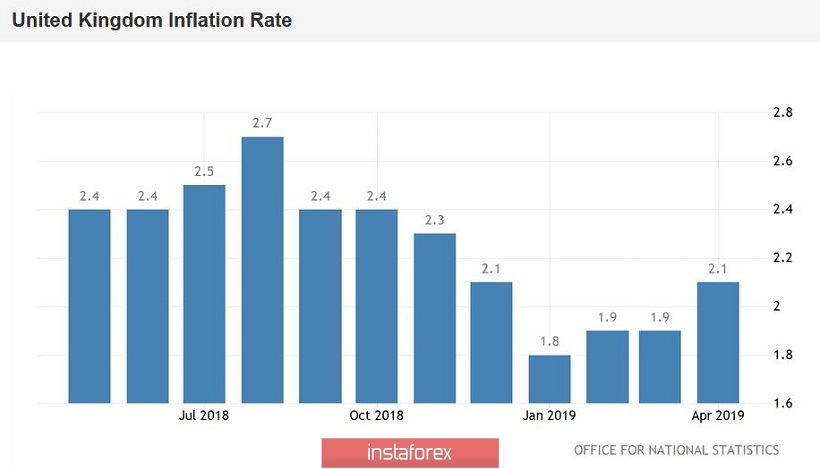
| The pound is in a steep dive: the draft deal with the EU is doomed to failure Posted: 22 May 2019 03:52 PM PDT Today, the pound/dollar pair has updated its annual low, dropping to 1.2623. The last time the price was at such a low was in January of this year, when the British Parliament for the second time rejected May's proposed deal with the EU. Back then the pair collapsed impulsively to the level of 1.2670, after which it almost immediately (within a week) recovered in the region of 30 figures. Therefore, today's decline can be considered an annual anti-record: the price has dropped only in December last year (1.2436), and before that - in 2017, when, against the background of failed negotiations with the EU, the pound was trading in the area of 23-24 figures. The current price dynamics is also explained by Theresa May's failure: her presentation of the "renewed" Brexit deal failed miserably, despite an attempt to please the main political forces in Parliament. Even a tempting (at first glance) proposal to hold a vote for a repeat referendum was received coolly by the House of Commons. This is understandable, because in exchange, May demanded that the agreement be approved on first reading, which is absolutely unacceptable both for Labour and for some of the Conservatives, not to mention the Unionists. "The old deal in a new packaging" - as described by the leader of the Labour Party, Jeremy Corbyn in yesterday's speech in Parliament. According to him, the prime minister, in fact, voiced the same proposals that were already discussed during the inter-party negotiations, which ended in late April with complete failure. All the main points of the deal relating to market regulation, customs union issues and consumer protection remained intact. Therefore, Laborites did not go in the wake of the cabinet ministers and refused to support the deal - even in exchange for the promised vote to hold a new referendum. Indeed, it is one thing to achieve a vote on this issue, but finding supporters of this idea is a completely different matter. Here it is worth recalling the March events, when the deputies of the House of Commons held an indicative vote, the results of which were not obligatory for execution — its results only made it possible for us to understand what moods were hovering among British MPs. So, among the 8 proposed deals there was also the "M" variant, which implies a repeated referendum on the country's withdrawal from the EU. This initiative was supported by 268 MPs, while 295 were against it. Previously, such ideas were also categorically rejected by the House of Commons, with a much larger margin of votes. In other words, supporters of the repeated referendum do not have any certainty that if they exchange their votes for putting this question to the vote, they will get the desired result. Therefore, the Labour Party made a predictable political decision - they stepped aside and took a wait-and-see attitude. But the battles inside the Conservative Party continue. After yesterday's failure, many party members of May again called on her to resign. According to the British press, earlier she promised members of the "1922 Committee" that in any case, she would leave her post at the beginning of the summer, regardless of the outcome of the vote. But if the fourth attempt to push the deal through the millstones of the House of Commons again ends in defeat, its political fate will in any case be predetermined. Thus, the pound is plummeting for two interrelated reasons. First, the "renewed" deal was received coolly by the House of Commons: some deputies did not see anything new there, others saw absolutely unacceptable ideas. As a result, the draft deal did not find new supporters, but lost many of the "fans" who supported May in January. All this suggests that the June vote will repeat the fate of the January vote - with all the ensuing consequences. The consequences will not keep you waiting: Boris Johnson, a supporter of the most severe version of Brexit, continues to be a favorite of the political struggle for the chair of the British government. According to most analysts, his coming to power will open the way to the implementation of a hard "divorce process" scenario with the EU. Actually, the hypothetical (but very likely) victory of Johnson is the second reason why the pound swoops down. Traders currently do not see any alternatives to this scenario, so they are actively getting rid of the British currency. Good data on inflation in the UK also did not add to the pound's appeal. On the one hand, the consumer price index has grown - both in annual (2.1%) and in monthly (0.6%) terms. However, experts expected a more substantial increase (0.7% and 2.2% respectively), so the release did not support the GBP/USD pair. Core inflation remained at 1.8% - at this level, the indicator has been released since February of this year (while analysts had expected growth to 1.9% in April). An ambiguous impression of the release was compensated by the retail price index, which jumped from a zero level to 1% in monthly terms, and grew up to 3% at an annualized rate, updating the 4-month high. However, macroeconomic statistics remain in the shadow of political battles. According to rumors, Theresa May can already resign this weekend, if the ongoing backstage talks with deputies end in nothing (which is quite likely). In this case, all the attention of GBP/USD traders will focus on the rhetoric of Boris Johnson, who is likely to head the cabinet after the inner-party elections. If he again accepts the likelihood of a hard Brexit, the pound against the dollar will drop to at least the 24th figure (the bottom line of the Bollinger Bands indicator on the monthly chart). In all other cases, the GBP/USD pair can quickly restore its position in the hope of a new round of negotiation process with Brussels. The material has been provided by InstaForex Company - www.instaforex.com |
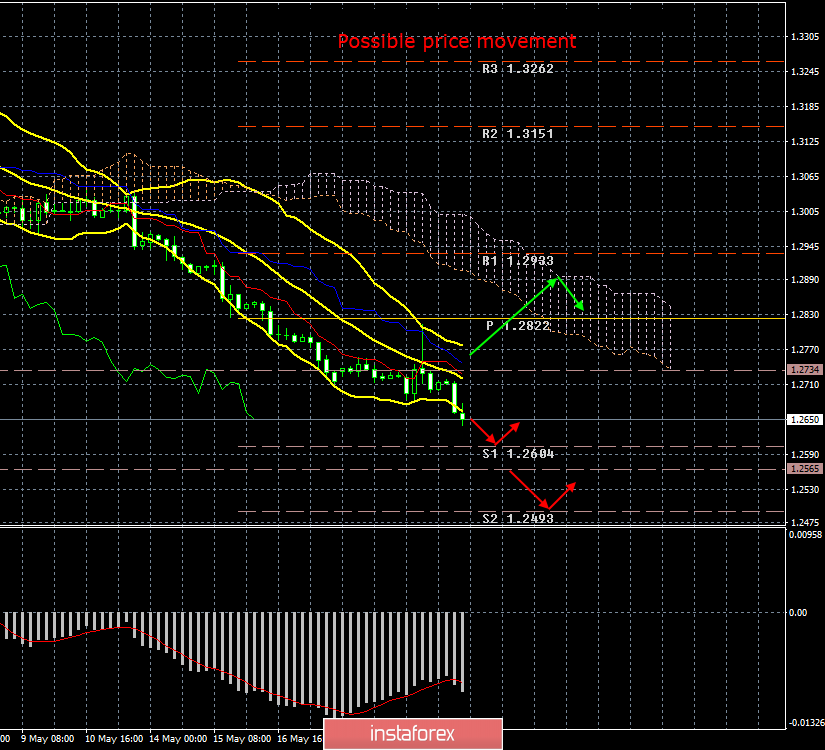
| Posted: 22 May 2019 03:39 PM PDT 4-hour timeframe The amplitude of the last 5 days (high-low): 97p - 64p - 86p - 42p - 129p. Average amplitude for the last 5 days: 84p (72p). The pound sterling, after a correction to the critical line, based perhaps on the assumption of Theresa May holding a second referendum, very quickly resumed the downward trend. As it turned out, the "second referendum" statement was no more than the prime minister's trick in another attempt to once again push her Brexit deal through Parliament. Therefore, the forex market's optimism was immediately offset. Today, a report on inflation was published in the UK, and it turned out that the consumer price index accelerated to 2.1% in April, but turned out to be lower than the forecast value. Therefore, traders received a new reason to sell the pound and rushed to open new short positions. Next, Theresa May will most likely retire within a few months, and tomorrow the elections to the European Parliament will start, in which the United Kingdom will take part. According to many experts, the victory in this election from the UK will be won not by the Labour Party and the Conservatives, but by the Brexit party headed by Nigel Faraj, who was the initiator of Brexit. By and large, for the pound it does not matter who wins the elections to the European Parliament. The pound is only interested in the political situation inside the country and the question of when the Brexit procedure will end at least somehow. Any decision of the Parliament is required - whether it is a rejection of Brexit or a "hard" scenario. In any other case, the pound will be prone to falling further. The resignation of Theresa May can have a positive impact on the pound, but it is unlikely for a long period of time, since all the problems of the country will remain in place until the new prime minister resolves them. Trading recommendations: The GBP/USD currency pair resumed its downward movement. Therefore, it is now recommended that you re-consider in selling the pound sterling with target support levels of 1,2604 and 1,2565. Buy orders could be considered in small lots only when the price has consolidated above the Kijun-sen line with a first target of the Senkou span B. The mood on the GBP/USD currency pair remains frankly bearish. In addition to the technical picture also take into account the fundamental data and the time of their release. Explanation of the illustration: Ichimoku indicator: Tenkan-sen - the red line. Kijun-sen - the blue line. Senkou Span A - light brown dotted line. Senkou Span B - light purple dotted line. Chikou Span - green line. Bollinger Bands indicator: 3 yellow lines. MACD Indicator: Red line and histogram with white bars in the indicator window. The material has been provided by InstaForex Company - www.instaforex.com |
| Posted: 22 May 2019 03:28 PM PDT 4-hour timeframe The amplitude of the last 5 days (high-low): 47p - 58p - 29p - 24p - 46p. Average amplitude for the last 5 days: 41p (40p). The euro/dollar currency pair started a second round of upward correction on May 22 with a view to the Kijun-Sen line. The MACD indicator did not even have time to turn down, therefore, in general, the correctional mood among traders remains. As we expected in the morning, the head of the ECB, Mario Draghi, did not say anything important in his speech. This is evident even in the volatility of the EUR/USD pair, which remains low, only about 40 points a day. The publication of the minutes of the last Fed meeting is also scheduled for tonight. However, we believe that this document will also not contain any important and fundamentally new information. Recently, among traders, the topic of inflationary pressure on the US economy is often discussed. We believe that this topic does not deserve so much attention in the context of forecasting the movement of the euro/dollar. Inflation in recent months and years has been stable at about 2%, naturally, not without hesitation, but in general, the market's response to this indicator is present only on the days of the publication of inflation reports. In general, it cannot be said that inflation has a strong influence on monetary policy or its current value is causing great concern among traders and economists. In general, the US economy feels just fine, despite all the experts' concerns about recession, trade wars and the world community's disapproval over some of Donald Trump's actions. The US dollar is growing and growing, especially against European currencies. Thus, we believe that the in the evening, the "Fed minutes" is nothing more than a formality. In the end, traders are most interested in the information that may affect the dollar. The Fed is not going to reduce or raise the rate in the coming months. Stimulation of the economy is not required. Inflation is at a stable level, wages are rising, the labor market is in good condition. Trading recommendations: EUR/USD continues the correction. A new price rebound from the critical line may trigger the completion of the correction, and in this case it is recommended to sell the euro to the support level of 1,1124. It is recommended to return to buying if the bulls manage to overcome the Kijun-sen line. In this case, the first target for buying the currency pair will be the level of 1.1206. In addition to the technical picture also take into account the fundamental data and the time of their release. Explanation of the illustration: Ichimoku indicator: Tenkan-sen - the red line. Kijun-sen - the blue line. Senkou Span A - light brown dotted line. Senkou Span B - light purple dotted line. Chikou Span - green line. Bollinger Bands indicator: 3 yellow lines. MACD Indicator: Red line and histogram with white bars in the indicator window. The material has been provided by InstaForex Company - www.instaforex.com |
| Technical analysis for EURUSD for May 22, 2019 Posted: 22 May 2019 01:09 PM PDT EURUSD bulls tried to push prices higher but they were stopped by stronger sellers. Price has produced to upper candlestick tails depicting the inability of bulls to reach 1.12 and the strength of sellers pushing price lower each time rose towards 1.1180-1.1190.
Red rectangle- support area Green rectangle - selling pressure In previous posts I said that I was expecting prices to bounce towards 1.12-1.1230. Price made a small move higher but sellers intercepted and pushed price back down towards 1.1150. EURUSD is trading on major support zone. Breaking below this red zone will imply that a move towards 1.10 is following. Resistance remains at the red trend line resistance at 1.1230-1.1240. Previous high at 1.1260 remains key reversal level. The material has been provided by InstaForex Company - www.instaforex.com |
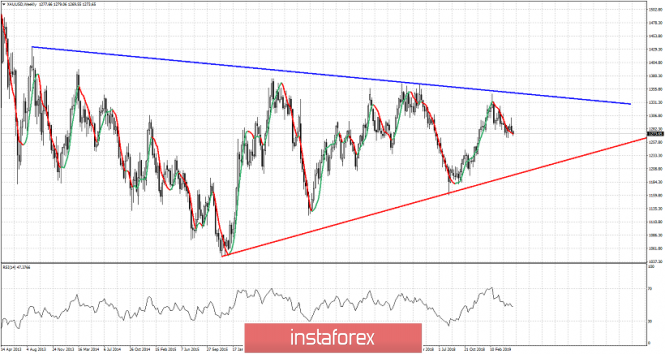
| Technical analysis for Gold on a weekly time frame Posted: 22 May 2019 01:04 PM PDT Gold price remains in a weekly down trend after getting rejected at $1,350 area. Price has potential to go towards $1,210 as explained in previous weekly chart analysis. Gold price current action confirms this view if we break below $1,266.
Red line - long-term support trend line Gold price peaked at the start of the year near the blue trend line resistance and reversed lower. This rejection has increased the chances of a pull back towards the red trend line support, continuing the triangle pattern formation. Short-term support at $1,266 is an important level to watch out for. Breaking below $1,266 increases even more the chances of price reaching the red trend line. The RSI is far from oversold with a negative slope. Trend remains bearish. Major resistance is found at $1,300. Bulls need to recapture this level in order to regain control. The material has been provided by InstaForex Company - www.instaforex.com |
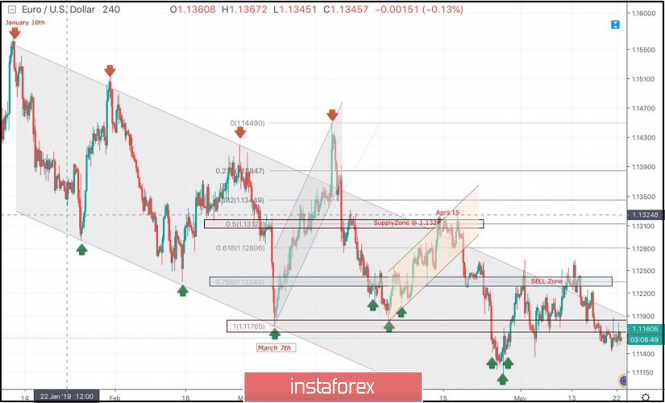
| May 22, 2019 : EUR/USD Intraday technical analysis and trade recommendations. Posted: 22 May 2019 10:56 AM PDT
On January 10th, the market initiated the depicted bearish channel around 1.1570. Since then, the EURUSD pair has been moving within the depicted channel with slight bearish tendency. Few weeks ago, a bullish Head and Shoulders reversal pattern was demonstrated around 1.1200. This enhanced further bullish advancement towards 1.1300-1.1315 (supply zone) where significant bearish rejection was demonstrated on April 15. Short-term outlook turned to become bearish towards 1.1235 (78.6% Fibonacci) then 1.1175 (100% Fibonacci level). For Intraday traders, the price zone around 1.1235 (78.6% Fibonacci) stood as a temporary demand area which paused the ongoing bearish momentum for a while before bearish breakdown could be executed on April 23. On May 13, another bullish pullback was executed towards the mentioned price zone (1.1230-1.1250) where the current bearish movement was initiated. On the other hand, the EURUSD pair has been trapped above the next key-zone (1.1175) until last Friday when a bearish breakout below 1.1175 was achieved. Further bearish decline should be expected towards 1.1115 provided that the price level of 1.1190 remains defended by the EURUSD bears. Trade recommendations : Conservative traders who were advised to have a SELL entry around the supply zone (1.1235-1.1250) should lower their S/L towards 1.1190 to secure more profits. Remaining Target level should be projected towards 1.1115. The material has been provided by InstaForex Company - www.instaforex.com |
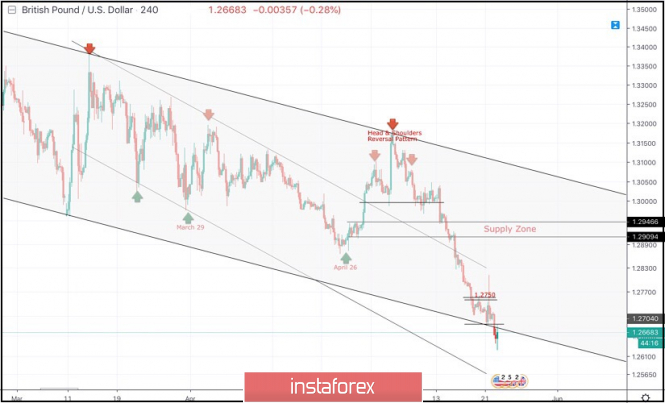
| May 22, 2019 : GBP/USD Intraday technical analysis and trade recommendations. Posted: 22 May 2019 09:29 AM PDT
On March 29, a visit towards the price levels of 1.2980 (the lower limit of the newly-established bearish movement channel) could bring the GBPUSD pair again towards the upper limit of the channel around (1.3160-1.3180). Since then, Short-term outlook has turned into bearish with intermediate-term bearish targets projected towards 1.2900 and 1.2850. On April 26, another bullish pullback was initiated towards 1.3000 (the same bottom of March 29) which has been breached to the upside until May 13 when evident bearish rejection was demonstrated. Hence, a bearish Head and Shoulders pattern was expressed on the H4 chart with neckline located around 1.2980-1.3020. That's why, the price zone of 1.3000-1.3020 turned to become a prominent supply-zone where a valid bearish entry was offered few weeks ago. Bearish persistence below 1.2980 (Neckline of the reversal pattern) enhanced further bearish decline. Initial bearish Targets were already reached around 1.2900-1.2870 (the backside of the broken channel) which failed to provide any bullish support for the pair. Further bearish decline was demonstrated towards the lower limit of the long-term channel around (1.2700-1.2670). The GBPUSD pair looks oversold around the current mentioned price levels (1.2670-1.2700). However, no signs of bullish recovery are worth mentioning. Bullish persistence above 1.2690 and 1.2750 is needed to enhance the bullish side of the market on the short-term. Otherwise, further bearish decline should be expected towards 1.2560. Trade Recommendations: Conservative traders should wait for another bullish pullback towards 1.2870-1.2905 (newly-established supply zone) to look for valid sell entries. S/L should be placed above 1.2950. The material has been provided by InstaForex Company - www.instaforex.com |
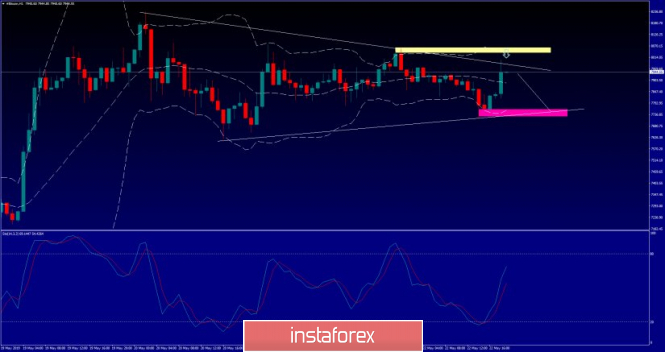
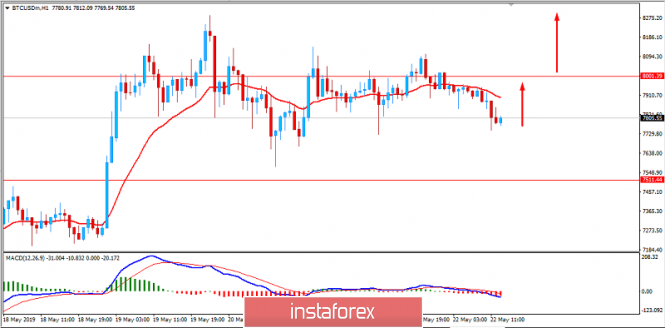
| Bitcoin analysis for May, 22.2019 Posted: 22 May 2019 09:12 AM PDT BTC price has rejcted of the key supply trendline at $8.000 and is trading just below $7.925. Symmetrical triangle is in creation and we see potential for re-test of the low at $7.727.
Yellow rectangle - horizontal resistance Punc rectangle- key support White lines – Symmetrical tirangle boundiries BTC price did nice test-reject of white downward sloping line (resistance), which is bearish sign so far. Next support is at $7.715 and if broken we expect BTC to continue lower towards $7.615. As long as the BTC is trading below key resistance $8.233, we are bearish. The material has been provided by InstaForex Company - www.instaforex.com |
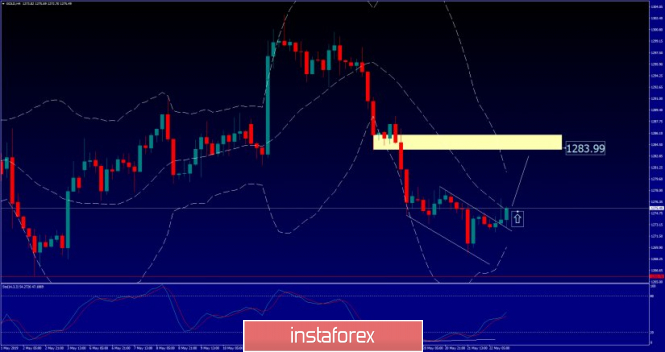
| Analysis of Gold for May, 22.2019 Posted: 22 May 2019 08:45 AM PDT Gold price has rejcted of the $1.2669 and is trading just above $1.275. Bullish divergence on the Stochastic may lead Gold to $1.283.
Yellow rectangle - horizontal resistance Red line- key support White downward sloping line - resistance trend line (broken) Gold price is breaking aboive the white downward sloping line (resistance), which is positive sign so far. Next resistance is at $1.278 and if broken we expect Gold to continue higher towards $1.283. The bullish divergence on the slow Stochastic is present, which only adds more potentail strength. As long as the Gold is trading above $1.265, we are bullish. The material has been provided by InstaForex Company - www.instaforex.com |
| GBPUSD: Pound sellers ignore strong inflation, although this should not be done Posted: 22 May 2019 08:36 AM PDT The British pound continues its fall against the US dollar, and it seems that the current downward trend will not be completed soon, although the correction, not counting yesterday's upward momentum after the performance of Theresa May, was not for a long time. The pound was not helped by today's inflation data, which rose substantially in April of this year, exceeding the Bank of England's target level of 2%. This suggests that the regulator should think about raising interest rates, but it is unlikely that this will be done in the face of uncertainty associated primarily with Brexit. According to a report by the National Bureau of Statistics of the United Kingdom, consumer prices in the UK rose by 2.1% in April compared with the same period last year, after rising 1.9% in March. It is worth noting that inflation exceeded its target level for the first time since December 2018. The report indicates that growth is directly related to the increase in gasoline prices, as well as air tickets. Let me remind you that yesterday, British Prime Minister Theresa May introduced even more uncertainty in the situation associated with Brexit. May presented a new plan, designed to provide Parliament with support for its divorce proposal package with the European Union, and also stated that she was not opposed to holding a second referendum on Brexit, but on condition that her plan would be adopted by Parliament. As for the technical picture of the GBPUSD pair, the pound continues to push down against the US dollar. New monthly lows around 1.2620 have been reached. A breakthrough of this range will keep the bearish trend and will open a direct path to the support of 1.2500 and 1.2430. As for the upward correction, it will be possible to talk about it seriously only after the return and consolidation of the trading instrument above the resistance of 1.2680. The speech of the President of the Federal Reserve Bank of St. Louis, James Bullard, went unnoticed by the market. The representative of the Fed said that the Committee would be forced to lower the key interest rate if inflation does not show signs of a return to the desired levels. Bullard believes that if the new data on inflation disappoint again, the Fed may hint at a likely change in the monetary policy rate. As for the technical picture of the EURUSD pair, the further downward movement will depend on the support level of 1.1140, a breakthrough of which will only increase the pressure on risky assets and lead to an update of the minimum of 1.1110. The growth of the euro will be limited to the upper limit of the side channel in the area of 1.1190. The material has been provided by InstaForex Company - www.instaforex.com |
| GBP/USD: plan for the US session on May 22. The pound is expected to continue to decline Posted: 22 May 2019 08:35 AM PDT To open long positions on GBP/USD, you need: Buyers showed themselves in the support area of 1.2614, which I drew attention to in my morning review, and now their goal is to return to the resistance level of 1.2680, on which a further upward correction will depend, the goal of which will be the highs of 1.2747 and 1.2808. In the scenario of a re-decline in the minimum area of 1.2614, it is best to open long positions from there, provided that a false breakdown is formed or to rebound from the minimum of 1.2564. To open short positions on GBP/USD, you need: Bears continue to push the pound down after the recent statements by Theresa May. The formation of a false breakdown in the resistance area of 1.2680 will lead to a new wave of short positions in the pound and a decrease in the pair to the minimum area of 1.2614, the breakthrough of which will provide sellers with a way to the support area of 1.2564, where I recommend fixing the profits. With a growth scenario above 1.2680, it is best to return to short positions on a rebound from 1.2747. Indicator signals: Moving Averages Trading is below 30 and 50 moving averages, indicating a bearish market. Bollinger Bands In the case of the pound growth, the upward trend will be limited by the middle of the indicator around 1.2680. Description of indicators
|
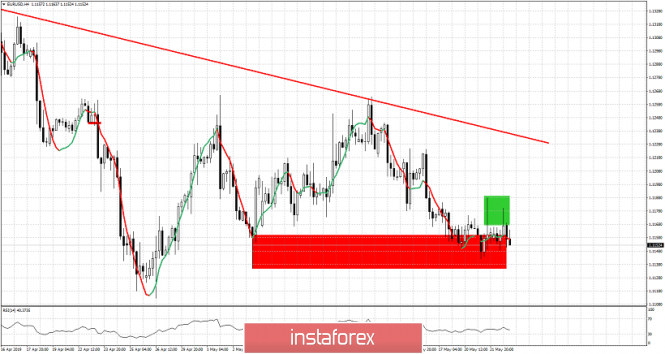
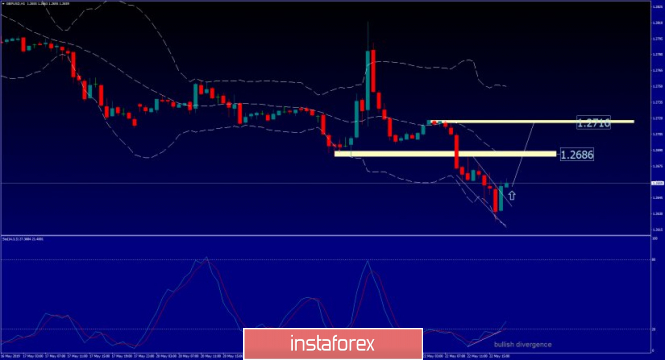
| GBP/USD analysis for May, 22.05.2019 Posted: 22 May 2019 08:31 AM PDT GBP price has rejcted of the lower Bollinger band at 1.2623 and is trading just above 1.2657. Bullish divergence on the Stochastic may lead GBP to 1.2686-1.2715 zone.
Yellow rectangle - horizontal resistance Yellow rectangle 2- horizontal resistance 2 White downward sloping line - resistance trend line (broken) GBP price is breaking aboive the white downward sloping line (resistance), which is positive sign so far. Next resistance is at 1.2686 and if broken we expect GBP to continue higher towards 1.2716 The bullish divergence on the Stochastic is confirming the positive feedbak. As long as GBP remains above 1.2620 we remain bullish. The material has been provided by InstaForex Company - www.instaforex.com |
| Bitcoin to surge higher above $8,000? May 22, 2019 Posted: 22 May 2019 06:30 AM PDT Bitcoin has not managed yet to maintain a rally and surge above $8,000 again forming a major False Breakout. Bitcoin has been extremely bullish since early April when it was trading at just over $4,000. A few negative incidents and a bit of mainstream FUD have done nothing to temper the momentum which has sent BTC to 2019 highs of $8,250 twice in the past week. The current daily volume is $25 billion, still higher than it has been for most of the past 12 months. Even though the price is stuck below $8,000, we know that corrections are necessary for healthy markets. At the moment, the next level of resistance that BTC must surge above is seen around $8,200, and if this level is broken, the cryptocurrency may move higher towards $9,000 and later towards $9,300 as well. It now appears that the lower $9,000 region is Bitcoin's monthly resistance level, which means that it will require a significant amount of buying pressure to be broken above. As for the current scenario, the price is dipping below $8,000 indicating an upcoming upward momentum. As far as the price remains above the $7,500 area with a daily close, the bullish bias is expected to continue targeting $9,000 and later Bitcoin can move towards the round number of $10,000. SUPPORT: 7,250 / 7,500 RESISTANCE: 8,000 / 8,300 / 8,500 / 9,000 BIAS: BULLISH MOMENTUM: VOLATILE
|
| Posted: 22 May 2019 06:23 AM PDT As soon as gold spread its wings, they were immediately clipped by rising US stocks and the dollar. The 90-day postponement for Huawei counterparties was regarded by investors as a certain thaw in US-Chinese relations. In addition, officials from the White House continue to assert that the deal will ultimately be concluded and the ambassador to China in the United States says that Beijing is ready to resume negotiations. Perhaps the situation is not as critical as is commonly believed? According to JP Morgan, trade wars are a long-running topic. Already in summer and industrial production around the world will face another round of weakness, which will adversely affect stock indexes. Their rally from the beginning of the year looks excessive. Investors were too self-confident about the imminent termination of trade friction and completely forgot about hedging risks. In May, the situation radically changed. Even the growth of the S & P 500 forces them to increase the share of safe havens in case of unforeseen circumstances. In such an environment, the position of the yen and gold should improve. Dynamics of gold and Japanese yen What is happening at the end of May while it goes against the recommendations of JP Morgan? Donald Trump and his team managed to stabilize the stock market, which perceives the slightest positive as a reason for growth and is not particularly sensitive to bad news. At the same time, increasing political risks in Europe are putting pressure on the euro and the pound, helping to strengthen the USD index. The combination of a strong dollar and S & P is a deadly mixture for gold, but the precious metal problems do not end there. According to Commerzbank, one of the reasons for the depressed mood of the bulls on XAU/USD is the weak yuan. China is the largest consumer of gold and the USD/CNY rally makes its import to the Middle Kingdom more expensive. However, judging by the activity of central banks, they may well compensate for the potential reduction in demand for precious metals in Asia. In April, the People's Bank of China and the Bank of Russia bought 15 tons each. Kazakhstan's gold reserves increased from 11.63 million to 11.79 million ounces, and Turkey's reserves by 50 thousand ounces. Gold does not help even the next inversion of the yield curve. In May, the differential rates between 10-year bonds and 3-month bills once again slipped into the red zone. The indicator accurately determined the future recession from 1975. Nevertheless, the difference in the yield of 10 and 2-year securities has not yet been marked by negative values, which allows Bloomberg experts to shift the expected time of the decline of the US economy from 2020 to 2021. Dynamics of yield curves in the US In the short run, the XAU/USD dynamics can be affected by the contents of the minutes of the Fed and the ECB, as well as the data on European business activity for May and the results of the elections to the European Parliament. If under the influence of weak statistics and growing political risks, the EUR/USD pair drops to 1.1 while gold risks continuing the downward movement. Technically, a breakthrough of the lower limit of the consolidation range of $1265-1310 per ounce will allow the "bulls" of precious metals to count on the implementation of target by 161.8% using the AB = CD pattern. Gold daily chart |
| Posted: 22 May 2019 05:39 AM PDT To open long positions on EURUSD, you need: A small consolidation above the resistance of 1.1166 leaves hopes for buyers to return to the maximum of this week in the area of 1.1187, where I recommend fixing the profits, as it will be quite difficult to break higher. When the correction down in the afternoon and return to the support of 1.166, the same morning minimum of 1.1143 will serve as a support for buyers. Otherwise, it is better to open long positions on the rebound from the area of 1.112. To open short positions on EURUSD, you need: Bears need to return to the support of 1.11166, which will retain the downward potential and will lead to a further decline in EUR/USD to the support area of 1.143 and 1.112, where I recommend fixing the profits today. In the scenario of further growth of EUR/USD, the formation of a false breakdown in the resistance area of 1.1187 will be the first sell signal. Short positions can be opened immediately to rebound from a maximum of 1.1205. Indicator signals: Moving Averages Trading is conducted in the area of 30 and 50 moving averages, which indicates a slowdown in the downward trend. Bollinger Bands The volatility of the indicator is low, which does not give signals to enter the market. Description of indicators
|
| What will be said on the "minutes" of the Fed? Posted: 22 May 2019 04:35 AM PDT High-profile geopolitical events overshadowed the debate about the fate of the Fed interest rate. The growth of anti-risk sentiment supports the US currency, despite the controversial macroeconomic statistics of the United States. The dollar enjoys the status of a defensive asset, playing the role of a kind of "security island" for investors. And yet, despite the deepening trade conflict between the United States and China, monetary policy prospects should remain in sight of traders. Indeed, over the past year and a half, Beijing and Washington have repeatedly "beat the pots" and left the negotiation process, but after a while, they still sat down at the negotiating table. If such a scenario is realized this time, the focus of the market will shift again to the Fed. In this context, today's release is important. We are talking about the minutes of the last Fed meeting, which was held in early May. It is worth recalling that this meeting left a rather ambiguous impression. After the publication of the accompanying statement, the dollar collapsed throughout the market but Jerome Powell's subsequent comments were in favor of the US currency. First of all, the head of the Fed has smoothed over the "sharp corners" of the accompanying statement, refuting market rumors about the next steps of the regulator towards easing monetary policy. At his traditional press conference, he stated that he currently does not see compelling reasons for changing the base interest rate both upwards and downwards. On the one hand, he acknowledged that core inflation declined "quite unexpectedly," but this dynamic is due to "temporary factors in his opinion. Such rhetoric of Powell surprised market participants as his words went against the rhetoric of the accompanying statement. According to the text of the final communique, the Fed members do not consider the current trend to be "temporary" since, in their opinion, we can speak of a stable trend here. In other words, Fed members do not share the optimistic position of the head of the regulator. Today's protocol will make it possible to understand how deeply Fed members are concerned about the weak dynamics of inflation growth in the context of monetary policy prospects. If the majority of them voiced "dovish" rhetoric, the dollar can be under some pressure as rumored. But here it is worth mentioning right away that today's release may have a limited impact on the market if only traders see nothing "supernatural" there. First, after the May meeting, many Fed members have already expressed their position on the current situation based on more recent data. In particular, Jerome Powell yesterday spoke out against lowering interest rates (at least in the short term) due to the high level of corporate debt. Many Fed members, in addition to such consistent "dovish" like Bullard or Kashkari, also spoke in favor of maintaining a waiting position. As for statistics, the situation here is ambiguous. Against the background of strong growth in the labor market and the GDP indicator, the inflation dynamics still leaves much to be desired. In particular, the US consumer price index showed a controversial result. It rose to two percent in annual terms but did not reach the forecast level of 2.1% and showed a negative trend in the indicator on a monthly basis. The index dropped to 0.3% instead of the expected growth to 0.5%. Core inflation also turned out to be motley while the indicator rose to 2.1% on an annualized basis, as predicted by the experts. Then in monthly terms, the core index unexpectedly slowed down to 0.1% instead of the expected growth to 0.2%. Also in May, another alarming signal was sounded in the form of weak wage growth. Contrary to the positive forecasts of most analysts, the indicator remained at the level of March, where it grew by 0.2% in monthly terms and by 3.2% in annual terms. Experts expected an increase of 0.3% and 3.3%, respectively. In general, the result is not the worst but in this case, the trend itself is important, which is, to put it mildly unconvincing. Thus, today's release may remind traders of the weak side of the US economy: inflationary indicators still show disappointing dynamics, despite the growth of other key macroeconomic indicators. The minutes of the May meeting of the Fed will make it possible to understand how strongly the regulators are concerned about this fact and how many of them are ready to consider the option of easing monetary policy in the foreseeable future. If the protocol rhetoric does not like dollar bulls, the EUR/USD pair will have a chance to develop a corrective movement with the first target of 1.1190 (the Bollinger Bands middle line on the daily chart) and the subsequent target of 1.1220 (Tenkan-sen and Kijun-sen lines). The material has been provided by InstaForex Company - www.instaforex.com |
| Trading Plan for EUR/USD pair on 05/22/2019 Posted: 22 May 2019 04:26 AM PDT The big picture: Theresa May failed to inspire optimism in European currencies. On Tuesday, British Prime Minister Theresa May presented a new, final Brexit plan. This plan even allows for a second referendum. However, having seen the details of the plan, the experts decided that this attempt would not be successful and May is likely to be forced to resign this summer. On Tuesday, the pound and the euro rose in the short run - but retreated back. EUR/USD: We are waiting for a break below the zone of 1.1110 - 1.1130 and the beginning of a strong downtrend. We sell from 1.1130. Alternative: We buy from 1.1225. |


| You are subscribed to email updates from Forex analysis review. To stop receiving these emails, you may unsubscribe now. | Email delivery powered by Google |
| Google, 1600 Amphitheatre Parkway, Mountain View, CA 94043, United States | |
No comments:
Post a Comment