Forex analysis review |
- GBP / USD h1. Options for the development of the movement from May 31, 2019 Analysis of APLs & ZUP
- EUR / USD h1. Options for the development of the movement from May 31, 2019 Analysis of APLs & ZUP
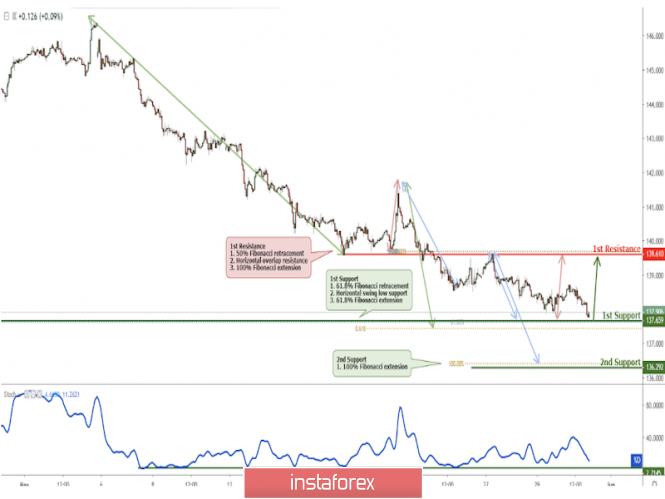
- GBP/JPY approaching support, big potential bounce coming!
- GBP/JPY approaching support, big potential bounce coming!
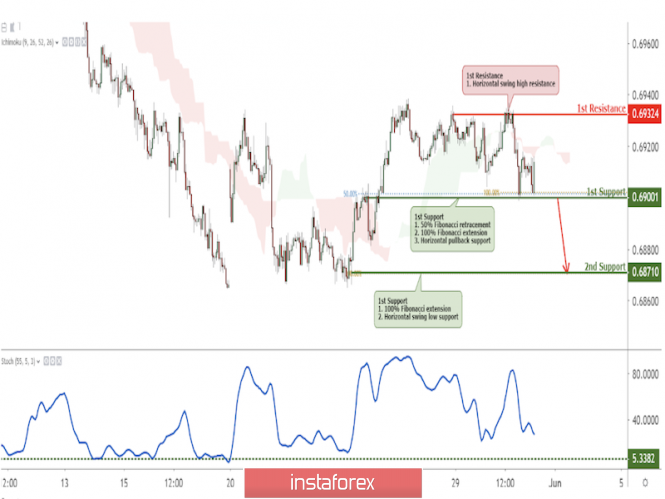
- AUD/USD testing support, potential breakout!
- Fractal analysis of major currency pairs on May 31
- USD/JPY reversed off key resistance, a drop is possible!
- EUR / USD. Southern Trend Coalition: China, Brexit and Italy
- Game of thrones in the EU: Germany's loss will win the Euro
- Technical analysis for EURUSD for May 30, 2019
- Technical analysis for Gold for May 30, 2019
- Bitcoin analysis for May, 30.2019
- May 30, 2019 : EUR/USD Intraday technical analysis and trade recommendations.
- May 30, 2019 : GBP/USD Intraday technical analysis and trade recommendations.
- EUR/USD analysis for May 05/30.219
- The Fed is holding on with its last strength not to lower rates
- Analysis of Gold for May, 30.2019
- The appointment of Jens Weidmann as head of the ECB will cause a rally of euro
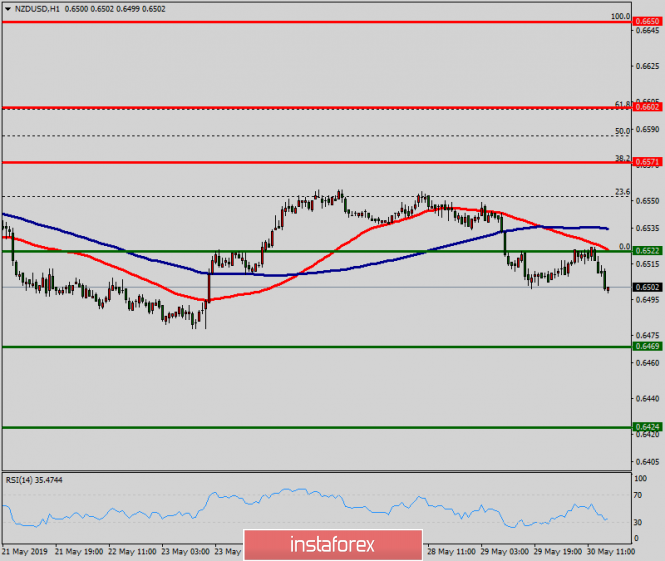
- Technical analysis of NZD/USD for May 30, 2019
- Technical analysis of USD/CAD for May 30, 2019
- Rise after recession: oil quotes begin to rise
- GBP/USD: plan for the US session on May 30. The pound remains in a narrow channel and is waiting for political news
- EUR/USD: plan for the US session on May 30. Buyers of the euro must return to the level of 1.1143
- Bitcoin to hit $10,000 soon. May 30, 2019
- Investors are waiting for US GDP data: We assume that the movement is possible to continue in the range of the EUR/USD pair
| Posted: 30 May 2019 07:47 PM PDT Minuette ( h1 ) Great Britain pound vs US dollar ____________________ The development of the movement of the GBP / USD currency pair from May 31, 2019 will be determined by the direction of the range breakdown: -> resistance level 1.2635 (initial SSL line of the Micro operational scale forks ); -> support level 1.2615 (starting line SSL is for Minuette operating scale forks ). ____________________ The development perspective of the upward movement (buy) The breakdown of resistance level of 1.2635 ( SSL Micro initial line ) -> a variant of the development of GBP / USD movement to the borders of the 1/2 Median Line channel ( 1.2665 <-> 1.2682 <-> 1.2700 ) and the equilibrium zone ( 1.2710 <-> 1.2737 <-> 1.2762 ) Micro operational scale forks. Details are shown on the chart . ____________________ Downward Move Development Perspective (sell) The breakdown of support level of 1.2615 ( SSL Minuette start line ) is followed by updating the local minimum of 1.2604, it will determine the possibility for a continuation of the downward movement of GBP / USD to the aims -> Control line LTL ( 1.2530 ) Fork operational scale Minuette <-> warning line UTL38.2 Minuette ( 1.2500 ). Details are shown on the chart . ____________________ The review was compiled without regard to the news background. The opening of trading sessions of the main financial centers does not serve as a guide to action (placing orders "sell" or "buy"). |
| Posted: 30 May 2019 07:47 PM PDT Minuette ( h1 ) Euro vs US Dollar ____________________ Range of Breakdown Direction : -> resistance level 1.1145 (starting line SSL for the Micro operational scale forks); -> support level of 1.1130 (starting line SSL is for Minuette operation scale forks); and will determine the development of the movement of the single European currency EUR / USD from May 31, 2019 ____________________ The development perspective of the upward movement (buy) A The breakdown of the resistance level of 1.1145 (the initial SSL Micro line ) -> EUR / USD movement will be directed to the borders of 1/2 channels. Median Line will take an operating scale -> Minuette ( 1.1150 <-> 1.1167 <-> 1.1185 ) and Micro ( 1.1167 <-> 1.1180 <-> 1.1192 ), with the prospect of reaching the limits of the equilibrium zones of the same operational scale forks -> Micro ( 1.1210 <-> 1.1230 <-> 1.1250 ) and Minuette ( 1.1210 <-> 1.1235 <-> 1.1257 ). Details are shown on the chart . ____________________ Development perspective of the downward movement (sell) The breakdown of the support level of 1.1130 ( SSL Minuette start line) with the subsequent updating of the local minimum 1.1124 will make it relevant to continue the development of the downward movement of the single European currency to the targets -> minimum 1.1107 <-> control line LTL ( 1.1095) Minuette operational scale forks <-> warning line UWL61.8 Minuette (1.1075 ). Details are shown on the chart . ____________________ The review was compiled without regard to the news background. The opening of trading sessions of the main financial centers does not serve as a guide to action (placing orders "sell" or "buy"). |
| GBP/JPY approaching support, big potential bounce coming! Posted: 30 May 2019 07:20 PM PDT
Price is approaching our first support level. Entry : 137.65 Why it's good : Horizontal swing low support, 61.8% Fibonacci retracement, 61.8% Fibonacci extension Stop Loss : 136.29 Why it's good : 100% Fibonacci extension Take Profit : 139.61 Why it's good : 50% Fibonacci retracement, horizontal overlap resistance, 100% Fibonacci extension
|
| GBP/JPY approaching support, big potential bounce coming! Posted: 30 May 2019 07:20 PM PDT Price is approaching our first support level. Entry : 137.65 Why it's good : Horizontal swing low support, 61.8% Fibonacci retracement, 61.8% Fibonacci extension Stop Loss : 136.29 Why it's good : 100% Fibonacci extension Take Profit : 139.61 Why it's good : 50% Fibonacci retracement, horizontal overlap resistance, 100% Fibonacci extension
|
| AUD/USD testing support, potential breakout! Posted: 30 May 2019 07:17 PM PDT
Price is testing its 1st support where we have a slight bias that it still has more downside potential. If it breaks past its 1st support, we expect a further move down to its 2nd support. Entry : 0.6900 Why it's good : 50% Fibonacci retracement, 100% Fibonacci extension, horizontal swing low support Stop Loss : 0.6932 Why it's good : horizontal swing high resistance Take Profit : 0.6871 Why it's good : Horizontal swing low support, 100% Fibonacci extension
|
| Fractal analysis of major currency pairs on May 31 Posted: 30 May 2019 07:16 PM PDT Forecast for May 31: Analytical review of H1-scale currency pairs: For the euro / dollar pair, the key levels on the H1 scale are: 1.1171, 1.1157, 1.1146, 1.1123, 1.1115, 1.1099, 1.1080 and 1.1067. Here, we continue to follow the development of the downward structure of May 27. Continuation of the movement to the bottom is expected after the price passes the noise range 1.1123 - 1.1115. In this case, the target is 1.1099. Price consolidation is near this level. The breakdown of the level of 1.1099 will lead to movement to the level of 1.1080. For the potential value for the bottom, we consider the level of 1.1067, upon reaching which, we expect consolidation in the corridor of 1.1080 - 1.1067. Short-term upward movement is possible in the range 1.1146 - 1.1157. The breakdown of the last value will lead to a prolonged correction. Here, the target is 1.1171. This level is a key support for the bottom. The main trend is the downward structure of May 27. Trading recommendations: Buy 1.1146 Take profit: 1.1156 Buy 1.1158 Take profit: 1.1170 Sell: 1.1115 Take profit: 1.1100 Sell: 1.1097 Take profit: 1.1083 For the pound / dollar pair, the key levels on the H1 scale are: 1.2715, 1.2667, 1.2637, 1.2553, 1.2478 and 1.2428. Here, the continuation of the movement to the bottom is expected after the breakdown at 1.2553. In this case, the goal is 1.2478. We consider the level of 1.2428 to be a potential value for the bottom. Upon reaching this level, we expect consolidation in the corridor 1.2478 - 1.2428, as well as a departure to a correction. Short-term uptrend is possible in the corridor 1.2637 - 1.2667. The breakdown of the latter value will lead to a prolonged correction. Here, the goal is 1.2715. This level is a key support for the downward structure. Its price passage will have to form the initial conditions for the upward cycle. The main trend is the downward structure of May 21. Trading recommendations: Buy: 1.2637 Take profit: 1.2666 Buy: 1.2668 Take profit: 1.2715 Sell: 1.2550 Take profit: 1.2480 Sell: 1.2476 Take profit: 1.2428 For the dollar / franc pair, the key levels on the H1 scale are: 1.0137, 1.0118, 1.0094, 1.0082, 1.0057, 1.0048 and 1.0034. Here, we continue to follow the development of the ascending structure of May 24. Short-term upward movement is expected in the corridor 1.0082 - 1.0094. The breakdown of the last value should be accompanied by a pronounced upward movement. In this case, the target is 1.0118. For the potential value to the top, we consider the level of 1.0137. The movement to which is expected after the breakdown of 1.0120. Short-term downward movement is possible in the corridor 1.0057 - 1.0048. The breakdown of the last value will lead to a prolonged correction. Here, the goal is 1.0034. This level is a key support for the upward structure. The main trend is the ascending structure of May 24. Trading recommendations: Buy : 1.0082 Take profit: 1.0094 Buy : 1.0096 Take profit: 1.0118 Sell: 1.0057 Take profit: 1.0048 Sell: 1.0046 Take profit: 1.0036 For the dollar / yen pair, the key levels on the scale are : 110.21, 109.94, 109.73, 109.14, 108.98, 108.51 and 108.18. Here, the price forms the medium-term initial conditions for the downward cycle of May 21. Continuation of the movement to the bottom is expected after the price passes the noise range 109.14 - 108.98. In this case, the goal is 108.51. We expect consolidation near this level. For the potential value to the top, we consider the level of 108.18, after reaching which, we expect a possible rollback to the correction. Short-term upward movement is possible in the corridor 109.73 - 109.94. The breakdown of the latter value will lead to in-depth correction. Here, the goal is 110.21. This level is a key support for the downward cycle. The main trend: the formation of medium-term initial conditions for the downward cycle of May 21. Trading recommendations: Buy: 109.73 Take profit: 109.92 Buy: 109.95 Take profit: 110.20 Sell: 108.98 Take profit: 108.55 Sell: 108.48 Take profit: 108.20 For the Canadian dollar / US dollar pair, the key levels on the H1 scale are: 1.3651, 1.3611, 1.3556, 1.3491, 1.3464 and 1.3428. Here, we continue to follow the development of the ascending structure of May 22. Short-term upward movement is expected in the corridor 1.3534 - 1.3556. The breakdown of the last value should be accompanied by a pronounced upward movement. In this case, the target is 1.3611. For the potential value to the top, we consider the level of 1.3651, after reaching which, we expect to go into correction. Short-term downward movement is possible in the corridor 1.3491 - 1.3464. Breaking the last value will lead to a prolonged correction. Here, the goal is 1.3428. This level is a key support to the top. The main trend is the upward cycle of May 22. Trading recommendations: Buy: 1.3534 Take profit: 1.3555 Buy : 1.3558 Take profit: 1.3610 Sell: 1.3490 Take profit: 1.3466 Sell: 1.3462 Take profit: 1.3433 For the Australian dollar / US dollar pair, the key levels on the H1 scale are : 0.7013, 0.6994, 0.6965, 0.6955, 0.6941, 0.6910, 0.6897, 0.6882 and 0.6863. Here, the price forms the expressed initial conditions for the top of May 23. Continuation of the movement to the top is expected after the breakdown 0.6941. Here, the first goal is 0.6955. Price consolidation is found near this level. The price passage of the noise range of 0.6955 - 0.6965 should be accompanied by a pronounced upward movement. In this case, the target is 0.6994. For the potential value to the top, we consider the level of 0.7013, after reaching which, we expect a rollback to the bottom. Short-term downward movement is possible in the range of 0.6910 - 0.6897. The breakdown of the latter value will lead to a prolonged movement. Here, the target is 0.6882. This level is a key support for the upward structure. The main trend is the formation of initial conditions for the top of May 23. Trading recommendations: Buy: 0.6941 Take profit: 0.6955 Buy: 0.6967 Take profit: 0.6992 Sell : 0.6910 Take profit : 0.6898 Sell: 0.6895 Take profit: 0.6884 For the euro / yen pair, the key levels on the H1 scale are: 122.72, 122.42, 122.23, 121.76, 121.54, 120.96 and 120.59. Here, we are following the development of the mid-term downward structure of May 21. Short-term downward movement is expected in the range of 121.76 - 121.54. The breakdown of the last value should be accompanied by a pronounced downward movement. Here, the goal is 120.96. For the potential value at the bottom, we consider the level of 120.59, after reaching which, we expect consolidation, as well as a rollback to the correction. Short-term uptrend is possible in the corridor 122.23 - 122.42. The breakdown of the latter value will lead to a prolonged correction. Here, the goal is 122.72. This level is a key support for the downward structure. Before it, we expect clearance of the expressed initial conditions to the top. The main trend is a mid-term downward structure of May 21. Trading recommendations: Buy: 122.23 Take profit: 122.40 Buy: 122.44 Take profit: 122.70 Sell: 121.76 Take profit: 121.56 Sell: 121.50 Take profit: 121.00 For the pound / yen pair, the key levels on the H1 scale are : 139.14, 138.76, 138.24, 137.49, 136.85 and 136.00. Here, we are following the development of the downward structure of May 21. Continuation of the movement to the bottom is expected after the breakdown of the level 137.49. In this case, the target is 136..85, near which the price consolidation is possible. Breakdown at level 136.85 will allow to count on the movement to the potential value - 136.00, after reaching which, we expect a rollback to the top. Care in the correction is possible after the breakdown of 138.24. In this case, the first target is 138.76. In the corridor 138.76 - 139.14, we expect a short-term upward movement. The level 139.14 is a key support at the bottom. Its price passage will have to form the initial conditions for the upward cycle. The main trend is a local downward structure of May 21. Trading recommendations: Buy: 138.25 Take profit: 138.74 Buy: 138.76 Take profit: 139.14 Sell: 137.46 Take profit: 136.90 Sell: 136.80 Take profit: 136.10 The material has been provided by InstaForex Company - www.instaforex.com |
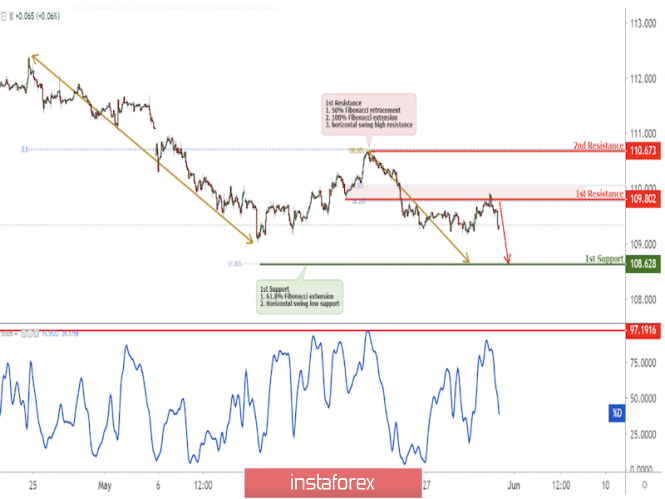
| USD/JPY reversed off key resistance, a drop is possible! Posted: 30 May 2019 07:12 PM PDT
USDJPY reversed off key resistance, a drop to first support is possible Entry: 109.802 Why it's good : 61.8% Fibonacci extension, 38.2% Fibonacci retracement, horizontal overlap resistance Stop Loss : 110.67 Why it's good :100% Fibonacci extension,50% Fibonacci retracement, horizontal swing high resistance Take Profit : 108.63 Why it's good: 61.8% Fibonacci extension, horizontal swing low support
|
| EUR / USD. Southern Trend Coalition: China, Brexit and Italy Posted: 30 May 2019 05:10 PM PDT Anti-risk sentiment is growing in the foreign exchange market, reflecting the increasing geopolitical tensions in the world. China and the United States entered the trade clinch. The likelihood of a "tough" Brexit is also growing every day, and this week, there is information about the upcoming sanctions against Britain, Germany and France from the United States for the possible use of the INSTEX financial mechanism. Against the background of such a gloomy fundamental picture, the American currency feels more than confident: the dollar index has updated the local maximum yesterday, at the level of 98.16. But on the contrary, the single currency loses its points, being under additional pressure of the political conflict between Rome and Brussels. Nevertheless, EUR/USD bears cannot take full advantage of the strong greenback. Sellers are strenuously pulling the pair to the base of the 11th figure, to an annual minimum of 1,1105, which is a "concurrent" level of support. But as soon as the price approaches the area of key targets, the southern impulse fades away, and buyers in turn seized the initiative. The same thing happened yesterday: the US base PCE, for the first quarter of this year, was revised downward, as well as the GDP indicator. This fact has cooled the fervor of the sellers, and the pair slowed down its fall. Of course, a trend reversal is out of the question: the maximum that the EUR/USD bulls are capable of right now is a modest correction within 40-60 points. In a more global aspect, buyers of the pair need to stay above the 10th figure in order to avoid falling into price levels for 2015-2016 (that is, in the range of 1.04-1.08). All the other desires of the bulls of the pair are now impossible to fulfill: a trend reversal is possible only if China and the US sit down again at the negotiating table, and the risk of a tough Brexit will be leveled at least by another delay. But so far, the situation has only worsened - both in the sphere of US-China relations, and in the sphere of the prospects for the "divorce process of Britain with the EU. Thus, it became known that China has suspended purchases of soybeans in the United States, thereby confirming the next round of escalation of the trade conflict between the countries. In a sense, this is a momentous event, given the "background" of this issue. Indeed, at the beginning of the year, the Chinese agreed to increase the volume of purchases of American agricultural products (soybeans, corn and wheat) only as a compromise. Beijing promised to purchase products of this category for a total amount of up to $ 30 billion: as a result, these volumes should have exceeded the "pre-war" figures. It was a good sign for those who expected to conclude a trade deal between the superpowers. This sign has acquired a negative value: the Chinese have once again confirmed their readiness to further escalate the conflict. And here, it is worth recalling that according to rumors circulated, China is preparing to deliver a more significant blow to the United States by restricting or banning the export of rare earth metals. The largest consumers of rare-earth metals include American industrial companies that develop not only innovative technologies, but also military equipment. In turn, China accounts for about 80% of the global supply of rare earth metals. Does Beijing use such a powerful Trump card in a protracted trade conflict? The experts do not have a common opinion on this issue, however, the PRC leader has already hinted rather clearly at such an opportunity, suddenly visiting one of the enterprises for processing RMP on a working visit. In addition to the global trade war, the pair EUR/USD are under pressure from more "local" problems. It's about Brexit and the political conflict between Rome and Brussels. During the other day, the market was optimistic about the idea of the Irish Prime Minister that the date of Brexit could be rescheduled. According to him, if on the other side of the scale there is a "hard" Brexit, then it is advisable for the European Union to postpone the British release date from the Alliance from October 31 to a later date. Such an idea was liked by traders, because at this rate, the parties can reach even the next general parliamentary elections in Britain, which Laborists can win. But yesterday, there was information that Germany will not agree to such a scenario. To be more precise, the Germans put forward the condition of London: either the British announce the holding of a second referendum, or hold general special elections this fall - in October or November. Only in this case will Germany agree to another postponement of Brexit. Obviously, if Boris Johnson (who is still leading in the political race) becomes the next prime minister, he will not agree to this scenario. Consequently, the "hard" Brexit again loomed on the horizon with all the ensuing consequences. Thus, the fundamental background is still conducive to testing the price minima of this year - bears are quite able to touch the mark of 1.1105. But to enter the 10th figure (and even more so to consolidate in this area), sellers need a strong informational occasion. Therefore, short positions in a pair at the base of the 11th figure look extremely risky, given the high probability of corrective pullback. The material has been provided by InstaForex Company - www.instaforex.com |
| Game of thrones in the EU: Germany's loss will win the Euro Posted: 30 May 2019 05:10 PM PDT The results of the elections to the European Parliament were quite unexpected, at least in several aspects. First, the popularity of right-wing political forces in the EU countries has been greatly exaggerated - populists still remain on the margins of the political life of Europe. But the "traditional" European parties also lost their points: for the first time in the entire history of the European Parliament, the European Popular Party and the Social Democrats no longer have an absolute majority. In this convocation of parliament, they cannot create a coalition and, consequently, determine personnel policy in the power structure of the bodies of the European Union. In an unexpected way, this fact can have a positive effect on the positions of the single currency, which has recently been going through hard times. Long before the parliamentary elections, the press "walked" that Berlin would lobby for the post of the head of the European Commission representative of its state, namely the candidate of the European People's Party, Manfred Weber. For the sake of this post, Angela Merkel was ready to "exchange" the position of head of the ECB. Although for several years, the market was confident that the Germans would lobby for the position of head of the European Central Bank Jens Weidmann, who now heads the Bundesbank and is on the Board of Governors of the European Central Bank. This has been discussed for a long time - both among bank analysts and among economic observers. All these rumors were based on the fact that the Germans, in principle, are unhappy with the policies implemented by Mario Draghi. By the way, now this is hardly remembered, but seven years ago, when the eurozone was experiencing the most acute phase of the crisis, some German politicians called Draghi a "European counterfeiter". In their opinion, the head of the ECB then illegally "turned on the printing press", since the redemption of bonds violated a law prohibiting the European regulator to directly finance governments. Of course, most economists in Germany and representatives of business groups were not so radical in their statements - but many of them publicly criticized and still criticize the current head of the ECB for their soft policy. Jens Weidmann himself also repeatedly spoke of the need for a gradual tightening of monetary policy. Even in the present conditions, when the main economic indicators of the eurozone have slowed down, it maintains a fairly "hawkish" position. Just two weeks ago, he stated that there was no need to postpone the normalization of the policy, "if forecasts allow it to be done". In addition, Weidmann has always been an open opponent of the mechanism of redemption of bonds and other incentives from the ECB. Of course, if Italy brings the situation to a debt crisis, the regulator will have to return to unconventional measures, but for Weidmann, it will be a difficult decision because of his position. He often repeats the phrase that markets should not underestimate the risks of a very soft monetary policy. By the way, In early April, Mario Draghi himself emphasized the presence of side effects of the low stakes. Following this statement, an open appeal appeared from German bankers who called on the European Central Bank to introduce a differential rate on deposits - but the ECB subsequently rejected this idea. If Weidmann will stand at the helm of the Central Bank, these intentions may regain their relevance, while the likelihood of monetary policy easing will decrease significantly (I believe that he will resort to such measures only as a last resort). Thus, the very fact of the appointment of Jens Weidmann as head of the ECB will provide background support for the European currency. Considering how the political struggle unfolds for key positions in the EU structure, it can be assumed that the chances of the Germans have increased in many ways. As mentioned above, the German Chancellor was ready to "exchange" the position of the head of the ECB for the position of head of the European Commission, which is now headed by the representative of Luxembourg, Jean-Claude Juncker. But the results of the elections to the European Parliament do not allow the Germans to apply for this post: the center-right of the EPP and the center-left of the group of socialists and democrats do not have 50 votes for the majority to determine who should lead the European Commission (in this case the German Manfred Weber). But the liberals (ALDE) achieved good results in the elections, significantly strengthening their positions and becoming, in fact, the owners of the "Golden share" (with them, the ENB and the socialists can form a majority). That is why Weber's chances of leading the EC are now quite low - EU leaders have been actively negotiating other candidates in recent days. According to experts, this could be the representative of Denmark Margrethe Vestager (the most likely candidate) or the current first deputy of Jean-Claude Juncker, the Dutchman Frans Timmermans. In turn, the post of head of the ECB can become a "consolation prize" for Germany, which nevertheless, retains its influence on the political Olympus of the EU. If further events will unfold under this scenario, the euro will receive some support. The material has been provided by InstaForex Company - www.instaforex.com |
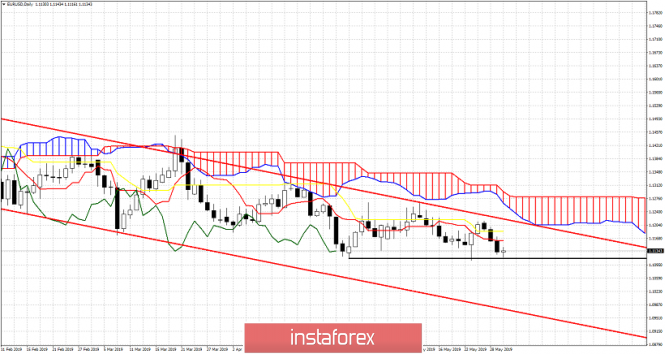
| Technical analysis for EURUSD for May 30, 2019 Posted: 30 May 2019 01:17 PM PDT EURUSD has broken below 1.1150 and is challenging the 2019 lows at 1.11 area. Trend remains bearish in short- and medium-term. Price is heading towards 1.10 as long as price remains below 1.12.
Black line - horizontal support EURUSD remains in a bearish trend. Price is still trading inside the bearish red channel and below the Ichimoku cloud. For this medium-term trend to change to bullish we will need to see price break above 1.1230-1.1260 first and then above 1.13. Short-term resistance is found at 1.1185. Support is found at 1.11-1.1120. Breaking below it will open the way for a move towards 1.10 and lower. So far we have been saying that every bounce is a selling opportunity and this has proven correct as price has not broken any important resistance level yet. The material has been provided by InstaForex Company - www.instaforex.com |
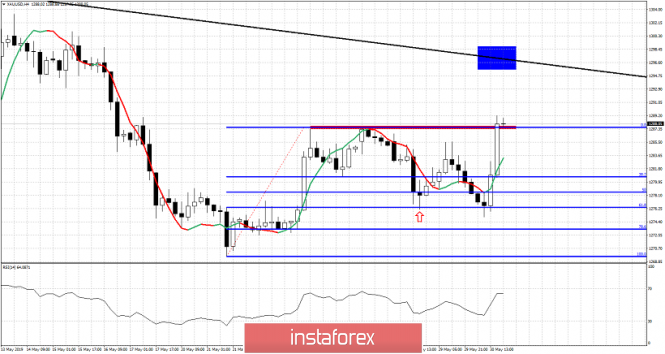
| Technical analysis for Gold for May 30, 2019 Posted: 30 May 2019 01:07 PM PDT Gold price has broken above the short-term resistance level of $1,288 and bulls should now expect at least a move towards the major resistance area of $1,294-$1,300. Breaking above this major resistance will have implications for the medium-term trend which remains bearish after topping back in February.
Blue rectangle -short-term target Black line - major resistance trend line Gold price has support at today's lows at $1,275. Short-term resistance and previous highs at $1,288 are broken and we now expect price to move higher towards the blue rectangle and the major downward sloping trend line resistance at $1,294-$1,300 area. Bears remain in control of the medium-term trend and as long as price is below $1,300 bulls need to be very cautious. The material has been provided by InstaForex Company - www.instaforex.com |
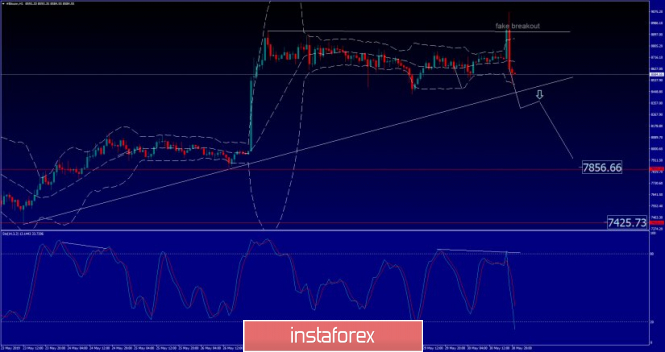
| Bitcoin analysis for May, 30.2019 Posted: 30 May 2019 11:25 AM PDT Bitcoin did nice flash up and reject from strong resistance of $8.910. The rejection of the round number $9.00 is a good sign that aggressive sellers entered the market.
White horizontal line – Major resistance Red horizontal line 1- Support 1 Red horizontal line 2 – Support 2 BTC did successful test and reject of the key resistance and round number at $9.000, which is strong sign of the weakness. We found that key rising trendline-support to be very important for further downside. You can watch for potential breakout of the trendline to confirm further downside. Downward references are set at $7.856 and $7.425. Key resistance remains at $9.000. The material has been provided by InstaForex Company - www.instaforex.com |
| May 30, 2019 : EUR/USD Intraday technical analysis and trade recommendations. Posted: 30 May 2019 10:36 AM PDT
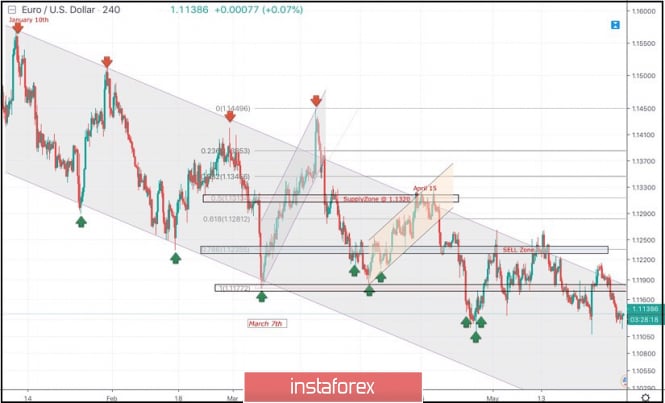
Since January 10, the EURUSD pair has been moving within the depicted channel with slight bearish tendency. Few weeks ago, a bullish Head and Shoulders reversal pattern was demonstrated around 1.1200. This enhanced further bullish advancement towards 1.1300-1.1315 (supply zone) where significant bearish rejection was demonstrated on April 15. For Intraday traders, the price zone around 1.1235 (78.6% Fibonacci) stood as a temporary demand area which paused the ongoing bearish momentum for a while before bearish breakdown could be executed on April 23. Short-term outlook turned to become bearish towards 1.1175 (a previous weekly bottom which has been holding prices above for a while) On May 17-20, a bearish breakdown below 1.1175 was temporarily achieved. As expected, further bearish decline was expected towards 1.1115. This is where significant bullish recovery was demonstrated by the end of last Thursday's consolidations bringing the EURUSD pair back above 1.1175. Recently, The EURUSD pair was trapped between the depicted price zones (1.1150-1.1235) until Tuesday when another bearish breakdown was demonstrated below 1.1150. This should enhance the bearish side of the market towards 1.1115. However, conservative traders should stay out of the market until long-term outlook is determined. Trade recommendations : Intraday traders should look for another bullish breakout above 1.1175 as a valid BUY signal. T/P level to be located around 1.1240. Stop loss should be placed below 1.1150. The material has been provided by InstaForex Company - www.instaforex.com |
| May 30, 2019 : GBP/USD Intraday technical analysis and trade recommendations. Posted: 30 May 2019 09:11 AM PDT
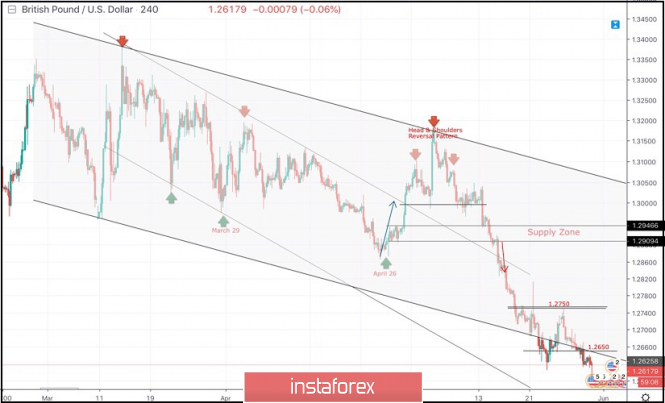
On March 29, a visit towards the price levels of 1.2980 (the lower limit of the newly-established bearish movement channel) could bring the GBPUSD pair again towards the upper limit of the minor bearish channel around (1.3160-1.3180). Since then, Short-term outlook has turned into bearish with intermediate-term bearish targets projected towards 1.2900 and 1.2850. On April 26, another bullish pullback was initiated towards 1.3000 (the same bottom of March 29) which has been breached to the upside until May 13 when a bearish Head and Shoulders pattern was demonstrated on the H4 chart with neckline located around 1.2980-1.3020. Bearish persistence below 1.2980 enhanced further bearish decline. Initial bearish Targets were already reached around 1.2900-1.2870 (the backside of the broken channel) which failed to provide any bullish support for the pair. Further bearish decline was demonstrated towards the lower limit of the long-term channel around (1.2700-1.2650). The GBPUSD pair looks oversold around the current price levels (1.2650-1.2600). That's why, SELL signals shouldn't be considered at such low prices. On the other hand, bullish persistence above 1.2650 and 1.2750 should be achieved to enhance the bullish side of the market initially towards 1.2870 (Bottom of April 26). Trade Recommendations: Conservative traders should wait for another bullish pullback towards 1.2870-1.2905 (newly-established supply zone) to look for valid sell entries. S/L should be placed above 1.2950. Counter-trend traders can consider any bullish breakout above 1.2650 as a valid signal to look for BUY entries. T/P level to be located around 1.2750 and 1.2820. S/L to be located below 1.2620. The material has been provided by InstaForex Company - www.instaforex.com |
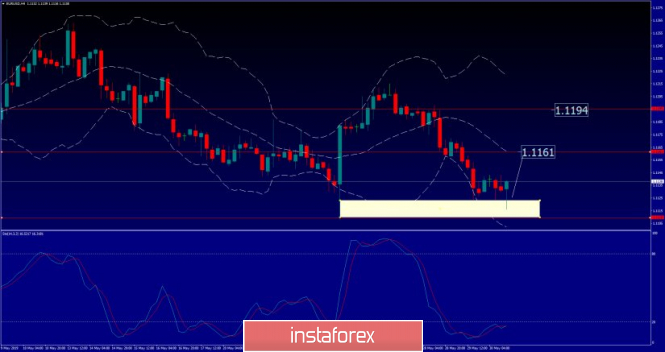
| EUR/USD analysis for May 05/30.219 Posted: 30 May 2019 08:51 AM PDT EUR/USD price has been trading downwards. The price did test and reject from the yesterday's low at 1.1124. EUR is trading near the important support at 1.1108 and you should watch for buying opportunities.
White rectangle – Support Red horizontal line 1- Resistance 1 Red horizontal line 2 – Resistance 2 EUR/USD did successful test and reject of the support at 1.1115, which is strong sign of the strength. We found also the bullish divergence on the Stochastic oscillator, which is another sign of the strength. We expect potential test of the middle bolinger line at 1.1161 and even test of 1.1194 in the next period. As long as the EUR is trading abot the support at 1.1110, we are watching for buying opportunities. The material has been provided by InstaForex Company - www.instaforex.com |
| The Fed is holding on with its last strength not to lower rates Posted: 30 May 2019 08:01 AM PDT The United States and China continue to exchange "courtesies." On Thursday, Beijing once again added fuel to the fire, comparing Washington's position with "economic terrorism." Meanwhile, the date of the next Fed meeting is approaching, and the regulator is in an extremely difficult situation due to the escalation of the trade war, which runs the risk of becoming a full-scale one. The Fed views trade dispute as one of the serious risks to the growth of the US economy. It is becoming increasingly difficult for financial officials to maintain a neutral stance with regard to monetary policy. Judging by the futures on the Fed rate, the markets are now estimating the probability of lower interest rates by 25 bp by September, more than 50%. If the risks are justified and GDP growth begins to slow, the Fed will have to act more rapidly than in past economic downturns. The fact is that short-term rates are in the historically low range of 2.25% – 2.50%. Before starting to soften the policy, the Central Bank will want to make sure that the rate of growth slowdown exceeds expectations. Evidence of a more serious decline could be reports on the trust of companies and consumers, as well as indicators of costs and hiring. It is not excluded that the Fed will start to act ahead of schedule, since the trade war may flare up sharply, and the DKP will be set up incorrectly. Officials are closely following the development of trade negotiations between the United States and China, but they do not give an indication, as well as signals about a likely change in policy. It is worth noting that too frequent changes in rates can lead to negative consequences in the form of increased volatility and uncertainty in the prospects for markets and the economy as a whole. At the same time, there are concerns that the wait-and-see attitude of the American Central Bank is risky. "The wait-and-see attitude and intention to see strong evidence of weakening activity means that the fed will begin to mitigate too late, returning to the usual manner and forgetting the lessons learned in January, and will create all conditions for another rate cut," experts write. The Fed meeting was completed on a positive note. Jerome Powell dispelled market expectations about lowering rates this year, stressing that the recent easing of inflation is a temporary factor. However, since that time, there have been some changes. Donald Trump raised import duties on Chinese goods worth $200 billion from 10% to 25%, further heightening the situation. Beijing did not keep it waiting long and delivered retaliatory measures. At the moment, the rise in global GDP is of concern, while the US economy is balancing between sharply deteriorated indicators and those that are between growth and decline. Trade and production data indicate a more serious decline in company sentiment and a reduction in capital investment than previously expected. The preliminary index of US industrial production, according to IHS Markit, fell to 50.6 in May from 52.6 in April, reaching the lowest level since September 2009. The index of activity in the services sector fell to a three-year low of 50.9, previously it was at around 53. What will happen to the dollar? The dollar against the basket of the main competitors is held near 2-year highs. It is helped by the status of the world reserve currency, which tends to attract attention during periods of market turmoil and political tension. The dollar continues to strengthen, including due to the weakness of the euro, suffering from a new political clash between Italy and the EU and the pound, falling on news regarding Brexit. On Thursday, the US currency did not seem to notice the revised down GDP for the first quarter and the PCE index, which is closely monitored by the fed in assessing inflation risks. In the period from January to March, the American economy expanded by 3.1% in terms of annual rates, while previously it was about 3.2%. The PCE climbed 1% – the lowest rate since the fourth quarter of 2015, following a 1.8% increase in the previous quarter. The first estimate indicated an increase of 1.3%. Experts from Julius Baer believe that the upward trend of the dollar ends. This is due to changes in the US economy in terms of GDP dynamics. America is beginning to lose its advantage over other countries and the growth of the global economy as a whole. JPMorgan also spoke negatively against the dollar. The bank believes that the Fed will have to soften monetary policy. The escalation of the trade conflict between Beijing and Washington has a negative effect on the economic prospects of the States. It is expected that in the second quarter growth will be only 1%. The material has been provided by InstaForex Company - www.instaforex.com |
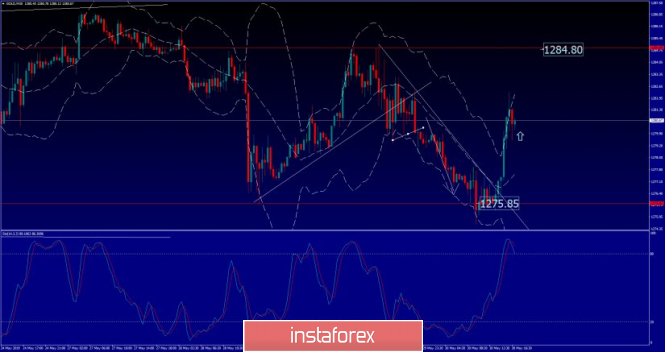
| Analysis of Gold for May, 30.2019 Posted: 30 May 2019 07:30 AM PDT Gold price has been trading downwards. The price did hit our down target from yesterday at $1.275 and did flip up, which is sign of the reversal. Gold is very strong today and you should watch for buying on the dips.
Red horizontal line – Resistance 1 Red horizontal line 2- Resistance 2 White line – Broken resistance trendline Gold did strong test and reject from of the $1.275, which is strong sign of revesal. Bullish momentum is present and you should watch only for buying opportuntiies.As long as Gold is trading above the $1.275, we will be bullish. Resistance levels are seen at the price of $1.284 and $1.286. The material has been provided by InstaForex Company - www.instaforex.com |
| The appointment of Jens Weidmann as head of the ECB will cause a rally of euro Posted: 30 May 2019 07:25 AM PDT As soon as the elections to the European Parliament were over, the struggle for the highest posts of the European leadership began. It is assumed that the main opposition will unfold between Germany and France, which seek to occupy a leading position in the block. The fate of the euro will depend on who will head the ECB, the protege of Angela Merkel or Emmanuel Macron. One of the potential candidates for this position is Jens Weidmann, the President of the German Federal Bank, who is known for his "hawkish" views. Previously, he openly opposed the ECB's stimulating measures, purchases of sovereign bonds by the regulator and called for the normalization of monetary policy (an increase in interest rates). Such a candidate represents the most striking contrast with the policy of the current ECB President Mario Draghi. According to experts, the appointment of J. Weidmann to the position of President of the ECB will help strengthen the euro. Moreover, the very presence of a German at the helm of the European Central Bank can help prevent the main risk to the stability of the euro – the confrontation between Rome and Brussels over the budget deficit and the level of debt. On Tuesday, Deputy Prime Minister Matteo Salvini announced his intention to make the ECB a guarantor of public debt. Most likely, this initiative will break up about the team of Jens Weidmann and former Spanish Minister of Finance Luis de Guindos, who is now the vice-chairman of the ECB. In his previous position, he proved willingness to take unpopular austerity measures. Thus, if the post of head of the ECB will take J. Weidmann, then the mood of the "bulls" on the euro will seriously improve. However, it is unlikely that the regulator will sit idly until October of this year, when Mario Draghi resigns. In June, the Central Bank should announce the details of the long-term refinancing program (LTRO). If the loan rate is set at -2%, which is actually an effective subsidy of banks, interest in the program can be very high. At the same time, the ECB may raise the rate on deposits from the current -0.4% in order to attract investors. Such a policy seems to be more effective than quantitative easing (QE). Even a hint at an earlier time for increasing the deposit rate than the market expects will be a catalyst for the growth of the euro. In the meantime, the EUR/USD pair is forced to retreat to the south due to the resuscitation of political risks in the EU and disappointing statistics for the eurozone. For the third time in the last month, EUR/USD is testing support at 1.113. It is assumed that the success of the "bears" in this event will open the way for the pair to 1.1, and failure will allow it to develop consolidation in the range of 1.113-1.1265. The material has been provided by InstaForex Company - www.instaforex.com |
| Technical analysis of NZD/USD for May 30, 2019 Posted: 30 May 2019 07:12 AM PDT |
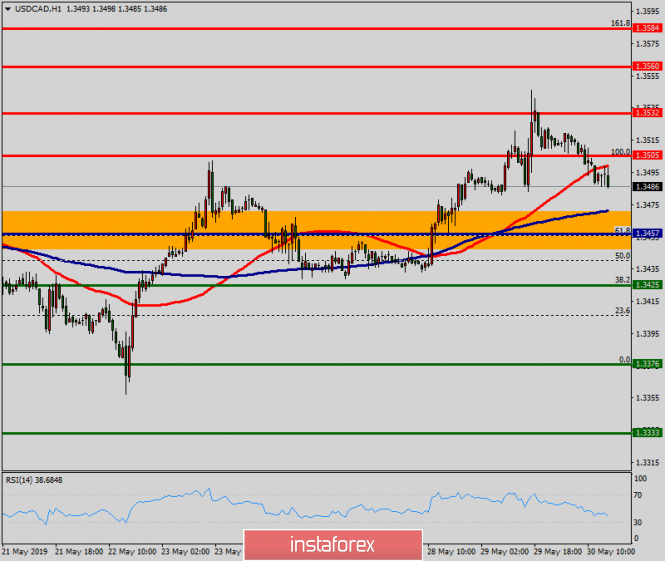
| Technical analysis of USD/CAD for May 30, 2019 Posted: 30 May 2019 06:57 AM PDT The pivot point: 1.3457. The USD/CAD pair continues to move upwards from the level of 1.3457. The pair rose from the level of 1.3457 (the level of 1.3457 coincides with a ratio of 61.8% Fibonacci retracement) to a top around 1.3505. But it rebounded from the top pf 1.3505 to 1.3477. Today, the first support level is seen at 1.3457 followed by 1.3425, while daily resistance 1 is seen at 1.3457. According to the previous events, the USD/CAD pair is still moving between the levels of 1.3505 and 1.3457; for that we expect a range of 48 pips (1.3505 - 1.3457). On the one-hour chart, immediate resistance is seen at 1.3505. Currently, the price is moving in a bullish channel. This is confirmed by the RSI indicator signaling that we are still in a bullish trending market. The price is still above the moving average (100), Therefore, if the trend is able to break out through the first resistance level of 1.3505, we should see the pair climbing towards the daily resistance at the levels of 1.3532 and 1.3560. It would also be wise to consider where to place stop loss; this should be set below the second support of 1.3425. The material has been provided by InstaForex Company - www.instaforex.com |
| Rise after recession: oil quotes begin to rise Posted: 30 May 2019 04:17 AM PDT On Thursday, May 30, oil quotes begin to recover after a significant decline the day before. The collapse in oil prices was triggered by information about a possible reduction in the supply of rare earth metals in the US from China. The escalation of the trade war between both countries continues to grow and this is a cause for alarm to market participants. The current situation has led to significant fluctuations of quotations on the black gold market. On Wednesday, Brent crude quotes dropped to $67.75 per barrel and climbed to $69.62 a barrel today. The cost of WTI light crude dropped on Wednesday to $59.07 per barrel. According to analysts, WTI prices have fallen below $57 per barrel for the first time since March of this year. The reason for this was the information about the potential reduction in the supply of rare-earth elements from China to the US military and energy industries. In the future, WTI quotes won back the lion's share of intraday losses and rose to $59.08 a barrel. At present, investors fear increased foreign trade tensions, which are putting pressure on the growth rate of the global economy and relative to the oil demand. According to the American Petroleum Institute (API), black gold reserves in the United States have decreased by 5.27 million barrels over the past week. Despite this, experts are counting on the upward trend in the oil market. The situation is exacerbated by current geopolitical instability. American authorities recently indicted Tehran, suspecting the Islamic Republic of participating in sabotage with oil tankers in the UAE. Iranian authorities have denied these allegations but tensions on the world stage continue. |
| Posted: 30 May 2019 04:11 AM PDT To open long positions on GBP/USD, you need: All attention is shifted to the election of the Prime Minister of Great Britain and to the candidates. In this regard, major players are not in a hurry to enter the market and change the situation. Buyers of the pound still need a return and consolidation above the resistance of 1.2950, which will allow us to count on rapid growth to a maximum of 1.2696 and an update of the resistance of 1.2744, where I recommend fixing the profits. With a further decrease in the pound, you can open long positions on a false breakdown from a minimum of 1.2607 or a rebound from the support of 1.2564. To open short positions on GBP/USD, you need: As long as the trade will be conducted below the resistance of 1.2650, the pressure on the pound will remain, and the formation of a false breakdown will be a signal to sell the pound. The main task of the bears will be the support test of 1.2607, which may lead to the resumption of the downward trend and update the minimum of 1.2564, where I recommend fixing the profits. If the growth scenario is above 1.2650, you can return to the sales of the pound immediately on the rebound from the maximum of 1.2696. Indicator signals: Moving Averages Trading is below 30 and 50 moving averages, which indicates a return of the pound sellers to the market. Bollinger Bands However, the main problem of a downward trend is low volatility, which does not give signals to enter the market. Description of indicators
|
| EUR/USD: plan for the US session on May 30. Buyers of the euro must return to the level of 1.1143 Posted: 30 May 2019 04:05 AM PDT To open long positions on EURUSD, you need: From a technical point of view, nothing has changed. Buyers still need to return to the resistance level of 1.1143, from which it will be possible to see an upward correction to the maximum area of 1.1170, where I recommend fixing the profits. In the afternoon, the focus will be shifted to statistics on the United States, namely, data on GDP. In case of good data, pressure on the euro may return. In this scenario, it is best to look for purchases after updating the minimum in the area of 1.1112, subject to the formation of a false breakdown, or to open long positions on the rebound from the new support of 1.1079. To open short positions on EURUSD, you need: A false breakdown and a return below the resistance level of 1.1143, which the bears will try to do after the US data, will be a signal to open short positions in the euro. The main task for the second half of the day will be a test of a large support level of 1.1112, which will increase the pressure on the pair and will lead to an update of the minimum in the area of 1.1079, where I recommend fixing the profits. Under the scenario of growth of the euro above 1.1143, it is best to return to short positions in EUR/USD after updating the high of 1.1170 or to rebound from a larger level of 1.1196. Indicator signals: Moving Averages Trading is below 30 and 50 moving averages, which indicates the bearish nature of the market. Bollinger Bands Volatility has dropped again sharply, which does not give signals to enter the market. Description of indicators
|
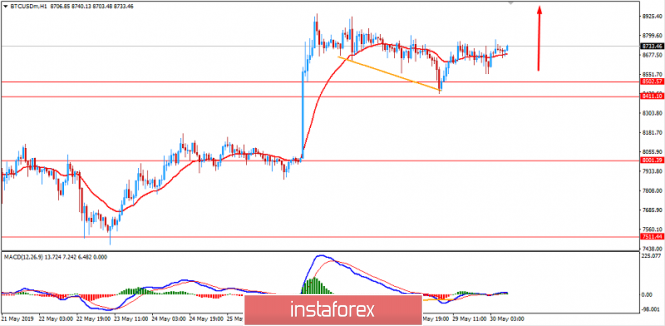
| Bitcoin to hit $10,000 soon. May 30, 2019 Posted: 30 May 2019 03:22 AM PDT The uptrend of Bitcoin continued after a retreat towards the $8,500 area with a daily close. At the moment, the price is pushing higher, however, being restrained by the dynamic support level of 20 EMA. Bitcoin is currently trading at $8,700, up significantly from the daily lows of just above $8,400 that were set last night. Analysts say that the range between $8,200 and $8,400 is a key support zone that BTC must not cross in order for its upward momentum to remain. After two months of a relieving rally, BTC prices are pulling back. It's nothing new. Extended gains, rallies and cool offs are typical in healthy markets, and Bitcoin is no exception. Besides, there is nothing to worry about considering significant developments and shifting sentiment in the last few years. Moreover, changing political stands could thrust Bitcoin into the scene. Gradually, BTC will be more than a medium of exchange but a settlement layer and a store of value. By the end of the year, BTC is anticipated to soar above $20,000, to prices unseen before. On the contrary, one strong indicator that altcoins are about to make a revival is the fall in Bitcoin market dominance. Today it has fallen back to 55.3 percent, its lowest level since the beginning of the month. BTC dominance is still up compared to earlier this year but the slow decline could be a sign of altcoin resurgence. As for the current scenario, BTC continues its uptrend aiming the $9,000 area again. A breakout above this level with a daily close is to lead the price higher towards the $10,000 psychological level. As the price remains above $8,000 with a daily close, the bullish bias is expected to remain. SUPPORT: 8,000/8,400/8,500 RESISTANCE: 9,000/9,250/9,500/10,000 BIAS: BULLISH MOMENTUM: VOLATILE
|
| Posted: 30 May 2019 03:21 AM PDT Investors are waiting for US GDP data. We assume that growth movement will be possible to continue in the range of the EUR/USD and AUD/USD pairs. Today, the market will focus on the publication of US GDP data for the first quarter. It is assumed that it will decline in growth to 3.1% from 3.2% in quarterly terms. This is a slight decrease, in which the market is still perceived as acceptable if the forecast is confirmed. However, if the values turn out to be lower, this should have a noticeable effect on the market. On the one hand, investors may conclude that the process of slowing the growth of the American economy may force the Fed to lower interest rates this year. This may be the reason for local growth in stock markets and the weakening of the US dollar. On the other hand, this may serve as the basis for the markets to fear that the escalation of the trade and political conflict between Washington and Beijing will strike America at an increase in import prices, which will spur inflation and the Fed will not take any action to raise rates again. In this case, the dollar will continue to receive significant support not only as a safe haven currency but also because of the rising expectations of a rate hike. In addition to GDP data this week, the base personal consumption index (RFE) values in the United States will also be important on Friday. On an annualized basis, it is expected to maintain a growth rate of 1.6%, but its April value will rise sharply by 0.2% immediately from the March zero mark. It is also expected that the income of Americans rose last month by 0.3% against a 0.1% increase in March, although expenses dropped to 0.2% from 0.9%. Assessing the possible reaction of the market, we believe that today's output of GDP in America as part of the forecast can support the demand for shares of American companies. The dynamics of the dollar is likely to be restrained but tomorrow it may receive more noticeable support on the positive data of the base index for personal consumption (RFE). Forecast of the day: The EUR/USD pair is under pressure with strengthening the US dollar position as a result on the one hand and expectations of a possible expansion of incentives from the ECB following its meeting in June on the other hand. Today, the pair can grow as well as fall on the wave of outgoing data from the United States. If they turn out to be strong, the pair may fall to 1.1100. However, if it is weaker than the forecast, then it will grow to 1.1215 after crossing the 1.1155 mark. The AUD/USD pair is below the strong resistance level of 0.6935, which if overcome will lead to local growth of the pair to 0.6965. |
| You are subscribed to email updates from Forex analysis review. To stop receiving these emails, you may unsubscribe now. | Email delivery powered by Google |
| Google, 1600 Amphitheatre Parkway, Mountain View, CA 94043, United States | |


No comments:
Post a Comment