
Forex analysis review |
- The pound may and would like to strengthen, but T. May and the opposition are in no hurry to agree
- The trade dispute between Washington and Beijing sets the tone in the foreign exchange market
- EUR/USD approaching resistance, potential reversal!
- USD/CAD approaching its key resistance where we could see a reversal occur!
- USD/JPY approaching key support, potential to bounce!
- Gold does not force events
- Disagreement between the US and China becomes more serious
- Hackers "took out" bitcoins worth $41 million from the crypto-exchange
- The production volume in Germany rose unexpectedly, but prospects for the euro have deteriorated
- NZD/USD 5 Star Signal | Fundamental + Technical Analysis
- Triangle pattern in EURUSD that remains in a bearish medium-term trend.
- Gold unable to break above resistance
- May 8, 2019 : EUR/USD Intraday technical analysis and trade recommendations.
- May 8, 2019 : GBP/USD Intraday technical analysis and trade recommendations.
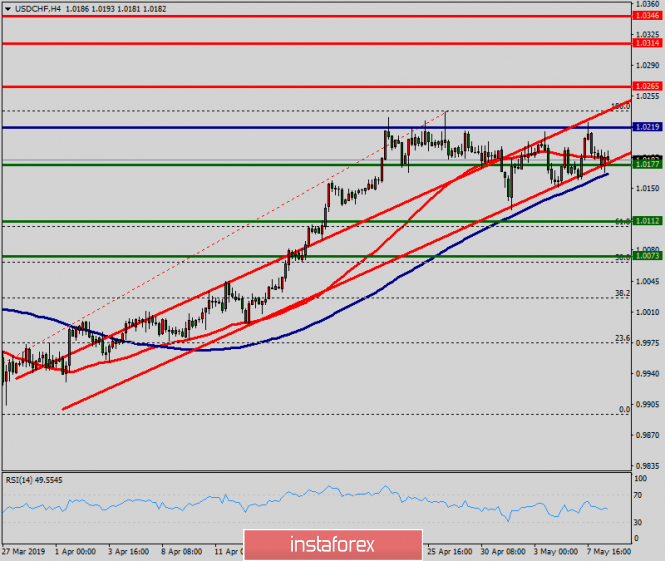
- Technical analysis of USD/CHF for May 08, 2019
- Technical analysis of EUR/USD for May 08, 2019
- The reaction of the New Zealander to the decision of the RBNZ: a good mine in a bad game
- EURUSD: Traders ignore the excellent report on industrial production in Germany. Iran may return to its nuclear program
- GBP/USD: a plan for the American session on May 8. The pound continues to decline, beating the entire Friday's growth last
- EUR/USD: plan for the American session on May 8. Calm continues
- Bitcoin analysis for May 08, 2019
- USD/JPY analysis for May 08, 2019
- Analysis of Gold for May 08, 2019
- GBP/USD. May 8th. Results of the day. Laborites and Conservatives can't agree yet
- EUR/USD. May 8th. Results of the day. The market is calm despite fears of a trade war between the US and the EU
| The pound may and would like to strengthen, but T. May and the opposition are in no hurry to agree Posted: 08 May 2019 07:19 PM PDT For the third consecutive day, the GBP / USD pair retreats from the monthly highs noted last Friday. Traders play the information that the United Kingdom will take part in the elections to the European Parliament, which will take place in two weeks. This was announced yesterday by the head of the secretariat of the British Cabinet of Ministers, David Lidington. "As the government does not have time to achieve the passage through the parliament of a deal on the withdrawal of Great Britain from the EU before May 23, the country will be forced to take part in elections to the European parliament," the spokesman said. Later this information was confirmed by the spokesman for Prime Minister Theresa May. He said that the head of government deeply regrets that Foggy Albion will have to take part in European elections. At the same time, T. May hopes that the ratification of the "divorce" agreement will take place until the deputies take up their duties in the European Parliament. Apparently, the latest comments of the British Cabinet mean that the government and the opposition have not yet been able to reach a compromise solution under the terms of Brexit. According to MUFG experts, the likelihood that negotiations between the ruling conservative party and the Labor Party will succeed is only one chance out of three, but if a positive result is achieved, the pound sterling will receive an impetus for growth. "The pound can strengthen by 2-4%, if a compromise deal is reached, which then goes to the parliament for a vote," the experts said. The material has been provided by InstaForex Company - www.instaforex.com |
| The trade dispute between Washington and Beijing sets the tone in the foreign exchange market Posted: 08 May 2019 07:17 PM PDT The passion around the trade deal between the United States and China does not subside, which gives rise to sharp movements in the foreign exchange market. Investors are beginning to worry since Friday, and consequently, the introduction of new tariffs on Chinese goods from the US is getting closer. Although Beijing is committed to continue its negotiations with Washington, the closest possible time frame for the escalation of the trade war between the two largest economies in the world means that Donald Trump is more serious now than ever before. If the tariffs are really introduced, then losses in the foreign exchange market cannot be avoided. Many experts expected the US currency to weaken this year, pointing to a slowdown in economic growth in the US and an improved economic performance in other countries. However, this has not happened so far. It should be acknowledged that, despite the Fed's confusion in the face of the changed economic realities, when low inflation seems to be the norm, and the Fed's old time-tested instrument does not work anymore, the greenback is holding up pretty well. The USD index is still trading above the important mark of 97. Thus, it is possible that with the slightest weakening of market factors that are now putting pressure on the US currency, a sharp recovery in the dollar may follow, which will be particularly pronounced in relation to high-yielding and risky assets. "Over the past few months, the rally of risky assets has been stimulated by two factors: the refusal of the US Federal Reserve System to raise interest rates and the recovery of the Chinese economy. However, risky assets poured a tub of cold water to the bulls last week. Contrary to expectations, the head of the US Federal Reserve did not discuss the idea of lowering interest rates last Wednesday. At the same time, a number of economic data for China last April turned out to be worse than forecast estimates." Citigroup currency strategists stated. According to them, there is a very tangible chance that the dollar will be able to get out of the range and begin to strengthen. The USD/JPY pair is trading near local lows, since the risk aversion continues to support demand for the yen as a safe haven. Meanwhile, according to experts of Danske Bank, developments for the yen could follow a "bearish" scenario in the near future, given the increased uncertainty regarding the conclusion of the trade deal between the United States and China. Despite the threats of Donald Trump, on Tuesday, the Chinese Ministry of Commerce confirmed that Deputy Prime Minister Liu He would arrive in the US today for talks, which are supposed to take three days to complete with the formation of a draft agreement. Market participants are now lost in speculation whether the tightening of Washington's position is to speed up the negotiation process, or the introduction of new tariffs will be a response to Beijing's unwillingness to comply with the agreements that have already been reached. "We believe that ending the trade war is in the interests of both China and the United States. Although the negotiation process may be delayed, we expect that the transaction will be concluded in the second quarter. Such a development will be negative for the yen. An additional risk for the latter is the possibility that, by resolving trade disputes with the Middle Kingdom, the United States may make claims to Japan and start threatening to impose duties on Japanese goods, "said by the experts of Danske Bank. They recommend considering the decline in the USD / JPY pair as a strategic buying opportunity. As for the single European currency, it demonstrates remarkable resilience, even despite concerns about the negative impact of the escalation of the US-China trade war on the eurozone economy. According to ING analysts, the worst for the euro is already left behind. They believe that there are a number of reasons for opening long positions on the EUR/USD pair: 1. The reduction of the gap in the growth of GDP in the eurozone and the United States. By 2020, a cyclical slowdown in the United States will lead to a decrease in GDP growth rates of up to 2.0% or less, while in the eurozone, they will remain at 1.1–1.5% over the next 6-8 quarters. 2. The change in the differential interest rates of the Fed and the ECB. So far, the situation is in favor of the dollar, but in the case of a slowdown in the US economy, it will begin to change, which will lead to a weakening of the positive cash flow for the greenback. 3. Dual US deficiency. As economic growth slows down in the United States, the combination of a negative trade deficit / current account deficit and a state budget deficit will begin to have a stronger effect on the US currency. 4. Favorable indicators of the balance of payments in the eurozone. The peak of migration of European investors to foreign markets in search of profitability has already passed, and the combination of current account balance and direct and portfolio investment has become more positive for the euro. 5. Undervaluation of the single European currency. According to ING calculations, the euro is undervalued by 19% based on purchasing power parity. The bank expects the EUR / USD pair to reach 1.18 in the fourth quarter, and 1.25 in 2020. On the evening, the pair AUD/USD jumped to the weekly highs, increasing in response to the decision of the RBA to maintain the status quo instead of a possible reduction in the interest rate. However, the "Aussie" quickly lost the points, and the AUD / USD pair, was unable to consolidate above the level of 0.7040, and then began to crawl to the downside. "The decision of the Reserve Bank of Australia to leave the rate at 1.50% knocked out of the "saddle" short-term speculators who put on the weakening of the "Aussie", and provided an impetus for the upward correction. However, the central bank only delayed the inevitable, and the rate will still be lowered. Thus, the Australian currency can only hope for positive surprises from the situation on the raw materials market, including iron ore prices, optimistic notes in the statement on the RBA's monetary policy, which will be published on May 10, and progress in the US-China trade negotiations " WESTPAC analysts said. "So far, none of this has been observed. Thus, we consider it interesting to open short positions in AUD / USD with a target at 0.6970." they added.  |
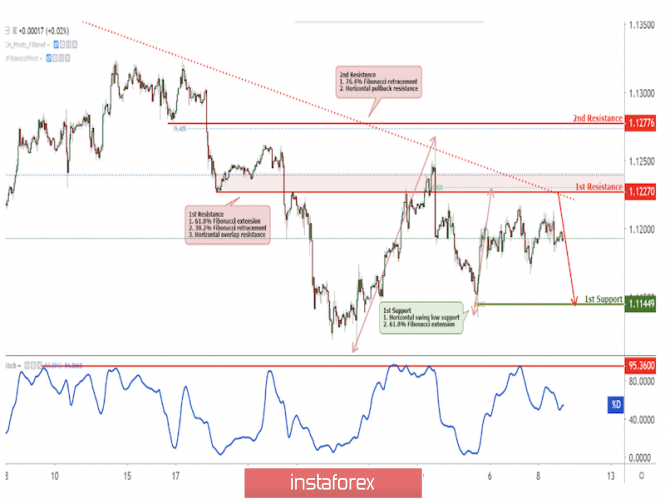
| EUR/USD approaching resistance, potential reversal! Posted: 08 May 2019 07:01 PM PDT
Price is approaching resistance where we might see a corresponding drop in price to our first support level. Entry : 1.12270 Why it's good : horizontal overlap resistance, 61.8% Fibonacci extension, 38.2% Fibonacci retracement Stop Loss : 1.1277 Why it's good : 76.4% Fibonacci retracement, pullback retracement Take Profit : 1.1144 Why it's good : horizontal swing low support, 61.8% Fibonacci extension
 |
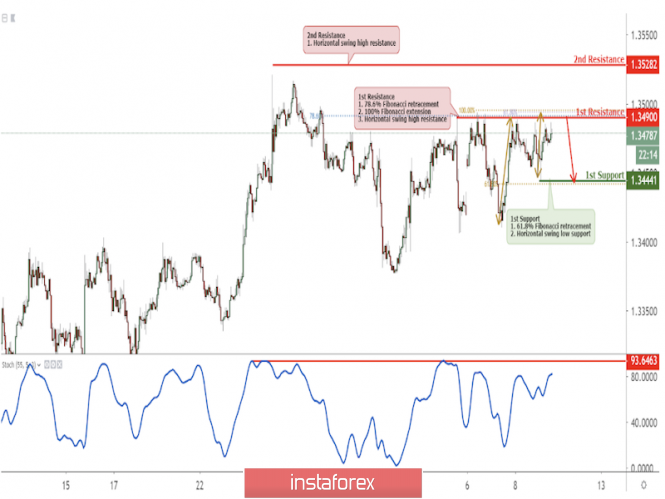
| USD/CAD approaching its key resistance where we could see a reversal occur! Posted: 08 May 2019 06:58 PM PDT Price is approaching a key resistance at 1.3490 where it could potentially reverse to its support at 1.3444. Entry : 1.3490 Why it's good : horizontal swing high resistance, 78.6% Fibonacci retracement, 100% & 61.8% Fibonacci extension Stop Loss : 1.3528 Why it's good : horizontal swing high resistance Take Profit : 1.3444 Why it's good : 61.8% Fibonacci retracement, horizontal swing low support
 |
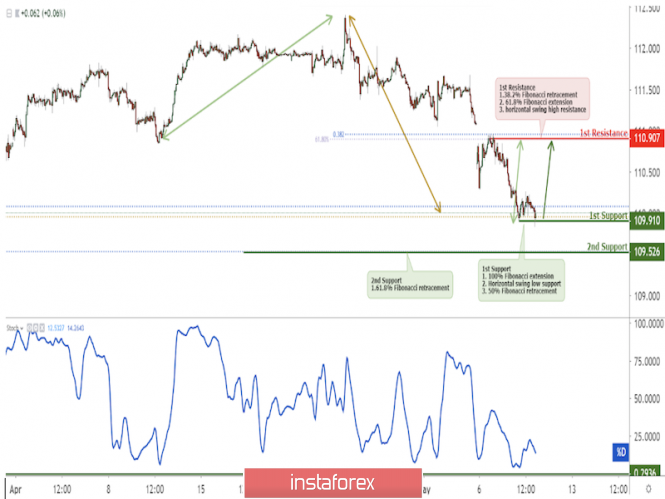
| USD/JPY approaching key support, potential to bounce! Posted: 08 May 2019 06:55 PM PDT
USDJPY is approaching its support where it could potentially bounce Entry: 109.91 Why it's good :100% Fibonacci extension, 50% Fibonacci retracement, horizontal swing low support Stop Loss : 109.53 Why it's good : 61.8% fibonacci retracement Take Profit : 110.91 Why it's good: 38.2% Fibonacci retracement, 61.8% Fibonacci retracement horizontal swing high resistance
 |
| Posted: 08 May 2019 06:02 PM PDT The fall in world stock indices and the yield of US Treasury bonds following Donald Trump's statement that he would raise tariffs from 10% to 25% on $200 billion worth of imports from China starting on May 10, were liked by the "bulls" on XAU/USD. Quotes of the pair rose to a three-week high, but fans of the precious metals are in no hurry to force the events. It is not known how the trade talks between Washington and Beijing will end. Any result will be ambiguous for gold. Despite an increase in the XAU/USD on the forex market, there has been an overflow of precious metals from west to east in the physical asset market, which is more typical for bearish market conditions. Commerzbank notes that stocks of specialized exchange-traded funds fell below the psychologically important mark of 2000 tons for the first time since December. Outflow from ETF takes place during 9 of the last 10 trading days. In Asia, on the contrary, buyer activity is increasing. The People's Bank of China replenishes its gold and currency reserves for the fifth month in a row. In April, they increased it by 480 thousand ounces and reached the level of 61.1 million ounces. Import of gold by India has risen from 73 T in March, up to 121 T in April. At the end of the second month of spring in 2018, the figure was only 52.8 tons. In light of the escalation of the trade conflict between the US and China, investors are actively buying bonds and safe haven currencies in the face of the Japanese yen and the Swiss franc, while gold is not in a hurry to grow due to fears that the trade war will slow down the growth of global GDP. Divergence in the economic development of the United States and the rest of the world according to last year's pattern will work on the side of the US dollar, which is a bearish factor for XAU/USD. Dynamics of US dollar and gold On the other hand, events can develop in a different scenario. The weakness of global demand will continue to contribute to a slowdown in US inflation. The Fed will be forced to lower the Federal funds rate, which will shake the position of the USD index and boost investors' interest in gold. The latter is quite sensitive to the monetary policy of the Federal Reserve, and the increase in the probability of monetary expansion in 2019 from 51% to 40% support the "bulls" on XAU/USD. According to Vice-Chairman of the Fed Richard Clarida, the derivatives market is inclined to lower rates not because of the health of the US economy, but because of the growing international risks. Many investors are in no hurry to force events, as by the end of the week by May 12, the situation with the trade war is unlikely to clear up. If China decides to respond to the White House's increase in import duties with an eye for an eye, a tooth for a tooth, the risk appetite will continue to deteriorate. On the contrary, signing the agreement on the falling flag will return interest in profitable assets. Technically, the daily chart of gold continues to implement the "Double bottom" and "Wolfe Wave" patterns. The target of the latest model is located near $1320 per ounce (projection from point 5 to line 1-4). A necessary condition for its achievement is the exit of futures quotes beyond the downward trading channel. The material has been provided by InstaForex Company - www.instaforex.com |
| Disagreement between the US and China becomes more serious Posted: 08 May 2019 05:48 PM PDT Tweets by Donald Trump last Sunday have turned everything upside down, and in the center of investors' attention, is a possible disruption of the deal between the US and China and, as a result, the escalation of the trade conflict. Thus, concerns in the markets are increasing every day. Traders are trying to understand exactly what the head of the White House wanted to say. Perhaps, his words were part of the negotiation strategy, and thus, Washington is trying to get more concessions from Beijing. However, informed sources told Reuters today that Trump's threats are not at all harmless and can acquire real outlines. Moreover, on Wednesday, before the beginning of the American session, the world stock indices literally took off an average of 0.5% in a minute after the appearance of a fresh tweet by the US President. "China informed us" that the country's officials will come to Washington to conclude a trade deal. After some time, the office of the country's Trade Representative announced an increase in duties on Chinese goods worth $ 200 billion. About the dollar Past episodes of trading tensions contributed to the growth of the dollar. But now, the situation is somewhat different. The US currency is weakening not only in relation to the yen, but almost in all directions. This trend is due to the fact that growing concerns about the trade dispute between Washington and Beijing prompted market participants to raise their expectations of lowering the rates in the US later this year. As for the euro, this currency was able to resist, despite the block of negative publications. The European Commission has worsened estimates of economic growth and inflation for the current year. Germany, on the other hand, has published disappointing statistics on industrial orders. Although the market was pleased with the information that the volume of industrial production in the country grew by 0.5% in monthly terms instead of the expected decline. However, the German Ministry of Economics made it clear that the prospects in this direction remain weak. The largest European economy suffers from uncertainty around Brexit and trade frictions. Meanwhile, good news from the negotiating table will create the prerequisites for the continuation of the EUR/USD rally. Meanwhile, the British pound declined on Wednesday, after the UK confirmed its participation in the May elections to the European Parliament. This suggests that inter-party compromise on Brexit should not be expected in the near future. Theresa May was quick to report that work in this direction is underway. Thus, negotiations between Labor and the government continued on Wednesday.  |
| Hackers "took out" bitcoins worth $41 million from the crypto-exchange Posted: 08 May 2019 04:10 PM PDT Hackers stole bitcoins worth $41 million. The management of Binance, one of the world's largest cryptocurrency exchanges, reported the incident. This is the last of a series of major cryptocurrency thefts around the world. According to a report by CEO Zhao Changpeng published on the Binance website, 7,000 bitcoins were stolen by hackers using various methods, "including phishing, viruses and other attacks." The report says that the users' funds will not be affected, because the company will use the stabilization fund to cover the losses. After the news was published in the early stages, the price of bitcoin fell by 4.2 percent, although later on the cryptocurrency compensated for part of the losses. Zhao announced on Twitter that other crypto currency exchange, including Coinbase, blocked deposits with addresses associated with the burglary. Last year, from crypto-currency exchanges and infrastructure services, such as wallets and exchangers, $950 million worth of bitcoins were stolen, which is almost 260 percent more than in the previous year, a study by the US company for computer security CiptherTrace showed. An analytical assessment confirmed that exchangers in Japan and South Korea accounted for 58 percent of thefts last year. Zhao's report on the Binance website says that deposits and withdrawals from the exchange will be suspended while the company conducts a thorough analysis of security systems, which it estimates will take a week. The material has been provided by InstaForex Company - www.instaforex.com |
| The production volume in Germany rose unexpectedly, but prospects for the euro have deteriorated Posted: 08 May 2019 04:10 PM PDT Germany's industrial output unexpectedly surged in March, boosted by increased consumer goods production and construction growth, but the economy ministry warned that prospects for the region and the euro remain weak as Europe's largest economy suffers from trade wars and Brexit. The volume of industrial production increased by 0.5 percent compared to the previous month, contrary to the forecast of a fall of 0.5 percent, according to data published by the Statistics Office. However, this is not a reason for the positive, the business climate in the manufacturing sector has become worse. Therefore, the situation in the industrial sector can still turn out even worse in the coming months. Recall, industrial orders after two months of a sharp decline in March rose less than expected. The economic and trade policy of US President Donald Trump under the slogan "America first" and the uncertainty that arose as a result of Britain's withdrawal from the European Union, hit the export-oriented economy of Germany. The country's authorities were forced to cut their growth forecasts for 2019 to 0.5 percent, a sharp decline after rising 2.2 percent and 1.4 percent in 2017 and 2018, respectively. "After all, the German economy is still at the mercy of global economic events. Dependence on external demand is a burden in the atmosphere of trade conflicts and isolationist tendencies," said Thomas Gitzel, chief economist at VP Bank. The material has been provided by InstaForex Company - www.instaforex.com |
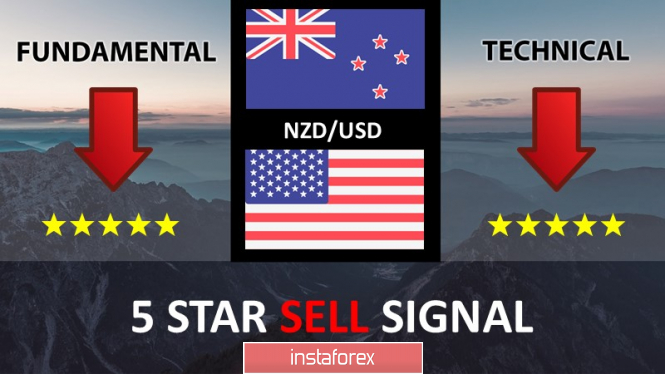
| NZD/USD 5 Star Signal | Fundamental + Technical Analysis Posted: 08 May 2019 02:30 PM PDT
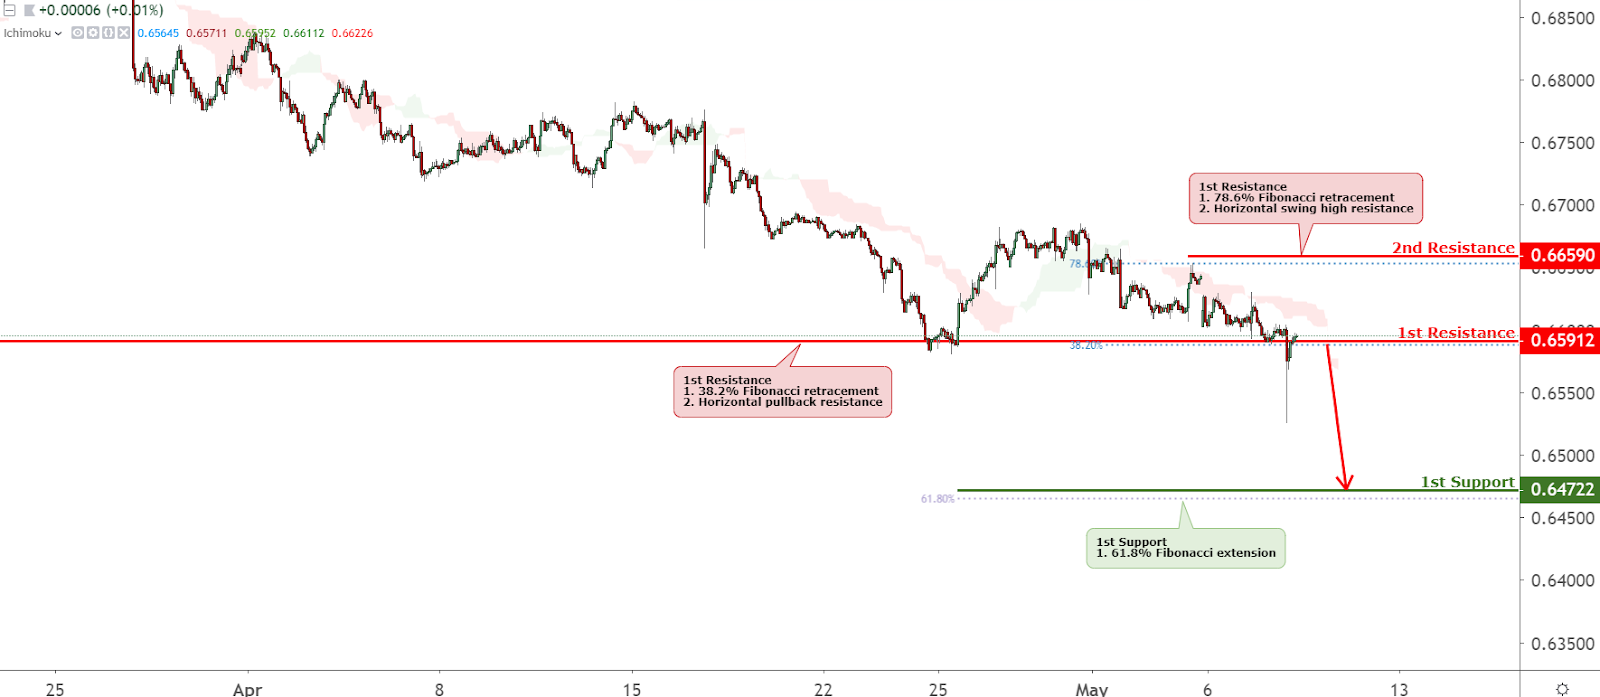
Fundamentals: RBNZ cuts key rate to 1.5% this morning, as a forecast by most economist. "The monetary policy committee decided a lower OCR is necessary to support the outlook for employment and inflation consistent with its policy remit", the central bank said in a statement. It was also stated that employment is near maximum sustainable level. However, the outlook for employment growth is more subdued and capacity pressure is expected to ease slightly in 2019. However, the RBNZ's statement was not too dovish and left little impression that successive interest rate cuts are in store, as such the NZD pares most of its losses. NZD and AUD are not moving solely on domestic monetary policies, and are also dictated by other factors including US-China trade talks this week. If they are able to come to an agreement before the new tariffs are set in place this Friday, it could help lift the commodity currencies. Technicals: Sell Entry : 0.6591 Why it's good: Price is breaking out of a very strong support level which was previously a 38.2% Fibonacci retracement. We can see bearish ichimoku cloud pushing price down too. Take profit : 0.6472 Why it's good: This is a big fibonacci extension level which price would be attracted to. Stop loss : 0.6659 Why it's good : Nice 78.6% Fibonacci retracement and horizontal swing high resistance The material has been provided by InstaForex Company - www.instaforex.com |
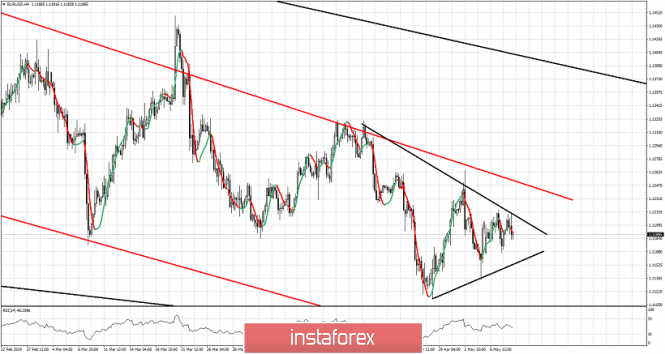
| Triangle pattern in EURUSD that remains in a bearish medium-term trend. Posted: 08 May 2019 11:35 AM PDT EURUSD is trading in a tight range forming a triangle pattern. Today we saw price get rejected at the upper triangle boundary and support is at 1.1150. Failure to hold this level will open the way for new lows as price remains inside a longer-term bearish channel.
Black lines - triangle pattern EURUSD is moving mostly sideways inside the black triangle. Price is also inside the red bearish channel we have mentioned many times in our previous posts. As long as price is inside this channel we remain bearish. Breaking above the upper triangle boundary will challenge the upper red channel boundary. If however the triangle is broken downwards we should expect price to move towards 1.11 and lower. Resistance is at 1.1220-1.1250 area. Breaking above this area would be a bullish sign. Until then we remain bearish. The material has been provided by InstaForex Company - www.instaforex.com |
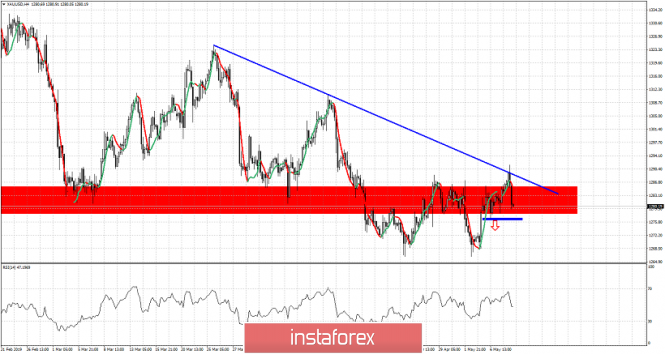
| Gold unable to break above resistance Posted: 08 May 2019 11:31 AM PDT Gold price marginally moved above $1,288 previous high but soon after got rejected. In our previous post we mentioned how important resistance area this is and there was always the danger of getting rejected. Now our focus is shifted to the short-term support at $1,276.
Blue line -major resistance Blue rectangle - short-term support Gold price got rejected at the blue trend line resistance. Price is now pulling back and a break below the short-term support of $1,276 will open the way for a move towards $1,250-60 or even lower. Resistance remains at $1,290-$1,300 area and as long as Gold remains below that level we remain bearish. A daily close above $1,290 will make me turn neutral, but a break above $1,300 will make me turn bullish. So far Gold seem weak and bulls unable to break resistance levels. If the double bottom at $1,266 breaks expect Gold to fall towards $1,250-$1,225. The material has been provided by InstaForex Company - www.instaforex.com |
| May 8, 2019 : EUR/USD Intraday technical analysis and trade recommendations. Posted: 08 May 2019 10:26 AM PDT
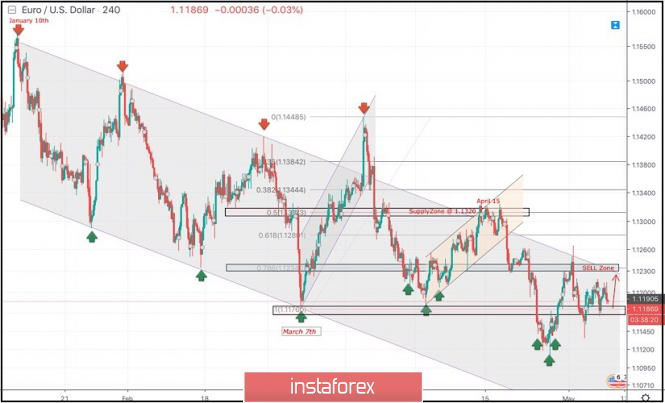
Few weeks ago, a bullish Head and Shoulders reversal pattern was demonstrated around 1.1200. This enhanced further bullish advancement towards 1.1300-1.1315 (supply zone) where significant bearish rejection was demonstrated on April 15. Short-term outlook turned to become bearish towards 1.1280 (61.8% Fibonacci) then 1.1235 (78.6% Fibonacci). For Intraday traders, the price zone around 1.1235 (78.6% Fibonacci) stood as a temporary demand area which paused the ongoing bearish momentum for a while before bearish breakdown could be executed on April 23. Currently, the price zone around 1.1235-1.1250 has turned into supply-zone to be watched for bearish rejection. Few days ago, another recent bullish head and shoulders pattern was being demonstrated around 1.1140 on the H4 chart. That's why, conservative traders were suggested to wait for another bullish pullback towards 1.1230-1.1250 where a valid SELL entry was suggested. On Friday, the market has failed to sustain bearish pressure below the price Level of 1.1175. That's why, another bullish pullback was expected to occur towards the depicted SELL zone around 1.1235. However, the EURUSD pair found great bearish rejection around 1.1200 - 1.1210 which brought the EURUSD pair down towards 1.1175 again. Trade recommendations : Conservative traders should wait for an obvious H4 bearish closure below 1.1175 for a valid SELL entry. S/L should be placed around 1.1200. Initial Target levels should be located around 1.1135 and 1.1080. The material has been provided by InstaForex Company - www.instaforex.com |
| May 8, 2019 : GBP/USD Intraday technical analysis and trade recommendations. Posted: 08 May 2019 10:18 AM PDT
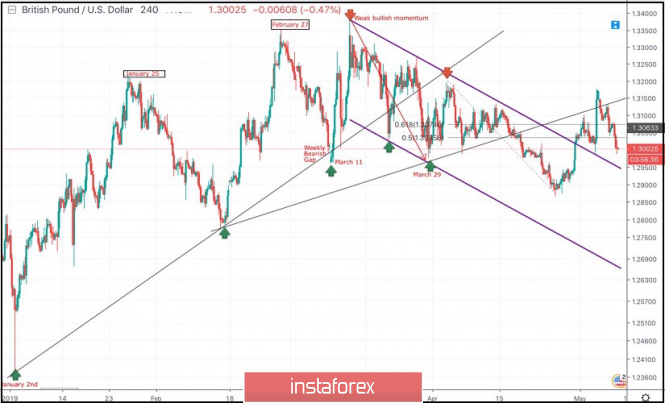
On March 29, the price levels of 1.2980 (the lower limit of the newly-established bearish movement channel) demonstrated significant bullish rejection. This brought the GBPUSD pair again towards the price zone of (1.3160-1.3180) where the upper limit of the depicted bearish channel as well as the backside of the depicted broken uptrend line demonstrated significant bearish rejection. Since then, Short-term outlook has turned into bearish with intermediate-term bearish targets projected towards 1.2900 and 1.2850. Last week, a bullish pullback was executed towards the price levels around 1.3035 - 1.3070 (50% - 61.8% Fibonacci levels) where temporary bearish rejection was demonstrated. However, by the end of Friday's consolidations, significant bullish momentum was initiated around 1.3000. Hence, a bullish breakout above 1.3075 was temporarily achieved. Temporarily, short-term outlook turns to become bullish provided that the price levels around 1.3035 (50% Fibonacci level) remains defended by the bulls. However, earlier Today, a bearish closure below 1.3035 was achieved thus enhancing the bearish side of the market. Currently, The price zone of 1.3030-1.3050 constitutes a prominent supply-zone to be watched for bearish entries. On the other hand, bullish breakout above 1.3030 enhances a quick bullish movement towards 1.3075 where the next Fibonacci level is located. Trade Recommendations: Conservative traders should be waiting for signs of bearish reversal around the depicted price levels (1.3035-1.3050) as a valid SELL signal. T/p levels to be located around 1.2950 and 2880. Any bearish breakout above 1.3080 invalidates this bearish scenario. The material has been provided by InstaForex Company - www.instaforex.com |
| Technical analysis of USD/CHF for May 08, 2019 Posted: 08 May 2019 07:30 AM PDT  |
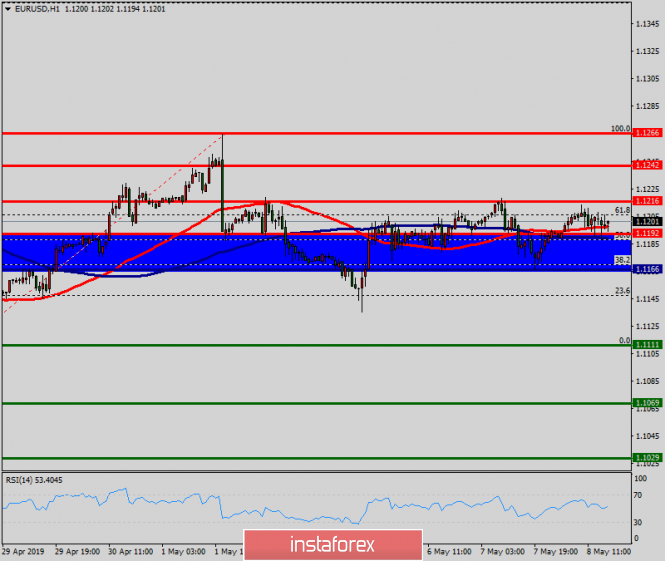
| Technical analysis of EUR/USD for May 08, 2019 Posted: 08 May 2019 07:19 AM PDT The EUR/USD pair continues to move downwards from the level of 1.1192. Last week, the pair dropped from the level of 1.1192 to the bottom around 1.1111. Today, the first resistance level is seen at 1.1192 followed by 1.1216, while daily support 1 is seen at 1.1111. According to the previous events, the EUR/USD pair is still moving between the levels of 1.1192 and 1.1111; for that we expect a range of 81 pips. If the EUR/USD pair fails to break through the resistance level of 1.1111, the market will decline further to 1.1069. This would suggest a bearish market because the RSI indicator is still in a positive area and does not show any trend-reversal signs. The pair is expected to drop lower towards at least 1.1069 with a view to test the second support. On the other hand, if a breakout takes place at the resistance level of 1.1192 (major resistance), then this scenario may become invalidated. The material has been provided by InstaForex Company - www.instaforex.com |
| The reaction of the New Zealander to the decision of the RBNZ: a good mine in a bad game Posted: 08 May 2019 07:08 AM PDT The Reserve Bank of New Zealand has realized its intentions and reduced the interest rate by 25 basis points. Although at the April meeting, the regulator actually warned about such a step, the market reaction was quite violent. TheNZDUSD pair collapsed to the area of seven-month lows, that is, to the base of the 65th figure. During the European session, the price won back some of the lost positions, but the mood still remains subdued. After all, judging by the rhetoric of RBNZ members, the regulator is ready to soften the parameters of monetary policy again, if the measures taken do not bring the expected effect. Such prospects will put background pressure on the kiwi, while the prospects for the Northern trend depend entirely on the prospects for US-China trade relations. It should be noted that just a day before the May meeting of the RBNZ, the Reserve Bank of Australia announced its decision. Contrary to the expectations of many experts, the Australian regulator maintained a wait-and-see position and even voiced optimistic notes on the prospects for the recovery of the national economy. Perhaps for this reason, NZD/USD traders reacted so emotionally to the generally expected decision of the New Zealand Central Bank. The stock market of the island state also played a role. The yield on 10-year government bonds fell to a minimum of one and a half months, thus putting additional pressure on the New Zealand dollar. Arguing his decision, the Central Bank of New Zealand pointed to several factors, the dynamics of which will determine the fate of interest rates. First of all, it is the country's GDP growth. According to the latest data, this figure came out at 2.3%, showing a significant slowdown for the second quarter in a row. For comparison: in 2016, this indicator fluctuated around 3.9%-4.1%, in 2017 – in the range of 3%-3.4%, and at the end of last year, it fell to a multi-year minimum of 2.3%. As the head of the RBNZ noted, the risk of further decline remains high, against the backdrop of a slowdown in both global growth and economic growth in China and Australia, which are New Zealand's largest trading partners. Another factor is the labor market. The situation here is not entirely straightforward. On the one hand, the unemployment rate in the first quarter of this year fell to 4.2%. But on the other hand, this dynamics is not due to the creation of new jobs, and the decline in the share of the economically active population. Thus, the share of the labor force of the total population in the last quarter decreased from 70.9% to 70.4%. Other key components of the New Zealand labor market were also disappointing. For example, for the first time since the third quarter of 2015, the indicator of employment growth in quarterly terms decreased to a negative area (-0.2%). In annual terms, the indicator came out at 1.5% (the weakest growth rate since the beginning of 2016), thus continuing the downward trend (the indicator falls from the third quarter of last year). Moreover, according to the head of RBNZ Adrian Orr, the pressure on production capacity will weaken, which will affect the labor market accordingly. Orr also drew attention to the slowdown in the growth rate of wages. For three quarters, this figure came out at the level of 0.5%, but at the beginning of the current year, it unexpectedly decreased to 0.3%, contrary to optimistic forecasts of experts. The head of the RBNZ noted that this fact serves as another confirmation that the inflationary pressure this year will grow "very slowly". By the way, weak inflation is another "headache" of the New Zealand regulator. The consumer price index in annual terms fell to 1.5% (from the previous level of 1.9%). In quarterly terms, the index remained at the level of the fourth quarter, that is, at 0.1%. Core inflation showed a negative trend, falling to one and a half percent – this is the weakest growth rate since last summer. Thus, the Reserve Bank of New Zealand today had every reason to reduce the interest rate. The future trajectory of monetary policy will depend on the "three whales" of macroeconomic statistics: employment growth, inflation, and GDP. If the dynamics of these indicators will continue to be negative, the RBNZ may return to the issue of lowering the interest rate in the autumn. Today's corrective pullback NZD/USD is a "good mine in a bad game", as there is no reason to restore the New Zealander at the moment. The correction is due to two reasons. First, the fact that the rate cut was partly taken into account in prices, so for the further development of the southern trend, an additional information drive was needed (which did not exist). Secondly, quite good statistical data from China was published today. So, during the first four months of this year, China's foreign trade turnover increased by 4.3% - to 9.51 trillion yuan (i.e. 1.41 trillion dollars). Exports grew by 6% (up to 5.06 trillion yuan), while imports - by 3% (to 4.45 trillion yuan). This result had a positive impact on the New Zealand dollar, as the economy of New Zealand is largely dependent on the economy of China. But, in my opinion, this price rollback will be short-term. If the US does raise duties on imports from China, and the next round of US-China talks ends in vain, the NZD/USD pair will resume its downward movement to the annual minimum of 0.6522, followed by testing of the 64th figure. The material has been provided by InstaForex Company - www.instaforex.com |
| Posted: 08 May 2019 07:08 AM PDT The euro remains in a narrow side channel, and data released on industrial production in Germany, which indicate a good start in the 1st quarter of this year, were ignored by traders. Most likely, attention is focused on trade negotiations between the US and China, and the further direction of the EURUSD pair will depend on them. Increasing disputes may lead to a stronger US dollar, while a more positive outcome will support risky assets. According to the Federal Bureau of Statistics of Germany, industrial production in March increased by 0.5% compared with February. Economists had forecast a 0.5% drop in production in March. Such a strong divergence of expectations from the final data was due to strong activity in the manufacturing industry as well as the construction sector. Thus, production in the manufacturing industry increased by 0.4%, while production in the construction sector in Germany in March increased by 1.0%. However, the Bureau noted that despite the good growth, the prospects for German industry remain moderate. Compared to the same period of the previous year, industrial production in Germany decreased by 0.9%. The speech of the President of the European Central Bank was ignored and did not concern monetary policy. As for the technical picture of the EURUSD pair, it continues to be the same as at the beginning of this week. Further prospects for the movement of the trading instrument seem vague. Bears can show themselves after the return and update of the resistance level of 1.1215, while bulls will be clearly set to hold large support of 1.1170, from which an attempt has already been made to build the lower boundary of the new upward channel. The target of buyers is the breakdown and consolidation above 1.1215, which will open a direct road in the area of last week's highs to 1.1260 and 1.1290. In the first half of the day, a report was also published, which indicated that China's exports in April declined, which in general was highly expected against the backdrop of a trade war between the United States and Beijing. According to official data, exports in April of this year fell immediately by 2.7% compared with the same period of the previous year, after rising by 14.2% in March. Economists had expected exports to grow by 1.8%. Meanwhile, imports, on the contrary, increased by 4.0% compared to the same period of the previous year after a decline of 7.6% in March. Economists had expected a decline in imports by 2.7%. China's foreign trade surplus in April was $13.8 billion, while economists assumed that the trade surplus would be $33.6 billion. Oil prices remained in a narrow range after today's statement by the President of Iran. In it, Hassan Rouhani drew attention to the fact that the Islamic Republic may terminate the implementation of certain obligations related to the nuclear deal, which was concluded in 2015. Such statements, of course, will not be ignored by the White House USA. However, this was primarily addressed to all European authorities. Rouhani reminded the countries of Europe about the concluded agreements, and also gave them 60 days to solve problems in the field of oil supplies and banks, which the EU uses to hide behind imports. The Iranian President also said that if his requests are not heard, Tehran may return to complete the construction of a nuclear facility in Arak, thereby terminating the nuclear deal. The material has been provided by InstaForex Company - www.instaforex.com |
| Posted: 08 May 2019 07:08 AM PDT To open long positions on GBP/USD, you need: The bulls failed to stay above the important support levels that I paid attention to in my morning forecast. The lack of agreements on Brexit between the two main parties of the UK continues to put pressure on the pair. The main task of buyers for the second half of the day is to return to the resistance of 1.3041. Only then can we expect an upward correction in the area of the maximum of 1.3087, where I recommend fixing the profit. Also, the bulls will need a lot of strength to stay in the afternoon above the support of 1.2987, the test of which may take place in the near future. In the scenario of its breakdown, it is best to open long positions on the rebound from the minimum of 1.2946. To open short positions on GBP/USD, you need: The bears coped with the morning task and continued the downward correction in the pair, despite the emerging divergence on the MACD indicator. The main goal of sellers for the second half of the day will be to update the minimum of 1.2987, which will push GBP/USD down to the support area of 1.2946 and 1.2905, where I recommend fixing the profits. Also, a good signal to sell will be an unsuccessful attempt to consolidate above the resistance of 1.3041, which will lead to a return to the market of new sellers of the pound. Indicator signals: Moving Averages Trading is below 30 and 50 moving averages, indicating a bearish advantage. Bollinger Bands In the case of the pound's company in the afternoon, the average border around 1.3060 will act as resistance. Description of indicators
 |
| EUR/USD: plan for the American session on May 8. Calm continues Posted: 08 May 2019 07:08 AM PDT To open long positions on EURUSD, you need: The situation has not changed at all, despite the speech of the President of the European Central Bank. The main goal for today remains the range of 1.1214, the consolidation of which will lead EUR/USD to the maximum area of last week to 1.1260 and will retain the upward potential with the test levels of 1.1282 and 1.1301, where I recommend fixing the profit. In case of further decline of the euro, long positions are best to go after the downward correction from the support of 1.1170, provided that a false breakdown is formed, or to rebound from a larger area of 1.1138. To open short positions on EURUSD, you need: Bears kept the pair under the resistance of 1.1214. While trading is below this level, the pressure on the euro will remain, which will lead to a decrease and consolidation under the support level of 1.1170, the breakdown of which will push EUR/USD to the minimum area of 1.138 and 1.112, where I recommend fixing the profit. With the euro rising above the resistance of 1.1214 in the second half of the day, against the background of the absence of important fundamental statistics on the US, it is best to open short positions on the rebound from the maximum of 1.1260, but the intermediate resistance can be the level of 1.1240. Indicator signals: Moving Averages Trading is conducted in the area of 30 and 50 moving averages, which continues to indicate the lateral nature of the market. Bollinger Bands The volatility of the indicator has decreased, which does not give signals on entering the market. Description of indicators
 |
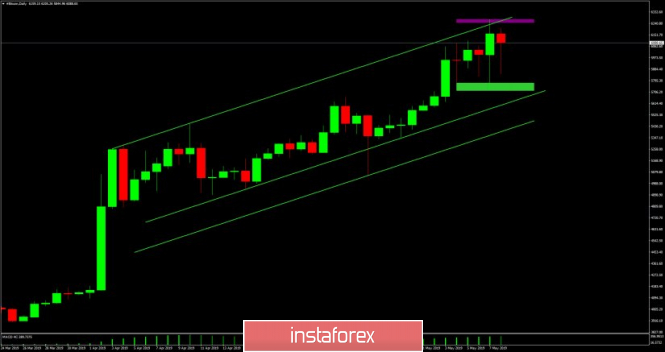
| Bitcoin analysis for May 08, 2019 Posted: 08 May 2019 06:41 AM PDT BTC is trading inside of the well-defined trading range. Watch for potential breakout of the resistance or support to confirm further direction.
Purple rectangle – Resistance $6.270 Green rectangle – Short-term support $5.720 Green lines – Upward channel According to the Daily time-frame, we found that BTC is trading inside of the well-defined trading range between the price of $6.265 (resistance) and $5.720 support. The BTC tested the upper diagonal of the channel, which is sign that downward correction might come into the play. In case of selling, downward target will be set at $5.720. In case of upward break, upward target will set at $6.750. The material has been provided by InstaForex Company - www.instaforex.com |
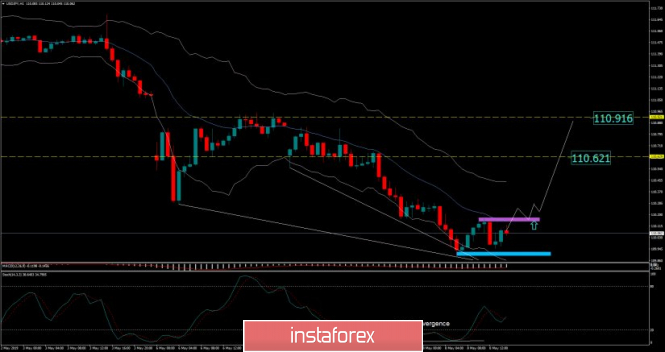
| USD/JPY analysis for May 08, 2019 Posted: 08 May 2019 05:55 AM PDT Gold has been trading downwards as we expected. The price tested the level of 109.90. Anyway, we found that sellers are losing down momentum, which may be a strong sign for potential rally in the future.
Purple rectangle – Intraday resistance 110.17 Blue rectangle – Short-term support 109.90 Blue line – Middle of Keltner Channel EMA 110.15 Yellow horizontal line – Resistance 1 Yellow horizontal line – Resistance 2 According to the H1 time-frame, we found bullish divergence on the stochastic oscillator, which is sign that sellers lost momentum and that buyers may react. Our advice is to watch for confirmation of the bullish trend, which is at least 2 higher lows on the 30M time-frame in order to confirm the bullish trend. Upward references are set at 110.62 and 110.91. Key support is set a the price of 109.90. Watch for buying opportunities. The material has been provided by InstaForex Company - www.instaforex.com |
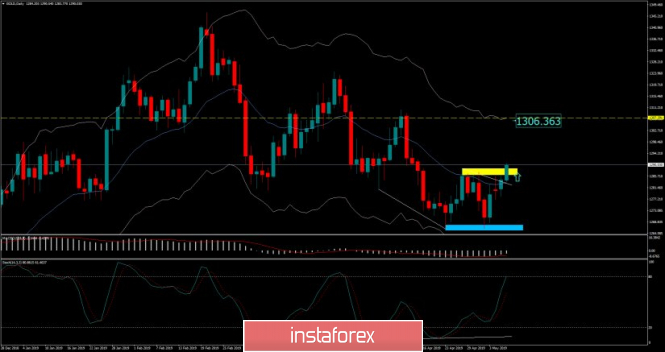
| Analysis of Gold for May 08, 2019 Posted: 08 May 2019 05:38 AM PDT Gold did break the key resistance at the price of $1.288 and set the tone for the next few days. Buying opportunities are prefereble.
Yellow horizontal line – Resistance-Upward objective Yellow rectangle – Broken resistance now support Blue line – Middle of Keltner Channel EMA According to the Daily time-frame, we found that Gold finally managed to break the resistance at the price of $1.288, which is sign that buyers took control from sellers and momentum is up. Also, strong bullish divergence in the background did set the tone for the near-term future. Medium Keltner line acted like resistance but Gold did manage to break it and now the medium Keltner line acting like support. Our advice is to watch for buying opportunities with the target at $1.306. Key support levels are seen at $1.276 and $1.266. The material has been provided by InstaForex Company - www.instaforex.com |
| GBP/USD. May 8th. Results of the day. Laborites and Conservatives can't agree yet Posted: 08 May 2019 05:26 AM PDT 4-hour timeframe The amplitude of the last 5 days (high-low): 73p – 64p – 188p – 89p – 91p. The average amplitude over the last 5 days: 101p (107p). From our point of view, after the pound quite unreasonably rose to 1.3170 amid expectations of reaching an agreement between Labor and Conservatives, which will gain the necessary number of votes to support the "deal" of Theresa May, traders returned to the pair's sales, as no data confirming the success of the negotiations were received. Thus, the pound is quite logically returning to its initial positions. Moreover, we still believe that the pair may look to the South exclusively in the coming weeks or even months, as the British pound still has no fundamental support. All of Theresa May's plans to "push" her version of the agreement through Parliament are crumbling. The prospect of holding a second referendum is clearly visible, as the political forces of Great Britain cannot agree among themselves. Thus, there is a high probability that the fate of the country will have to be decided by its people. What will happen to Theresa May in this case? Clearly, the collapse of her political career. She never managed to reach an agreement with all the participants of the "deal". Brexit under threat of failure. We also remind you that this is not the first time there is information that Scotland may hold its referendum on independence, and in this case, the UK may suffer serious territorial and economic losses. In general, this whole situation does not bode well for the country, and the British pound will continue to be inclined to fall. Trading recommendations: The GBP/USD currency pair continues a perfectly logical downward movement after it overcame the critical line. Thus, the first target for short positions is the Senkou Span B line, and the next target is the level of 1.2908. Purchase orders can be considered in small lots only after the reverse consolidation of the price above the Kijun-Sen line with the first target of 1.3263. In addition to the technical picture should also take into account the fundamental data and the time of their release. Explanation of illustration: Ichimoku Indicator: Tenkan-Sen – red line. Kijun-Sen – blue line. Senkou Span A – light brown dotted line. Senkou Span B – light purple dotted line. Chinkou Span – green line. Bollinger Bands Indicator: 3 yellow lines. MACD: A red line and a histogram with white bars in the indicator window. The material has been provided by InstaForex Company - www.instaforex.com |
| Posted: 08 May 2019 05:26 AM PDT 4-hour timeframe The amplitude of the last 5 days (high-low): 78p – 48p – 70p – 37p – 51p. Average amplitude over the last 5 days: 57p (57p). The third trading day of the week is held for the EUR/USD pair in the same weakly volatile trades without a pronounced trend, even intraday, as the day before. No new data concerning the EUR/USD pair were available to traders. Thus, market participants have nothing to react to. As a result, all the lines of the Ichimoku indicator are as close as possible to each other, which signals a flat. The Bollinger Bands narrowed and turned sideways, which also indicates lateral movement. Based on this, it is best to wait until the end of the current flat and then resume active trading. Tonight, the ECB Head Mario Draghi is scheduled for the evening, but this does not mean that he will tell the market something important or at least something new. Thus, the situation in the evening may not change. The rumors about the beginning of a full-scale trade war between the EU and the States are still in full swing. However, there is little official information on this topic. Accordingly, traders are again deprived of the opportunity to "work out information". Also, markets are waiting for information about the negotiations between the US and China on trade conditions that are designed to save both countries from a full-scale trade war. It's hard to say how they will end, but Trump's categorical and radical nature suggests that either China will have to give up again or the negotiations will fail. Trading recommendations: The currency pair EUR/USD went to the side channel. Thus, it is not recommended to open any positions, as the probability of a full flat is high. We recommend waiting for the signs of the pair's exit from this channel, and then resume trading. In addition to the technical picture should also take into account the fundamental data and the time of their release. Explanation of illustration: Ichimoku Indicator: Tenkan-Sen – red line. Kijun-Sen – blue line. Senkou Span A – light brown dotted line. Senkou Span B – light purple dotted line. Chinkou Span – green line. Bollinger Bands Indicator: 3 yellow lines. MACD: A red line and a histogram with white bars in the indicator window. The material has been provided by InstaForex Company - www.instaforex.com |











| You are subscribed to email updates from Forex analysis review. To stop receiving these emails, you may unsubscribe now. | Email delivery powered by Google |
| Google, 1600 Amphitheatre Parkway, Mountain View, CA 94043, United States | |

No comments:
Post a Comment