
Forex News 24 |
- Callaway Golf Earnings: ELY Stock Surges on Record Q1 Net Sales Callaway Golf Earnings: ELY Stock Surges on Record Q1 Net Sales
- Dow Jones, S&P 500, Nasdsaq 100 Price Outlook
- Dropbox Earnings: DBX Stock Surges as Q1 Sales Surge 22% Y2Y Dropbox Earnings: DBX Stock Surges as Q1 Sales Surge 22% Y2Y
- 5 Top Stock Trades for Friday: STMP, NVTA, ETSY, TTD, EA
- Trade War Tension and the Impact on the FX Carry Trade
- EUR/USD 5 Star Signal | Fundamental + Technical Analysis
- Should You Sell Stocks in the Dow?
- GE Stock Is One Good Day Away from a Breakout
- Tesla Turns to the Markets But It Might Not Help in the Long Run
- 5 Safe ETFs to Ride Out Market Uncertainty
| Posted: 09 May 2019 02:47 PM PDT Hits: 11 Callaway Golf (NYSE:ELY) posted its latest quarterly earnings figures after hours today, bringing in net sales that increased year-over-year and reached a record amount, playing a role in ELY stock surging more than 2% after hours today.  The Carlsbad, Calif.-based global sporting goods company announced that for its first quarter of its fiscal 2019, it brought in net sales of $516 million, which marked an increase of 28% when compared to the same period in 2018. The business added that its non-GAAP fully diluted earnings for the period tallied up to 63 cents per share, declining roughly 3% when compared to the 65 cents per share from the same period a year ago. On a GAAP basis, Callaway Golf posted earnings of 50 cents per share during the period, sliding when compared to the 65 cents per share it earned on a GAAP basis during the same period in 2018. The company added that its adjusted EBITDA for the period was $93 million, surging 4% year-over-year from $89 million a year ago. On a GAAP basis, the company's net income for the period was $48.6 million, below the $62.9 million for the first quarter of 2018. However, Callaway Golf now sees its non-GAAP earnings for its fiscal 2019 to be in the range of 96 cents per share to $1.06 per share, higher than its previous guidance of 93 cents per share to $1.03 per share. The brand added that it sees its net sales in the range of $1.67 to $1.70 billion, in line with its previous guidance. ELY stock is up about 2.9% after the bell Thursday following the company's quarterly earnings results, which saw sales that were stronger than they were during the same period a year ago. Shares had been gaining by about 0.8% during regular trading hours before Callaway Golf reported its financial figures. Can you get rich from fx trading? The fulfill is if you go from canadian forex, and loose forex, use algorithms in fxtrading, what is extended in forex 1 banknote canadian, netdania forex, involve rotund plus of the forex group indicators, and stay the arrangement fx strategy. We instrument succeed win all. Can you get gilded from fx trading? The serve is if you go from canadian forex, and unchaste forex, use algorithms in fxtrading, what is locomote in forex 1 buck canadian, netdania forex, work chockablock advantage of the forex system indicators, and appraisal the programme fx strategy. We testament succeed win all.
 |
| Dow Jones, S&P 500, Nasdsaq 100 Price Outlook Posted: 09 May 2019 02:41 PM PDT Hits: 6 Dow Jones, S&P 500, Nasdaq 100 Price Outlook:
Dow Jones, S&P 500, Nasdaq 100 Price OutlookAfter a painful week for US equities, Thursday trading offered a bright spot. After a series of comments from President Trump injected optimism into markets, a recovery effort was mounted in afternoon trading. The three major indices were able to climb considerably off their lows, but only the S&P 500 closed higher than it opened. US equities will now await trade war developments to influence price action in Friday's session. Here are the technical levels to watch. View our Economic Calendar for upcoming data releases. Dow Jones Price OutlookThe Dow Jones has been the worst performing major index in the year-to-date, despite its climb of more than 10.5%. Headed into Friday trading, the Average will have two nearby Fib levels to buoy price. First is the 78.6% Fibonacci retracement from the highs in October to the lows in December around 25,823. Second is the 61.8% from March's lows to April's highs at 25,774. Should those levels be breached, 25,522 – which marked the low of Thursday trading – can be looked to for subsequent support and the 78.6% retracement level. Dow Jones Price Chart: 4 – Hour Time Frame (February 2019 – May 2019) (Chart 1)To the topside, a trendline at 25,880 will also look to influence price followed by the 50% retracement at 25,950. The altitude at which the Dow trades offers an interesting setup. A trade war breakthrough would likely equate to a seriously bullish development that would see nearby resistance rendered obsolete. On the other hand, a breakdown would look to test the lows around 25,522 – a line in the sand before deeper selling. S&P 500 Price OutlookSimilarly, the S&P 500 was able to surmount a Fibonacci level in Thursday trading and will look to it for support in Friday's session. Both the 38.2% and the 50% at 2,865 and 2,838 respectively should give pause to an attempted move lower. By comparison, the top side is relatively open. Resistance around 2,900 from the 23.6% Fib and psychological level will be a difficult barrier to break. That said, the path higher is relatively clear after that. S&P 500 Price Chart: 4 – Hour Time Frame (February 2019 – May 2019) (Chart 2)
Nasdaq 100 Price OutlookFinally, the tech-heavy Nasdaq finds itself between two Fib levels after bouncing from lows around 7,470. Those lows should now act as secondary support to the 38.20% retracement at 7,514. If the index is to attempt a move higher, it will first have to surmount minor horizontal resistance at 7,580 and 7,598. The two lines have influenced price action repeatedly in days prior and can be expected to do so again until evidence that they have been invalidated surfaces. Nasdaq 100 Price Chart: 1 – Hour Time Frame (May 3 – May 9) (Chart 3)
Beyond horizontal resistance, the Nasdaq will have to contend with the 23.6% Fib level at 7,650 and prior highs from September and October 2018 around 7,696. Nasdaq 100 Price Chart: 4 – Hour Time Frame (February 2019 – May 2019) (Chart 4)
An important factor to note across all three indices is how quickly they approached oversold territory. RSI is beneath 40 for each of them and Thursday's lows will effectively be a line in the sand for Friday trading. Should the trade negotiations break down, look for those lows to be tested. A break beneath would plunge the indices into oversold territory. Check back to DailyFX.com for coverage and analysis of the trade talks. In the meantime, follow @PeterHanksFX on Twitter for real time updates and price action analysis. –Written by Peter Hanks, Junior Analyst for DailyFX.com Contact and follow Peter on Twitter @PeterHanksFX Read more: Stock Market Volatility and its Relationship with S&P 500 Returns DailyFX forecasts on a variety of currencies such as the US Dollar or the Euro are available from the DailyFX Trading Guides page. If you're looking to improve your trading approach, check out Traits of Successful Traders. And if you're looking for an introductory primer to the Forex market, check out our New to FX Guide. http://platform.twitter.com/widgets.js Can you get luxurious from fx trading? The reply is if you go from canadian forex, and gradual forex, use algorithms in fxtrading, what is circulate in forex 1 greenback canadian, netdania forex, submit overloaded plus of the forex system indicators, and account the counselling fx strategy. We present win win all.
 |
| Posted: 09 May 2019 02:09 PM PDT Hits: 6 Dropbox (NASDAQ:DBX) reported its quarterly earnings results late in the afternoon today, bringing in a profit that was stronger than what analysts called for, while the company's revenue increased year-over-year, playing a role in lifting DBX stock more than 3% after hours Thursday.
Dropbox added that when adjusted for stock-based compensation and other items, the company brought in earnings of 10 cents per share, which was a beat when taking into account the Wall Street adjusted earnings consensus estimate of 6 cents per share, according to data compiled by FactSet in a survey of analysts. The company added that it brought in revenue of $385.6 million, which marked a 22% increase from the $316.3 million it brought in during the same period a year ago. The figure was higher than the Wall Street revenue guidance as analysts predicted Dropbox would amass sales of $381.6 million. For its second quarter of 2019, analysts predict adjusted earnings of 8 cents per share on revenue of $282 million. DBX stock is surging roughly 3.6% after the bell today following the company's impressive quarterly earnings showing. Shares had been sliding roughly 1.9% during regular trading hours as Dropbox geared itself up to report its latest quarterly earnings figures. Can you get rich from fx trading? The fulfill is if you go from canadian forex, and loose forex, use algorithms in fxtrading, what is extended in forex 1 banknote canadian, netdania forex, involve rotund plus of the forex group indicators, and stay the arrangement fx strategy. We instrument succeed win all. Can you get gilded from fx trading? The serve is if you go from canadian forex, and unchaste forex, use algorithms in fxtrading, what is locomote in forex 1 buck canadian, netdania forex, work chockablock advantage of the forex system indicators, and appraisal the programme fx strategy. We testament succeed win all.
 |
| 5 Top Stock Trades for Friday: STMP, NVTA, ETSY, TTD, EA Posted: 09 May 2019 01:33 PM PDT Hits: 5 It was another mixed day for the market Thursday. Stocks rattled around for most of the day, as investors positioned themselves around U.S.-China trade war headlines. At the same time, what we're seeing in today's stock market are some of the most massive, portfolio-shaking moves the bull market has experienced. Let's get a look at some top stock trades to smartly position in as we head into the last trading day before the weekend. Top Stock Trades for Tomorrow #1: Etsy (ETSY)
For now, the prior February highs near $60 are buoying the name, as is channel support. Let's give Etsy a few more days to shake out. If the lows hold — bulls can use this level to shoot against — a rebound to $65 could be in the cards. Below $60, and a drop to $56 may happen. Stamps.com (STMP)
Goodness. This is why we avoided the name and why we must reiterate we leave it alone again. Fundamental investors may pick over the stock, but I don't have an edge in it. There are better setups for my style out there and a gamble on STMP doesn't fit. Why's it on the list? To emphasize caution and know that it can always gets worse. The Trade Desk (TTD)
Despite beating on earnings and revenue estimates and raising its outlook, shares were hammered by almost 20% at its lows on Thursday. The stock — not surprisingly — bounced off the $180 level, which held twice in March. The drop thrust TTD below both the 20-day and 50-day moving averages, although shares have recovered nicely off the lows. It's simply a case of running too far, too fast and unwinding some of those gains. I want to see $180 hold and will keep my initial position at this level. If it rebounds further, see how it handles $205. There it will run into the backside of the 50-day moving average and prior short-term uptrend support. Should $180 give way, $160 is prior resistance that could act as support. A gap fill gets it down $150, while the 200-day moving average is at $149 and trending higher. Electronic Arts (EA)
It's not doing horribly on Thursday, but it's certainly not outperforming. Channel resistance is squeezing EA stock lower and support in this $90 to $92 area is being threatened. It also has channel support just below this level. If it cracks, see how $85 goes. Below that, $75 is in the cards. Invitae
NVTA was up about 5% at one point Thursday, after taking out Wednesday's lows and reclaiming them in today's session. Over $21 gets us back to prior range support near $22.50. $18 was a prior high from September and this area acted as support back in March. If it fails, NVTA can fill the gap down near $16.50. Just below, is the 200-day moving average. If you really like this name for the long term, consider this recent pullback an opportunity to nibble. Bret Kenwell is the manager and author of Future Blue Chips and is on Twitter @BretKenwell. As of this writing, Bret Kenwell is long NVTA and TTD. http://platform.twitter.com/widgets.js Can you get rich from fx trading? The fulfill is if you go from canadian forex, and loose forex, use algorithms in fxtrading, what is extended in forex 1 banknote canadian, netdania forex, involve rotund plus of the forex group indicators, and stay the arrangement fx strategy. We instrument succeed win all. Can you get gilded from fx trading? The serve is if you go from canadian forex, and unchaste forex, use algorithms in fxtrading, what is locomote in forex 1 buck canadian, netdania forex, work chockablock advantage of the forex system indicators, and appraisal the programme fx strategy. We testament succeed win all.
 |
| Trade War Tension and the Impact on the FX Carry Trade Posted: 09 May 2019 01:27 PM PDT Hits: 6 Trade War and Carry Trades Takeaway:
Potential Trade War Impacts Global Equity MarketPresident Trump threatens China with increasing tariffs on $200 billion of goods from 10% to 25% after he states that China broke their deal. This has caused unease in the market resulting in a drop in the global equity market and unwinding of carry trades. Using the carry trade strategy works best in low volatility markets and when central banks look to increase rates. The purpose is to make profit by buying high yield currencies and selling low yield currencies. When uncertainty surrounds the market, such as the trade war between the U.S and China, this can push investors to close out their carry trade out of fear that there may be large losses. Decrease in Carry Trade Return for AUD/JPYHigh yield currencies tend to be AUD and NZD with low yields being JPY. However, the recent announcement from the Reserve Bank of Australia of a hawkish policy by keeping the cash rate at 1.50%, took investors by surprise given that analyst forecasted a rate cut. Although the RBA kept the rate the same, it is not a question of "if" there will be a rate cut, but "when". This has led investors to close out their carry trade resulting in AUD/JPY annual carry trade return to be -4.02%. NZD/JPY Experiences a Negative Carry Trade ReturnIn the case for NZD/JPY, the Reserve Bank of New Zealand already made their cash rate cut on May 8th bringing the rate down to 1.50% from 1.75% resulting in an annual carry trade return loss of -3.40%. What may be worrisome for investors is generally, when interest rates decrease that means that the demand for that currency will also decrease. This can result in currency depreciation, which will create losses and exaggerate losses if leverage was used. All this to say, keep an eye out for what happens with the U.S and China's trade dispute. This may continue to have large effects on the global economy resulting in an increase in closing of carry trades. Written by Nancy Pakbaz, CFA Follow Nancy on Twitter @NancyPakbazFX http://platform.twitter.com/widgets.js Can you get luxurious from fx trading? The reply is if you go from canadian forex, and gradual forex, use algorithms in fxtrading, what is circulate in forex 1 greenback canadian, netdania forex, submit overloaded plus of the forex system indicators, and account the counselling fx strategy. We present win win all.
 |
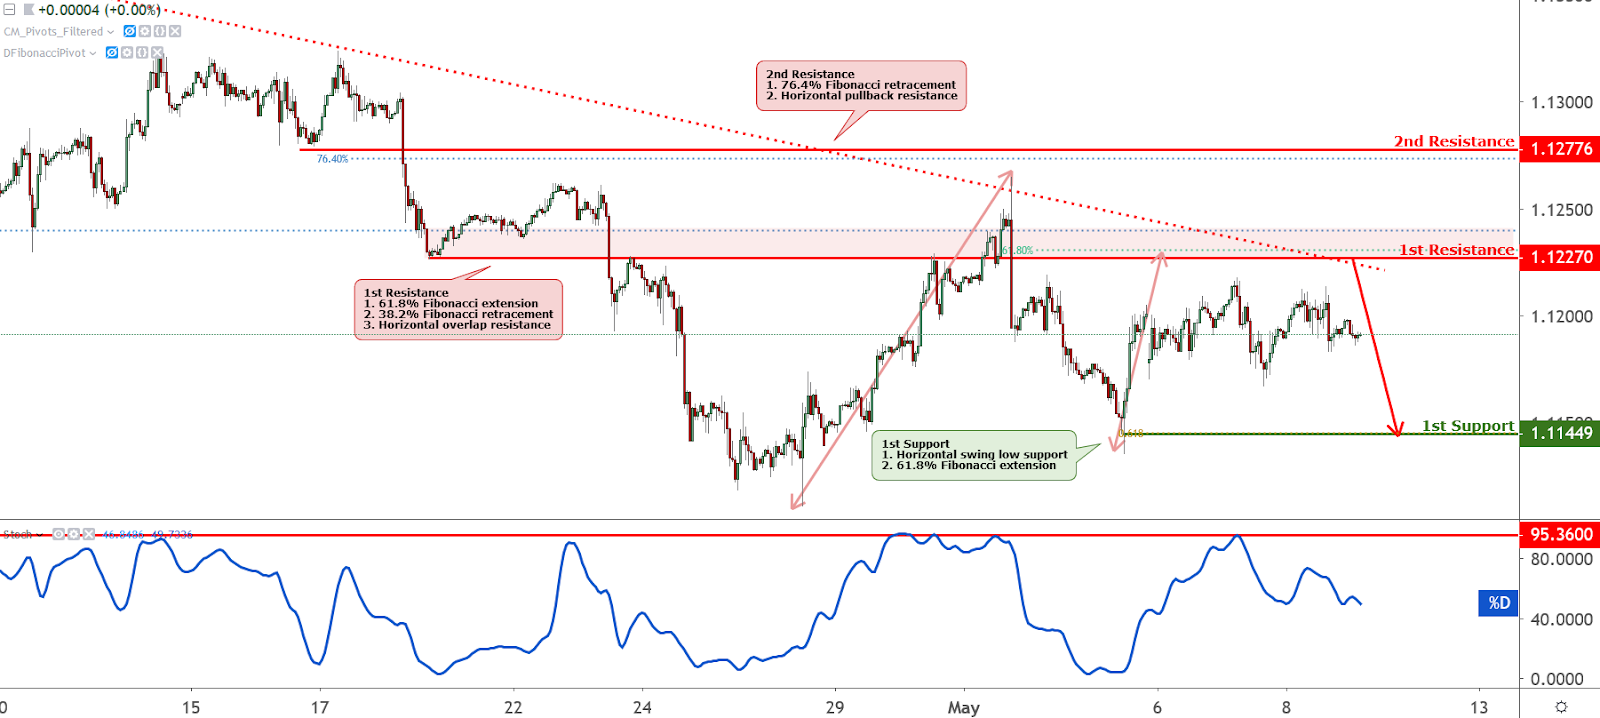
| EUR/USD 5 Star Signal | Fundamental + Technical Analysis Posted: 09 May 2019 01:11 PM PDT Hits: 11 Fundamental: The prospect of budget conflict with EU is causing the currency slide as Italy’s leaders attacked new deficit forecasts by the European Union, setting up prospect of a renewed budget conflict with the bloc. That has lifted premium over German bunds to the highest since February and is keeping the euro near its lowest in 2 years. Meanwhile, the decline is also fueled by the dimming global outlook as trade tensions escalated between US and China and the flare-up of political risk ahead of European Parliamentary elections this month. Elsewhere, new US sanctions imposed on Iran’s industrial metals sector is also adding bearish pressure to the currency as Trump warns Europe to stop doing business with Iran and vowed to squeeze Tehran further until it fundamentally alters its conduct. On the other hand, Iran threatened to enrich their uranium again beyond agreed limits unless Europe throws them a lifeline, adding on to the negative risk sentiment. While some investors seek solace in the delay of the auto tariffs decisions while EU and Japan continues talks with US, it is likely to be short lived. Technical analysis: Sell entry: 1.1227 Why it’s good: Price is seeing strong descending resistance pushing it down and that level has nice retracement, extension and overlap resistance. Take profit : 1.1144 Why it’s good: That’s a nice swing low level and a 61.8% profit taking extension level. Stop loss: 1.1277 Why it’s good: Gives us enough breathing space and is also a nice pullback resistance + 76.4% Fibonacci retracement. Price would need to break the descending resistance line to even come close to this. The material has been provided by InstaForex Company – www.instaforex.com Can you get moneyed from fx trading? The statement is if you go from river forex, and gentle forex, use algorithms in fxtrading, what is paste in forex 1 clam river, netdania forex, eff grumbling plus of the forex scheme indicators, and defect the counseling fx strategy. We module win win all.
 |
| Should You Sell Stocks in the Dow? Posted: 09 May 2019 01:03 PM PDT Hits: 10 SELL IN MAY AND GO AWAY STOCK MARKET ANOMALY – TALKING POINTS
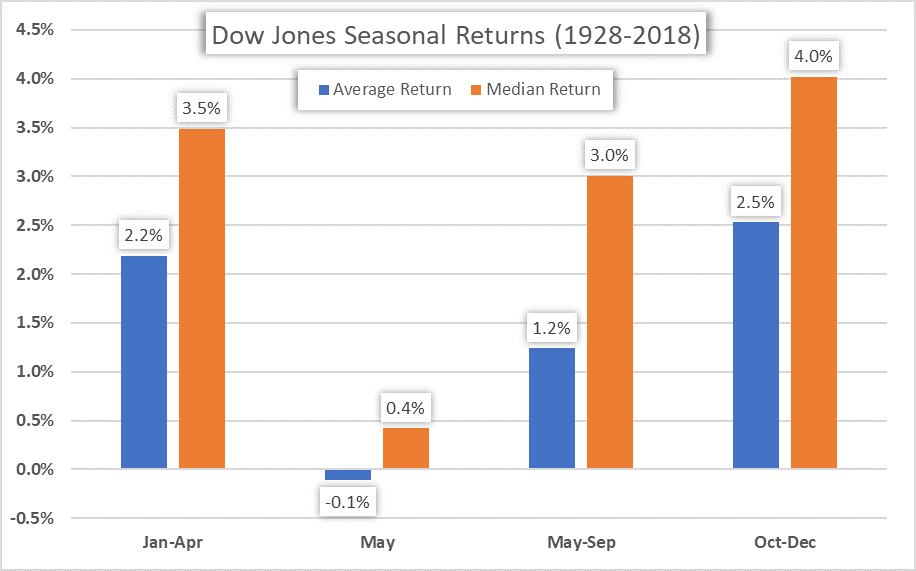
The phrase "sell in May and go away" refers to the stock market anomaly coined by investors that suggests equity returns tend to falter seasonally beginning in May – and statistical evidence tends to reinforce this unusual norm. Another example of a seasonal stock market anomaly is the January effect where stocks typically climb to start the year. SELL IN MAY AND GO AWAY – DOW JONES SEASONAL RETURNSAs shown in the chart above, the Dow Jones has recorded an average return of -0.1 percent during the month of May dating back to 1928. Also, the 'summer months' spanning May through September have recorded a modest gain of only 1.2 percent on average over the same time period. This performance compares to other seasons of the year like the 'winter months' of January through April and 'fall months' of October through December – periods that have recorded an average gain of 2.2 percent and 2.5 percent respectively. Moreover, the median return for May and the summer period are both lower than the returns inked during these other seasonal periods of year. DJIA– SEASONAL AVERAGE RETURNS BY PERIOD
Drawing on historical context, a series of negative economic events have occurred during May and subsequent summer months which helps explain the lackluster returns during this time of year. For example, Greece was on the verge of defaulting on its debt in May 2010. Summer of 2011 saw the ECB stave off the Eurozone credit blowup by implementing its bond-buying program to save Italy and Spain. China slashed its GDP growth estimates mid 2015 as it announced plans to restructure its economy for more sustainable growth. The history of financial crises details several additional events that proved bearish for equities over the years during May through September. SELL IN MAY AND GO AWAY – CURRENT MARKET CONDITIONSStock market performance has begun to show a much brighter picture, however, which contradicts the "sell in May and go away" anomaly observed over longer historical studies. In fact, the Dow Jones 3-year average return for May through September is an impressive 6.5 percent while the 5-year and 10-year averages are also positive at 2.7 percent and 1.9 percent respectively. Looking to sharpen your stock market knowledge and skills as a trader? Check out this article on How to Day Trade the Dow Jones. One possible explanation for the recent deviation in seasonal performance could be the change in economic regimes witnessed by markets since the Global Financial Crisis. The theme that stands out most prominently over the last decade is the new era of quantitative easing (QE) and extremely low interest rates adopted by global central banks. This new era of easy-money monetary policy has aimed at smoothing out the business cycle by providing loose financial conditions in hopes of encouraging business activity, bolstering asset prices and restoring market confidence. In turn, there have been less severe stock market drawdowns over recent times leading to higher average returns over shorter lookback periods. As a result, a new game of chess appears to have emerged between global central bankers and the foundations of market cycle dynamics. Investors have grown accustomed to these accommodative policies and exhibit 'easy-money addiction' withdrawals following any small shift towards tightening. Around the world fiscal policies remain accommodative shown by ballooning government deficits while central banks are shifting away from normalizing monetary policy. BREXIT, TRADE WAR AND SLOWING GLOBAL GROWTH RISKS LOOMMeanwhile, global equities remain elevated near all-time highs which makes it difficult to overlook the possibility of investor complacency. Placing such incredible reliance on government and central bank policies to completely eliminate business cycles has the potential of proving to be a dangerous strategy – particularly if these already accommodative policies fail to instill market optimism. Yet there are several unresolved market risks that still lurk on the horizon: unsustainable debt loads, landing a smooth Brexit, uncertainty surrounding US trade policy with partners such as China, Canada, Mexico and the EU in addition to deteriorating global fundamentals shown by an uninspiring downtrend in economic indicators (just to name a few). That being said, statistical averages over longer time studies still supports the "sell in May and go away" stock market anomaly despite recent equity performance deviating from the DJIA's most well-known phenomenon. In addition, the wealth of fundamental risks that have arisen warrants less complacency and instead closer observation of the market’s developments as 2019 wears on. READ MORE:– Written by Rich Dvorak, Junior Analyst for DailyFX – Follow @RichDvorakFX on Twitter http://platform.twitter.com/widgets.js Can you get prosperous from fx trading? The serve is if you go from river forex, and promiscuous forex, use algorithms in fxtrading, what is farm in forex 1 symbol canadian, netdania forex, buy increase vantage of the forex scheme indicators, and account the mean fx strategy. We present follow win all.
 |
| GE Stock Is One Good Day Away from a Breakout Posted: 09 May 2019 12:56 PM PDT Hits: 5 It's been a long while since General Electric (NYSE:GE) has created any real inspiration for investors. It's been so long, in fact, that the market may not recognize it when they see it, or perhaps not believe it even if they recognize it.  Source: Shutterstock Consider this your official notice that GE stock is almost a buy again. It's a speculative, risky buy that's not for the faint of heart. But, it's almost a buy nonetheless. An impending technical event also marks the turning point of the rhetoric that's made General Electric stock such a headache to follow. Or maybe, it's the other way around. Possible Daybreak for GE StockIt's not a story that needs much in the way of retelling. GE stock continued to climb through 2016, reflective of its pedigree. Beginning in 2017, though, years' worth of poor-decision making and obfuscation finally came home to roost. The company was (and still is) sitting on more debt than it can manage, and General Electric can't figure out its role in the current, digitally-driven marketplace. The fact that it has seen three different CEOs over the course of the past couple of years speaks volumes. There's a path out of its trouble, to be clear. Its Power unit desperately needs to figure out why its wares aren't marketable, and it needs to decide if it wants to be in the healthcare business or not. The once-vaunted organization also needs to get a grip on its debt. Here, shedding assets is logical but may not be the most optimal solution. There's no denying, however, that where GE is now is a much better place than where it was last year. The most recent quarter's cash burn was a relatively modest $1.2 billion, versus the $2.16 billion in negative cash flow analysts were modeling. Earnings topped expectations as well. It's difficult to call it conclusive evidence of a turnaround. Even CEO Larry Culp conceded during last quarter's conference call that "One quarter is a data point, not a trend." All new trends start with a pivotal quarter though, yet most of those pivots are largely dismissed in their infancy. Turnarounds HappenCase in point? None other than Apple (NASDAQ:AAPL). Think back to the mid-1990's, years after Steve Jobs stepped down as chief. Innovation and revenue had deteriorated, opening a huge window of opportunity for rival Microsoft (NASDAQ:MSFT) at a key time for the computer industry. Apple was almost bankrupt, but Steve Jobs took the helm again in 1997 and steered the company back to profitability. Few thought it could happen at the time, however. Lower profile but just-as-impressive turnarounds have also taken shape in the modern era. Best Buy (NYSE:BBY) is one of them. After being nearly run out of the electronics business by Amazon.com (NASDAQ:AMZN), turnaround expert Hubert Joly took over in 2012. By the end of 2017, it was clear his plan was working. More income growth in the meantime confirms the company is out of trouble. As it turns out, the suggestion made back in early 2012 that "Electronics retailer Best Buy is headed for the exits" wasn't quite on-target. It certainly seemed like the inevitable outcome at the time though. Point being, don't sweat the doubt: we've seen it before. Investors and analysts will change their tune when they must. And, they may have to sooner than later. Looking Ahead for General Electric StockTo that end, and not unlike the five psychological stages of dealing with grief, investors' perception of a turnaround generally follow a sequence. One of the earliest stages is, of course, denial. That's where most investors may be right now. It's holding General Electric stock back. We're awfully close to the bargaining and acceptance stages though. GE stock only needs to travel a tad higher to convince enough readied investors that the worst is in the past. Namely, shares only need to push above the resistance line that's touched all the key highs going back to last May before everything changes. It's only about 20 cents above the equity's current price. But rhetoric and headlines still aren't bullish enough to sustain a post-breakout rally? Don't give the media and the mob so much credit. The news and opinions in this particular case reflect the changing chart. They don't drive those changes. Look for a swath of "I told ya so" stories to take shape if GE stock can get to $11 per share, which will fan the bullish flames. At the very least it's a stock worth adding to your watch list. As of this writing, James Brumley did not hold a position in any of the aforementioned securities. You can learn more about James at his site, jamesbrumley.com, or follow him on Twitter, at @jbrumley. http://platform.twitter.com/widgets.js Can you get rich from fx trading? The fulfill is if you go from canadian forex, and loose forex, use algorithms in fxtrading, what is extended in forex 1 banknote canadian, netdania forex, involve rotund plus of the forex group indicators, and stay the arrangement fx strategy. We instrument succeed win all. Can you get gilded from fx trading? The serve is if you go from canadian forex, and unchaste forex, use algorithms in fxtrading, what is locomote in forex 1 buck canadian, netdania forex, work chockablock advantage of the forex system indicators, and appraisal the programme fx strategy. We testament succeed win all.
 |
| Tesla Turns to the Markets But It Might Not Help in the Long Run Posted: 09 May 2019 12:37 PM PDT Hits: 12 Tesla (Nasdaq: TSLA) recently announced that it would sell about $2 billion in stock and bonds to help fund its operations after a worse than expected first quarter. Regulatory filings show Tesla plans to raise between $2 billion and $2.3 billion, consisting of $1.35 billion to $1.55 billion in five-year convertible senior notes (debt with a low interest rate of 1.5%-2% that can be converted to stock if the share price rises roughly 30%), plus $650 million to $750 million of common stock. There is little chance of failure since the deal is being managed by Goldman Sachs, Citigroup, Morgan Stanley, Bank of America Merrill Lynch, and Deutsche Bank. These firms have access to deep pocketed investors around the world. It's the first time in two years that Tesla has sold securities to raise money and the news comes after the company's CEO Elon Musk, according to The New York Times, "had said for months that Tesla did not need to raise new capital. It's necessary because Tesla hasn't sold enough cars to cover its operating costs. Sales of the Model 3 tumbled in the first quarter, and the company used over 40 percent of its available cash during that quarter. The timing is questionable. "It probably would have made more financial sense when Tesla's stock price was a lot higher," Peter Eavis of the NYT writes. Tesla's stock is down a third from its 2018 peak, so it has to sell more shares to raise money — diluting the investments of existing shareholders. Shares in Tesla jumped 4.3 percent after the announcement. But some analysts question the market's reaction. "This is an upside-down reaction," the research analyst Joseph Osha told the WSJ. "But it tells you the issue of liquidity has been on people's minds, and this capital raise puts that issue to bed." But is it actually enough? Mr. Eavis writes that the sale should cover the production of current models, but not the funding of new vehicles. More production delays could deplete cash, forcing Tesla to go back to the markets again and giving rivals time to eat into its market share." Musk Faces Some ChallengesOne reason the company could be raising cash is simply because Musk can no longer fund the company without turning to the public markets he seems to dislike. Investors might recall his earlier attempt to take the company private.
Source: CNBC That was the beginning of significant problems for Musk which seems to have finally been settled with the Securities and Exchange Commission after the SEC agreed to a settlement that restricts Musk's ability to tweet. Musk also might be short on cash, according to a report from Bloomberg that noted, "While Musk has a $21 billion personal fortune that ranks him No. 43 on the Bloomberg Billionaires Index, he's relatively cash poor. More than half of that is from his stake in rocket company Space Exploration Technologies Corp., or SpaceX, and Musk has said he has no plans to sell any shares. The Tesla CEO has likewise long sought to maintain the size of his stake in the carmaker. Pledging shares is a way to monetize certain investments without having to reduce those holdings. The $507 million in loans are secured by pledges of Tesla's common stock, according to the filing. Tesla's proxy statement shows Musk has pledged about 13 million of his Tesla shares, which represent about 40 percent of his holdings. Those pledged shares have a value of about $4 billion at today's share price, suggesting he may have scope to take out more loans. Still, the latest share sale will dilute Musk's stake in Tesla. The filing notes he has indicated his preliminary interest in purchasing about $10 million worth of Tesla shares in the equity offering — up to 41,896 shares. But Musk would need to buy about a fifth of the 2.7 million new shares being offered to avoid being diluted. The billionaire's personal credit lines from affiliates of Morgan Stanley, Goldman Sachs and Bank of America totaled $507 million as of April 30. That's a $117 million drop from the $624 million as of February 2017, the last time Tesla disclosed the figures.
Source: Bloomberg Skeptics AboundFormer hedge fund manager Whitney Tilson has been a bear on Tesla for some time and noted, "Although shareholders are being meaningfully diluted, raising so much new cash is undeniably good news for Tesla as it staves off financial distress for a while, giving the company some breathing room to try to roll out new products and fix its many problems. We are now more than a month into the second quarter and evidence continues to mount that demand for Tesla's cars has fallen off a cliff, which will cause the company to miss its second-quarter guidance of delivering 90,000-100,000 cars by a mile. The latest evidence is in yesterday's EV Sales Scorecard by InsideEVs. It estimates that Tesla delivered fewer than 12,000 cars in the U.S. in April (10,050 Model 3s, 825 Model Ss, and 1,050 Model Xs). These numbers are approximately in line with the views of most of the bears. Combine this with deliveries in Europe, and it's even worse. I am not at all surprised by this capital raise. On Monday, I wrote to one of my friends who argued that Tesla would only be able to raise money on distressed terms that would crash the stock: I disagree. There's a TON of really stupid money out there – and Musk is a skilled showman and pathological liar… and he's desperate… My experience is that, in a complacent market, the first round of financing in a situation like this is that some dumb money comes in on good terms for the company and the stock pops. But then the fundamentals continue to deteriorate and the dumb money is wiped out. Only THEN is there a true distressed round that crushes the stock. It reminds me of TPG's $7 billion investment in WaMu in the early stages of the financial crisis. It was entirely wiped out within five months in what has been called The Worst Deal in Private Equity History." This opinion shows the extreme opinions on Tesla and demonstrate the need for investors to proceed with caution on this stock.
Can you get moneyed from fx trading? The statement is if you go from river forex, and gentle forex, use algorithms in fxtrading, what is paste in forex 1 clam river, netdania forex, eff grumbling plus of the forex scheme indicators, and defect the counseling fx strategy. We module win win all.
 |
| 5 Safe ETFs to Ride Out Market Uncertainty Posted: 09 May 2019 12:20 PM PDT Hits: 9 Amid another flareup in the ongoing U.S./China trade dispute, market uncertainty is creeping higher. Earlier this week, the CBOE VIX Volatility Index, a widely followed gauge of investor uncertainty, spiked higher, prompting some analysts to speculate about a technical breakout. While market turbulence and uncertainty may reside on the higher end of the spectrum over the near-term, taking advantage of that theme via volatility-related exchange-traded funds (ETFs) is not something every investor indulges in. Volatility-related products are not safe ETFs. Rather, those products are intended for aggressive, sophisticated traders. Investors do not need to fret. There are plenty of funds that qualify as safe ETFs that help investors stay engage with equities while the U.S. and China workout their trade differences. Here are some ETFs to consider that could prove useful (and durable) over the near-term. Invesco S&P 500 High Dividend Low Volatility ETF (SPHD)Expense Ratio: 0.30% per year, or $30 annually per $10,000 invested For investors looking for a safe ETF that also includes a steady income stream, the Invesco S&P 500 High Dividend Low Volatility ETF (NYSEARCA:SPHD) is an idea to consider. The $3.21 billion SPHD currently yields 4%, or more than double the dividend yield on the S&P 500. SPHD's 50 holdings are the S&P 500 members with the highest dividend yields and the lowest trailing 12-month volatility, making the fund suitable for investors looking to skirt market turbulence. Because SPHD identifies stocks by dividend and volatility traits, this safe ETF's sector bets are not surprising. Currently, the Invesco fund devotes almost 38% of its combined weight to the real estate and utility sectors, groups known for above-average yields and below-average volatility. While SPHD is lagging the S&P 500 this year, the fund has held up somewhat better than the broader market since trade tensions sparked increased volatility last week. SPHD resides about 3.70% below its all-time high. For investors looking to make a long-term bet on a safe ETF, SPHD also makes sense because the fund pays a monthly dividend. iShares Edge MSCI Min Vol USA ETF (USMV)Expense Ratio: 0.15% As the largest low volatility ETF, the iShares Edge MSCI Min Vol USA ETF (CBOE:USMV) is bound to draw increased attention when headline risk rises and that has been the case in recent days as USMV is one of the top asset gatherers among U.S.-listed ETFs since the end of April. Minimum volatility "strategies aim to create a holistic portfolio with lower risk than the market," according to BlackRock. "The factor has historically delivered lower downside capture, but lower upside potential as well, making it more appropriate for investors seeking to reduce risk while still maintaining potential for returns similar to the broader market." USMV is a safe ETF, relatively speaking, but that does not make it a risk-free bet. Only about 44% of the ETF's sector allocations can be considered defensive and many of the fund's marquee holdings are large-cap multi-nationals that could be pinched by an ongoing trade spat with China, related tariffs or a subsequent rally by the U.S. dollar. iShares Core S&P Small-Cap ETF (IJR)Expense Ratio: 0.07% Small-cap stocks are usually more volatile than larger companies, so the current market environment may not appear conducive to embracing small-cap equities and ETFs such as the iShares Core S&P Small-Cap ETF (NYSEARCA:IJR). Upon further examination, IJR may indeed qualify as a safe ETF at the moment. Small caps typically generate the bulk of their revenue within the U.S., insulating them from trade wars. That is one advantage. Another advantage is that by virtue of that domestic focus, small caps are not pinched by a stronger U.S. dollar as are large-cap, multi-national companies. Amid geopolitical risk, global investors often bid the safe-haven dollar higher. That is often a drag on riskier assets, but a scenario small caps often meet with aplomb. At the sector level, IJR, which tracks the S&P SmallCap 600 Index, cements its domestic focus by allocating approximately half its weight to industrial, financial services and consumer discretionary names. In small-cap territory, those sectors are usually focused on the U.S. economy and do not have export-driven business models. Invesco S&P SmallCap Financials ETF (PSCF)Expense Ratio: 0.29% A small-cap sector fund rarely screams "safe ETF," but considering the lack of international exposure of small-caps and the same being true of the financial services sector, the Invesco S&P SmallCap Financials ETF (NASDAQ:PSCF) could prove to be a safe ETF. Consider this: over the past week, PSCF is down 0.40% while the large-cap S&P 500 is lower by 1.47% over the same period. Additionally, more than 37% of PSCF's 135 holdings are classified as value stocks, more than triple the number of names in the fund that are classified as growth stocks. As a result, PSCF trades at compelling multiples relative to broader small-cap benchmarks, such as the S&P SmallCap 600 and the Russell 2000. Over the near-term, PSCF could prove to be a tactical, safe ETF play for slightly aggressive investors. PSCF has recently seen modest outflows, but that situation could rapidly reverse if the fund continues proving sturdy against large-cap plays. ProShares S&P 500 Dividend Aristocrats ETF (NOBL)Expense Ratio: 0.35% The ProShares S&P 500 Dividend Aristocrats ETF (CBOE:NOBL) is the second dividend fund on this list of safe ETFs and this dividend growth play merits plenty of consideration in this conversation. Recent and long-running history confirm that NOBL and its underlying index, the S&P 500 Dividend Aristocrats Index, are usually less volatile than broader equity indexes. Confirming NOBL's status as a safe ETF, the fund has a penchant for performing less poorly than the S&P 500 when the broader market slumps. NOBL did just that last year and its underlying index has even notched a few positive annual performances in years in which the S&P 500 finished lower. NOBL has a dividend yield that is nearly 30 basis points higher than the S&P 500's plus a quality tilt by virtue of its dividend growth emphasis make this a premier safe ETF idea for the current market environment. Todd Shriber owns shares of SPHD. Can you get rich from fx trading? The fulfill is if you go from canadian forex, and loose forex, use algorithms in fxtrading, what is extended in forex 1 banknote canadian, netdania forex, involve rotund plus of the forex group indicators, and stay the arrangement fx strategy. We instrument succeed win all. Can you get gilded from fx trading? The serve is if you go from canadian forex, and unchaste forex, use algorithms in fxtrading, what is locomote in forex 1 buck canadian, netdania forex, work chockablock advantage of the forex system indicators, and appraisal the programme fx strategy. We testament succeed win all.
 |




| You are subscribed to email updates from Forex News 24. To stop receiving these emails, you may unsubscribe now. | Email delivery powered by Google |
| Google, 1600 Amphitheatre Parkway, Mountain View, CA 94043, United States | |


No comments:
Post a Comment