
Forex analysis review |
- GBP/USD near support, a bounce is possible!
- NZD/USD Broke Major Support, Potential Further Drop!
- EUR/JPY to test support, a bounce is possible!
- Fractal analysis of major currency pairs for June 14
- EUR / USD h4 vs USD / JPY h4 vs EUR / JPY. Comprehensive analysis of the movement options from June 14, 2019. Analysis of
- Johnson leads, pound falls
- Swiss franc may be the main beneficiary of the new global crisis
- EUR/USD. The three main problems of the euro: Italy, the ECB and Brexit
- EURUSD and GBPUSD: The euro ignores weak fundamental data, while the pound was afraid of prime minister candidate Boris Johnson's
- GBP/USD. June 13th. Results of the day. Boris Johnson won the first round of the election of the leader of the Conservative
- EUR/USD. June 13th Results of the day. Industrial production in the euro area fell by 0.4%
- June 13, 2019 : EUR/USD Intraday technical analysis and trade recommendations.
- June 13, 2019 : GBP/USD Intraday technical analysis and trade recommendations.
- Bitcoin analysis for June, 13.2019
- GBP/USD analysis for June 13,.2019
- BITCOIN consolidating above $8,000 to climb higher? June 13, 2019
- EUR/USD analysis for June 13,2019
- Technical analysis of EURUSD for June 14, 2019
- Technical analysis of Gold for June 14, 2019
- Technical analysis of AUD/USD for May 13, 2019
- Technical analysis of NZD/USD for May 13, 2019
- GBP/USD: plan for the US session on June 13. The pound remains in the wide side channel
- EUR/USD: plan for the US session on June 13. The pressure on the euro weakened, and the uncertainty increased
- Hopes of the market for a speedy reduction of the Fed rate may not be justified, except on the dollar
- AUD / USD: Aussie declines due to labor market data and Hong Kong events
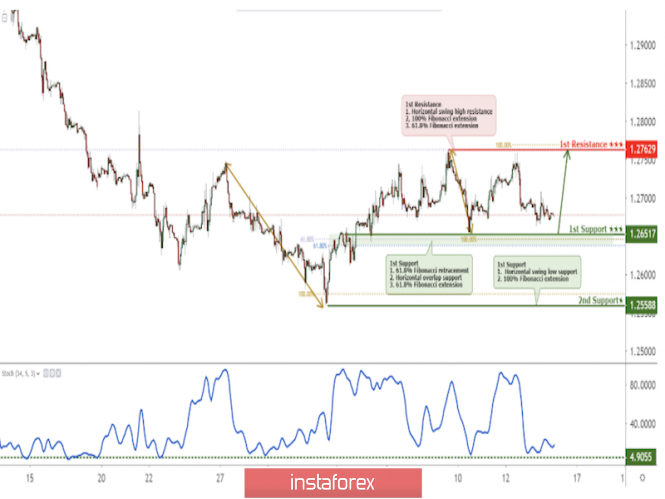
| GBP/USD near support, a bounce is possible! Posted: 13 Jun 2019 07:24 PM PDT
GBPUSD is near support, a bounce to 1st resistance is possible Entry: 1.2652 Why it's good : 61.8% Fibonacci extension, 61.8% Fibonacci retracement, horizontal overlap support Stop Loss : 1.2559 Why it's good :100% Fibonacci extension, horizontal swing low support Take Profit : 1.2763 Why it's good: 61.8 &100% Fibonacci extension, horizontal swing high resistance
|
| NZD/USD Broke Major Support, Potential Further Drop! Posted: 13 Jun 2019 07:20 PM PDT |
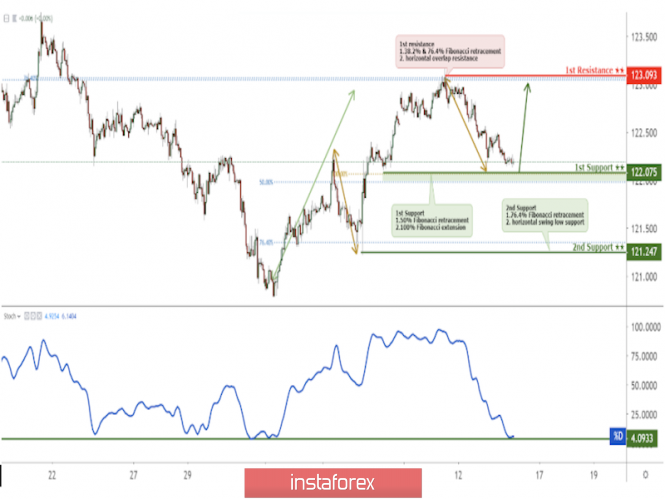
| EUR/JPY to test support, a bounce is possible! Posted: 13 Jun 2019 07:17 PM PDT
EURJPY to test key support, a bounce to 1st resistance is possible Entry: 122.075 Why it's good : 100% Fibonacci extension, 50% Fibonacci retracement Stop Loss : 121.247 Why it's good :76.4% Fibonacci retracement,horizontal swing low support Take Profit : 123.093 Why it's good: 38.2% & 76.4% Fibonacci retracement,horizontal swing high resistance
|
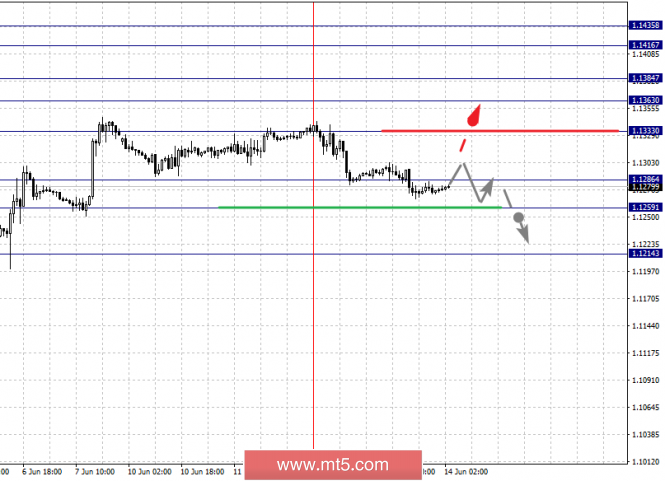
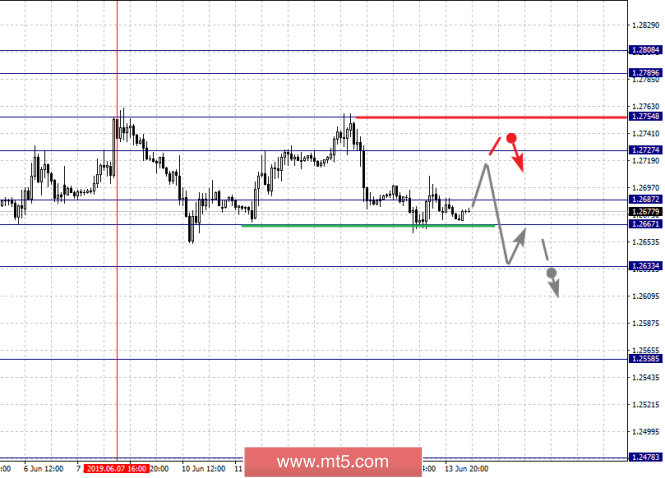
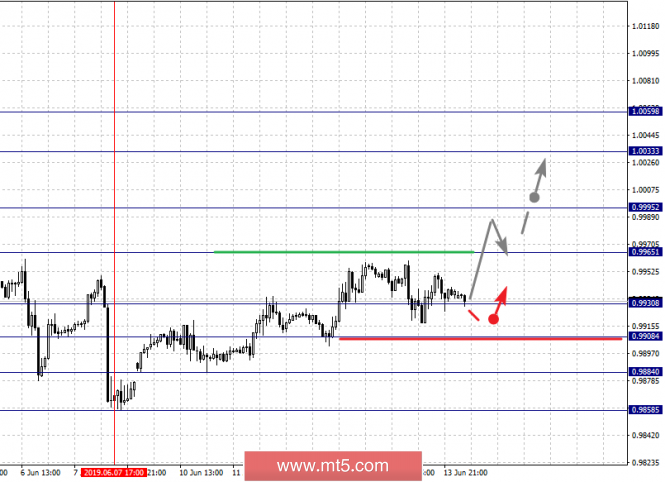
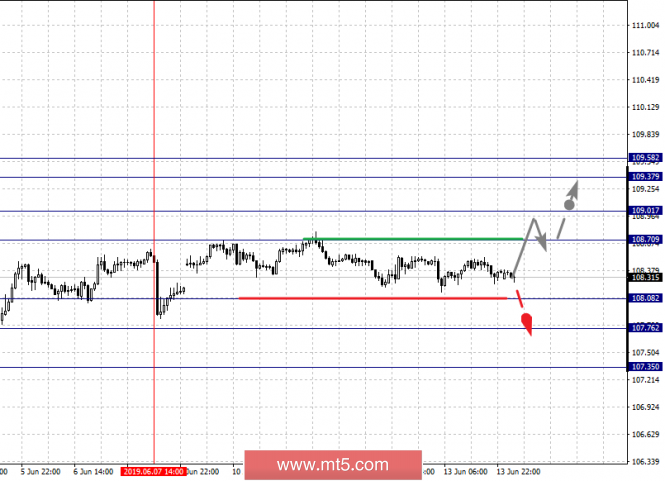
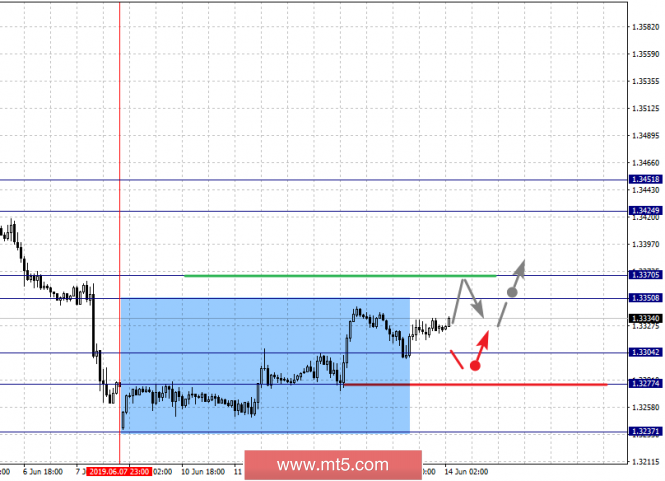
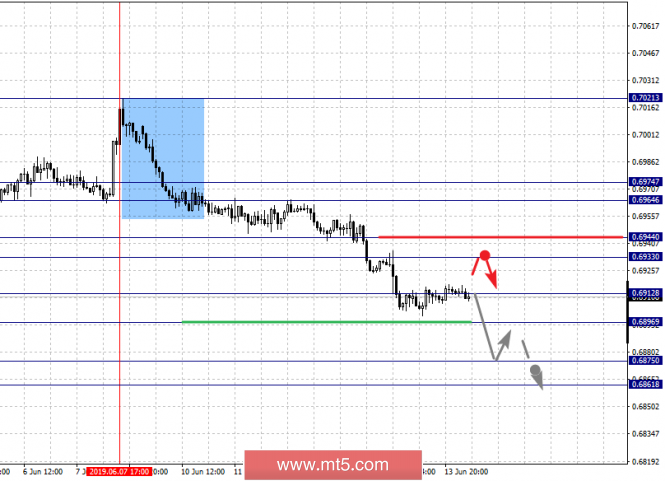
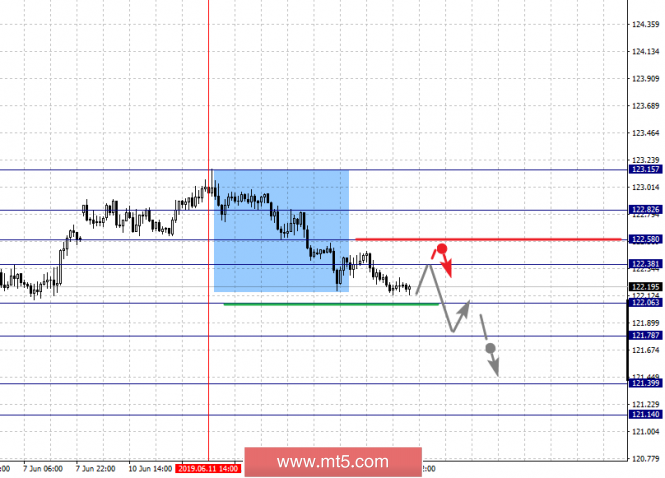
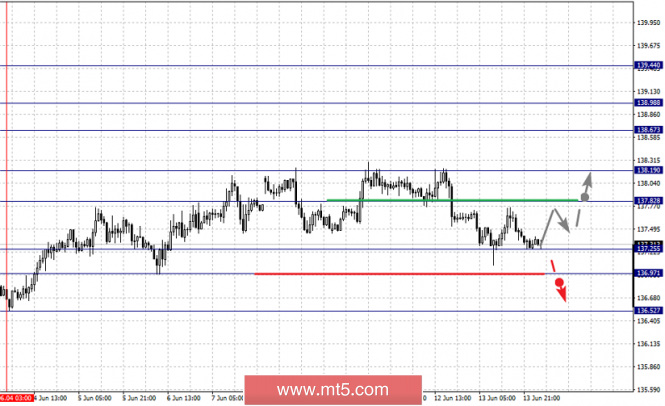
| Fractal analysis of major currency pairs for June 14 Posted: 13 Jun 2019 06:31 PM PDT Forecast for June 14: Analytical review of H1-scale currency pairs: For the euro / dollar pair, the key levels on the H1 scale are: 1.1435, 1.1416, 1.1384, 1.1363, 1.1333, 1.1286, 1.1259 and 1.1214. Here, the price is in the correction and forms the potential for downward movement of June 12. The continuation of the upward trend is possible after the breakdown of 1.1333. In this case, the first target is 1.1363. Short-term upward movement is expected in the range of 1.1363 - 1.1384. The breakdown of the latter value will lead to a pronounced movement. Here, the target is 1.1416. We consider the level of 1.1435 to be a potential value for the top. Upon reaching this level, we expect a consolidation in the range of 1.1416 - 1.1435, as well as a rollback to the correction. Short-term downward movement is possible in the range of 1.1286 - 1.1259. The breakdown of the latter value will have to form the initial conditions for the downward cycle. Here, the potential target is 1.1214. The main trend is the local structure for the top of June 5, the stage of correction. Trading recommendations: Buy 1.1333 Take profit: 1.1363 Buy 1.1386 Take profit: 1.1416 Sell: 1.1284 Take profit: 1.1262 Sell: 1.1257 Take profit: 1.1220 For the pound / dollar pair, the key levels on the H1 scale are: 1.2808, 1.2789, 1.2754, 1.2727, 1.2687, 1.2667 and 1.2633. Here, we follow the formation of the potential for the bottom of June 7. Continuation of the movement to the top is expected after the breakdown of 1.2727. In this case, the goal is 1.2754, and near this level is a price consolidation. The breakdown of the level of 1.2755 should be accompanied by a pronounced upward movement. Here, the goal is 1.2808. Price consolidation is in the range of 1.2789 - 1.2808. From here, we expect a rollback to the bottom. Short-term downward movement is possible in the range of 1.2687 - 1.2667. The breakdown of the latter value will lead to a prolonged correction. Here, the goal is 1.2633. This level is a key support for the upward structure. The main trend - the formation of the downward potential of June 7. Trading recommendations: Buy: 1.2728 Take profit: 1.2752 Buy: 1.2755 Take profit: 1.2787 Sell: Take profit: Sell: 1.2664 Take profit: 1.2638 For the dollar / franc pair, the key levels on the H1 scale are: 1.0059, 1.0033, 0.9995, 0.9965, 0.9930, 0.9908, 0.9884 and 0.9858. Here, we are following the formation of the ascending structure of June 7. The continuation of the movement to the top is expected after the breakdown of 0.9965. In this case, the target is 0.9995, wherein consolidation is near this level. The breakdown of the level of 0.9997 will lead to the development of a pronounced upward movement. Here, the target is 1.0033. For the potential value for the top, we consider the level of 1.0059. After reaching which, we expect a rollback to the bottom. Short-term downward movement is possible in the range of 0.9930 - 0.9908. Hence, a high probability of a reversal to the top. The breakdown of the level of 0.9908 will lead to the development of a protracted correction. Here, the target is 0.9884. This level is a key support for the top. The main trend - the formation of the ascending structure of June 7. Trading recommendations: Buy : 0.9965 Take profit: 0.9995 Buy : 0.9997 Take profit: 1.0033 Sell: 0.9930 Take profit: 0.9910 Sell: 0.9906 Take profit: 0.9886 For the dollar / yen pair, the key levels on the scale are : 109.58, 109.37, 109.01, 108.70, 108.08, 107.76 and 107.35. Here, the situation is in equilibrium. Short-term upward movement is possible in the range of 108.70 - 109.01. The breakdown of the latter value should be accompanied by a pronounced upward movement. Here, the target is 109.37. Meanwhile, there is a price consolidation in the range of 109.37 - 109.58. The level of 108.08 is the key support for the ascending structure. Its price passage will lead to the development of a downward trend. Here, the first target is 107.76. For the potential value for the bottom, we consider the level of 107.35. The main trend: the equilibrium state. Trading recommendations: Buy: 108.70 Take profit: 109.00 Buy : 109.03 Take profit: 109.37 Sell: 108.08 Take profit: 107.76 Sell: 107.74 Take profit: 107.37 For the Canadian dollar / US dollar pair, the key levels on the H1 scale are: 1.3451, 1.3424, 1.3370, 1.3350, 1.3304, 1.3277 and 1.3237. Here, we follow the formation of the ascending structure of June 7. The continuation of the development of an upward trend is expected after the price passes the noise range 1.3350 - 1.3370. In this case, the goal is 1.3424. For the potential value for the top, we consider the level of 1.3451. After reaching which, we expect to go into a correction. Short-term downward movement is possible in the range of 1.3304 - 1.3277. The breakdown of the last value will lead to the development of a downward trend. Here, the first potential target is 1.3237. The main trend - the formation of the ascending structure of June 7. Trading recommendations: Buy: 1.3370 Take profit: 1.3424 Buy : 1.3426 Take profit: 1.3450 Sell: 1.3304 Take profit: 1.3280 Sell: 1.3275 Take profit: 1.3240 For the pair Australian dollar / US dollar, the key levels on the H1 scale are : 0.6974, 0.6964, 0.6944, 0.6933, 0.6912, 0.6897, 0.6875 and 0.6861. Here, we are following the development of the downward cycle of June 7th. Short-term downward movement is expected in the range of 0.6912 - 0.6897. The breakdown of the last value should be accompanied by a pronounced upward movement. Here, the target is 0.6875. For the potential value for the bottom, we consider the level of 0.6861. After reaching which, we expect a consolidation, as well as rollback to the top. Short-term upward movement is possible in the range of 0.6933 - 0.6944. The breakdown of the latter value will lead to a prolonged correction. Here, the target is 0.6964. The range of 0.6964 - 0.6974 is a key support for the downward structure. Before it, we expect the initial conditions for the upward cycle to be formed. The main trend is the downward cycle of June 7. Trading recommendations: Buy: 0.6933 Take profit: 0.6944 Buy: 0.6946 Take profit: 0.6964 Sell : 0.6912 Take profit : 0.6898 Sell: 0.6895 Take profit: 0.6875 For the euro / yen pair, the key levels on the H1 scale are: 123.15, 122.82, 122.58, 122.38, 122.06, 121.78, 121.39 and 121.14. Here, the price forms the potential for the downward movement of June 11. Short-term movement to the bottom is expected in the range of 122.06 - 121.78. The breakdown of the last value should be accompanied by a pronounced downward movement. Here, the target is 121.39. We consider the level of 121.14 as a potential value for the bottom. After reaching which, we expect a consolidation in the range of 121.39 - 121.14, as well as a rollback to the top. Short-term upward movement is expected in the range of 122.38 - 122.58. The breakdown of the last value will lead to a prolonged correction. Here, the goal is 122.80. This level is a key support for the downward structure. The main trend - the formation of the potential for the downward movement of 11 June. Trading recommendations: Buy: 122.40 Take profit: 122.55 Buy: 122.60 Take profit: 122.82 Sell: 122.06 Take profit: 121.80 Sell: 121.76 Take profit: 121.42 For the pound / yen pair, the key levels on the H1 scale are : 139.44, 138.98, 138.67, 138.19, 137.82, 137.25, 136.97 and 136.52. Here, we are following the development of the ascending structure of June 4. At the moment, the price is close to canceling this structure, for which a passage of 137.25 - 136.97 is necessary. In this case, the first potential target for the bottom is the level of 136.52. The continuation of the movement to the top is expected after the breakdown of the level of 137.82. Here, the first target is 138.20. Its breakdown should be accompanied by a pronounced upward movement. In this case, the target is 138.67. Meanwhile, in the range of 138.67 - 138.98, there is a short-term upward movement, as well as consolidation. For the potential value for the top, we consider the level of 139.44. After reaching which, we expect a rollback to the bottom. The main trend is the upward structure of June 4, the stage of correction. Trading recommendations: Buy: 137.82 Take profit: 138.16 Buy: 138.22 Take profit: 138.65 Sell: 137.25 Take profit: 137.00 Sell: 136.94 Take profit: 136.55 The material has been provided by InstaForex Company - www.instaforex.com |
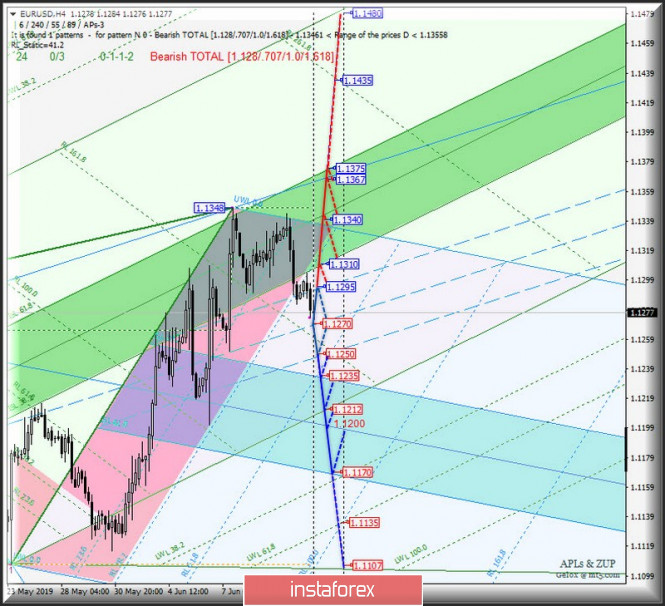
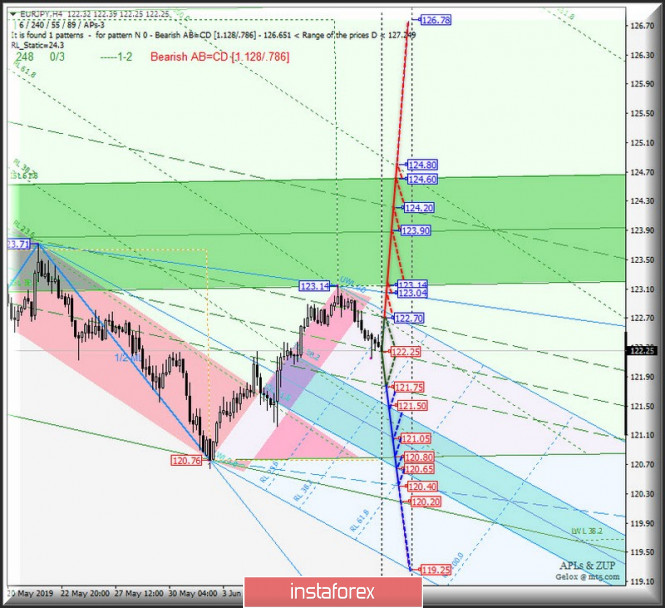
| Posted: 13 Jun 2019 05:38 PM PDT Let me bring to your attention a comprehensive analysis of the options for the development of the movement of EUR / USD vs USD / JPY vs EUR / JPY in the Minuette (h4) operational scale from June 14, 2019 ____________________ Euro vs US Dollar The movement of the single European currency EUR / USD comes within the boundaries of the 1/2 Median Line channel (1.1295 <-> 1.1270 <-> 1.1250) Minuette operational scale fork. The options for working off of these levels are presented on the animated graphics. The breakdown of the level of support 1.1250 on the lower boundary of the channel of the 1/2 Median Line Minuette will make relevant continuation of the movement of the EUR / USD to the boundaries of the equilibrium zone (1.1235 <-> 1.1200 <-> 1.1170) Minuette operational scale fork. In the case of the return of the single European currency above the upper boundary (the level of resistance of 1.1310) channel of the 1/2 Median Line Minuette, can continue the upward movement of EUR / USD to the boundaries of the equilibrium zone (1.1310 <-> 1.1340 <-> 1.1375) Minuette operational scale fork. The markup of EUR / USD movement options is shown in the animated graphic.
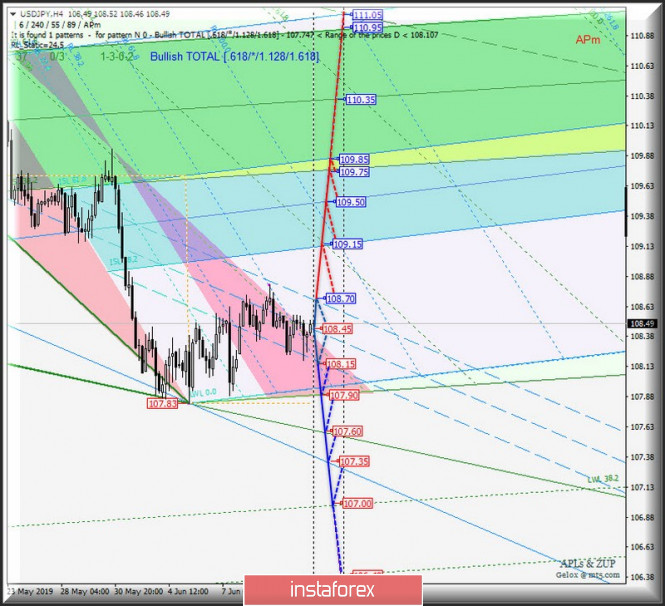
____________________ US Dollar vs Japanese Yen Just like in the case of EUR / USD, the development movement of the currency pair USD / JPY from June 14, 2019 will be determined by working off the boundary levels of the channel of the 1/2 Median Line (108.70 <-> 108.45 <-> 108.15) Minuette operational scale fork. More details can be found in the graphic shown below. The breakdown of the upper boundary (the level of resistance 108.70) channel of the 1/2 Median Line Minuette -> version of the continuation of the upward movement of the currency instrument to balance zone (109.15 <-> 109.50 <-> 109.75) Minuette operational scale fork. On the other hand, if there is a breakdown of the support level of 108.15 (lower boundary of the channel of the 1/2 Median Line Minuette), then the downward movement of USD / JPY can be continued to the targets -> initial SSL line (107.90) of the Minuette operational scale fork <-> LTL Minuette control line (107.60) <-> control line LTL Minuette (107.35) <-> warning line LWL38.2 Minuette (107.00). Markup options for the USD / JPY movement can be seen at the animated graphic.
____________________ Euro vs Japanese Yen The development of the movement of cross-instrument EUR / JPY for June 14, 2019 is due to the direction of the breakdown of the boundaries of the channel of the 1/2 Median Line (122.70 <-> 122.25 <-> 121.75) Minuette operational scale forks. In case of the breakdown of the level of resistance 122.70 (upper boundary channel of the 1/2 Median Line Minuette), the upward movement of the cross-instrument will continue to the reference line UTL (123.04) Minuette operating scale fork and boundaries of the equilibrium zone (123.14 <-> 123.90 <-> 124.60) Minuette operating scale fork. A development of the downward movement of EUR / JPY may continue after the breakdown of the level of support of 121.75 (the lower boundary of the channel of the 1/2 Median Line Minuette), and signified it will be sent to the equilibrium zone (121.50 <-> 121.05 <-> 120.65) Minuette operational scale fork with the prospect of reaching the ultimate Schiff Line Minuette (120.40). Marking options for the movement of the cross-instrument EUR / JPY is presented in the animated graphic ->
____________________ The review was compiled without taking into account of the news background. The opening of trading sessions of the main financial centers does not serve as a guide to action (placing orders "sell" or "buy"). The material has been provided by InstaForex Company - www.instaforex.com |
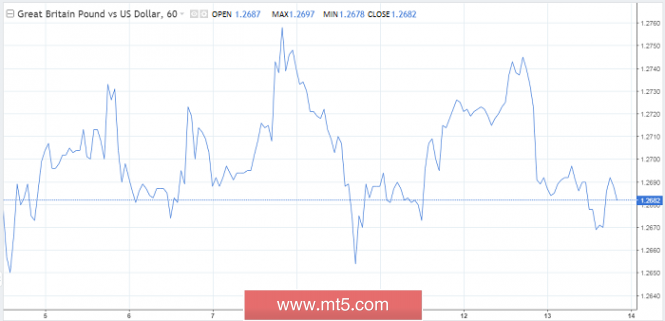
| Posted: 13 Jun 2019 05:09 PM PDT It's impossible to be one hundred percent certain, but it seems that Boris Johnson will take the lead in the Conservative Party and become the new British prime minister. You can move to a more positive outlook on the long-term prospects of the pound, if the situation starts to develop as it should. In other words, "cold heads" will prevail and controlled and civilized Brexit will occur. There is a lot of space for movement in front of the sterling. Speaking with a keynote speech today, the ex-British foreign secretary promised that the country would leave the European Union on October 31 with or without a deal. The politician stressed that he would seek a review of the previously agreed deal with the EU. In addition, he intends to begin preparing for the consequences of the "hard" scenario. The pound went down after such a portion of the negative, its course is reduced for the second day in a row due to heightened fears of an exit without an agreement. Thus, the GBP/USD pair is in the lower part of the trading range of this year. The weekly indicator of price fluctuations has grown the most since the beginning of the month, as traders expect an outcome in the struggle for leadership among Conservatives and the Fed's decision on the rate. In the near future, the pound will continue its flight down, since the market considers the exit without agreement as the most risky scenario for the economy of the UK and the country as a whole. This opinion is shared by most global strategists. Some are waiting for the fall of sterling paired with the dollar to the level of 1.10. "You should stay short in sterling," advise SocGen. Conservative lawmakers began voting for 10 contenders for their new Tory leader on Thursday at about 10 am in London. Boris Johnson received the greatest support in the first round. The second round is scheduled for June 18, followed by a vote on June 19 and 20, until two candidates remain. Then a postal bulletin with a broader membership in the Conservative Party is scheduled to select a leader. The material has been provided by InstaForex Company - www.instaforex.com |
| Swiss franc may be the main beneficiary of the new global crisis Posted: 13 Jun 2019 04:57 PM PDT Over the past month, the Swiss currency has risen by almost 2% against the US dollar, surpassing all other peers in the G10 group. "A downward turn in the global economy and riskier asset markets could lead to a dramatic and accelerated growth of the CHF," said Paul M., currency strategist at JPMorgan Chase. Now he expects the franc to strengthen to $0.95 (the highest level since March last year) compared with the previous target of $0.98. According to the analyst, the current account surplus in Switzerland, which is 10% of gross domestic product (which is three times more than Japan), makes the franc more reliable than the yen, a safe haven. "I admit that the Swiss National Bank (SNB) will try to restrain the growth of the franc. However, the regulator did not intervene and did not conduct foreign exchange interventions even during the Italian budget crisis last year, "said P. Meghesi. "Now the national currency is less controlled by the central bank than during most of the past decade. Entering the next global recession with reserves at the level of 120% probably means that the regulator should be more loyal to the fundamental reasons for the appreciation of the franc caused by fundamental reasons, unlike in the past situation when the central bank met the global financial crisis when foreign exchange reserves were less than 15 % Of GDP. The SNB arsenal may not be completely empty, but there are far fewer bullets than ever before," he added. The material has been provided by InstaForex Company - www.instaforex.com |
| EUR/USD. The three main problems of the euro: Italy, the ECB and Brexit Posted: 13 Jun 2019 04:34 PM PDT The euro paired with the dollar loses the positions it won in recent days. Buyers of eur/usd could not consolidate within the 13th figure, after which the pair headed towards the main support level of 1.1220 (the lower boundary of the Kumo cloud on the daily chart, coinciding with the bottom line of the Bollinger Bands indicator). Italy, the ECB and Brexit are the three main problems of the single currency, which almost reminded us of it on the daily. Today, the news background is full of events, but almost all information campaigns are negative for the euro. At the same time, the US currency is gradually recovering: the dollar index today has returned to the 97th figure, reflecting demand for the greenback across the entire market. This time, growth of anti-risk sentiment did not hurt the greenback and dollar bulls were able to take advantage of the situation. It is worth noting that, paired with the euro, the dollar can easily dominate, given the vulnerability of the single currency. Today, the Commissioner for Economic and Financial Affairs Pierre Moscovici reiterated that Brussels is ready to apply the disciplinary procedure against Italy, having fined it because of the growth of public debt. By and large, Moscovici made the "last China warning," but this time he added that Rome has not yet provided any real evidence of compliance with EU fiscal legislation. In turn, the Italian Finance Minister of Italy, Giovanni Tria, asked the Europeans not to rush to retaliatory measures. According to him, Rome will agree with Brussels on all controversial issues by July 9 and will convince the European Union that Italy will comply with the financial and budgetary goals set by the European Commission. According to some experts, such a long delay is related to the inconsistency within the coalition government of Italy. According to Italian media, the coalition is on the verge of a split: members of the League and the Five Stars movement are increasingly unable to find a common language, provoking political conflicts. Things reached the point that Italian Prime Minister Giuseppe Conte threatened with resignation if the members of the coalition did not start working in tandem. But it's one thing to coordinate issues related to domestic policy, and it's quite another to develop a common position in relations with Brussels. Anti-European slogans, on the wave of which populists came to power in Italy now play against them, being a barrier to compromise solutions. In other words, the Italian problem weighs on the euro, and mutual accusations from Rome and Brussels only increase the pressure on the European currency. News from Britain also does not bode well for the eur/usd bulls. According to the results of the first round of voting for the future leader of the Conservative Party, Boris Johnson won a crushing victory, as he received 114 points. Current British Foreign Secretary Jeremy Hunt ranked second with a significant margin: he scored only 43 votes. According to the results of the first round of voting, 7 out of 10 candidates received the necessary (minimal) support to continue their participation in the fight. Former head of the House of Commons Andrea Leeds, former Minister of Labor and Pensions Esther McVey and former Secretary of the Treasury Mark Harper dropped out of the race. They didn't get enough votes to go to the next round. The next round of voting will take place next week: then they will go in a similar format until there are only two candidates left. According to most observers, the name of the winner will be known from July 22 to 28. However, judging by the starting position of Johnson, one can say that he continues to be the favorite of the political struggle, whereas his closest competitor, Jeremy Hunt, is significantly inferior to him in popularity among party members. By the way, Dominic Raab was previously considered the main rival of Johnson, but now the top three look like this: Johnson, Hunt, Gove. Of these, only the latter defends the position of a long delay: in his opinion, Brexit should be postponed until the end of 2020 in order to re-negotiate with Brussels on the terms of the deal. But Johnson and Raab strongly oppose a delay, while admitting the implementation of a hard Brexit. In other words, the likelihood of a "chaotic" scenario is still high, since Brussels refuses not only to change the terms of the deal, but also to discuss the deal already agreed with the EU. The single currency, as a rule, responds only to key events regarding Brexit prospects. Today's primaries once again reminded traders of the relevance of this problem, and this fact has put significant pressure on eur/usd. From a technical point of view, the pair is in the area of the support level of 1.1280 (the upper limit of the Kumo cloud on the daily chart). If the bears push this level, the price will go to the main support level of 1.1220 (the lower boundary of the Kumo cloud on the daily chart, which coincides with the bottom line of the Bollinger Bands indicator). The material has been provided by InstaForex Company - www.instaforex.com |
| Posted: 13 Jun 2019 04:13 PM PDT The euro remained at its intraday low, ignoring the weak report on inflation in Germany, as well as the decline in industrial production in the eurozone, which clearly indicates a slowdown in economic growth in the 2nd quarter of this year. Considering that the euro ignores even such data, the scenario of a continuation of an upward trend is observed, but this requires a quick return to the intermediate resistance level of 1.1310, without which it will be extremely difficult to expect growth. According to the report, the rate of inflation in Germany slowed down in May of this year, which is another proof that the economy continues to lose momentum. The report indicates that in May 2019, compared with April, consumer prices rose by only 0.2%, which fully coincided with a preliminary estimate. The annual inflation rate was 2%, which suits the ECB. Harmonized by EU standards, Germany's consumer price index rose in May by 0.3% compared with April, and compared with May last year it increased only by 1.3%. The statistics bureau of Germany noted that the main pressure on inflation was created by a slower increase in tariffs for air and railway tickets, as well as lower prices for tourism, which is directly related to the calendar factor. The euro remained in its position after the release of data which indicated a decline in industrial production in the eurozone. According to the report, industrial production fell by 0.5% in April of this year compared with March, while economists had expected a decline of 0.4%. Compared to the same period in 2018, the decline was 0.4%, while the forecast was for a fall of 0.7%. The predominant decline in production is based on trade wars and lower exports, which also contributes negatively to various sectors of the economy. The euro held its ground, as many traders feared that the data would be even worse due to industrial production in Germany, which also dropped sharply. As for the technical picture of the EURUSD pair, support in the pair shifted to the area of 1.1280. As long as traders keep this level, we can expect the demand for risky assets to remain and the return of the trading instrument to a high of 1.1340 by the end of the week. If at the US session there is a break of support at 1.1280, the pressure in the pair will increase, which will lead to new local low in the area of 1.1250 and 1.1200. The British pound continued its decline after the leading candidate for the post of British prime minister, Boris Johnson, presented his plan to withdraw the country from the European Union by October 31. It discusses many options, including the UK exit without a deal. The former British Foreign Secretary announced that he intends to begin preparations throughout the country for the consequences of withdrawing without a deal if the EU does not accept the new conditions that he offers in the event of his victory. According to many experts, this position will make a serious negative contribution and damage the UK economy. As for the technical picture of the GBPUSD pair, trade remains in the wide side channel, where, on the one hand, there is support around 1.2650, and on the other hand, the upward potential is limited by this week's highs around 1.2760. Only going beyond these ranges will determine the future direction of the British pound in the short term. The material has been provided by InstaForex Company - www.instaforex.com |
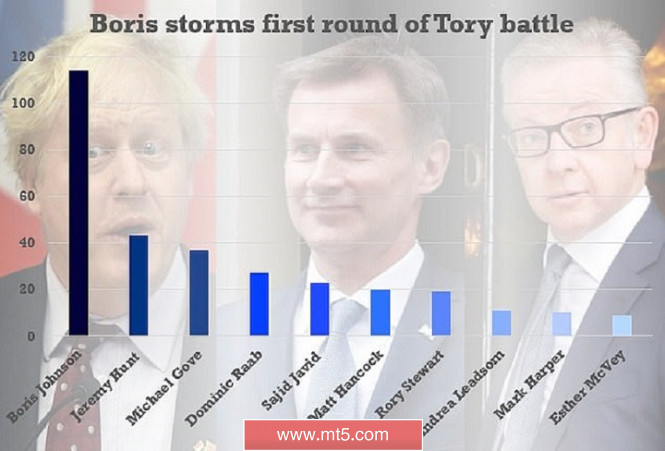
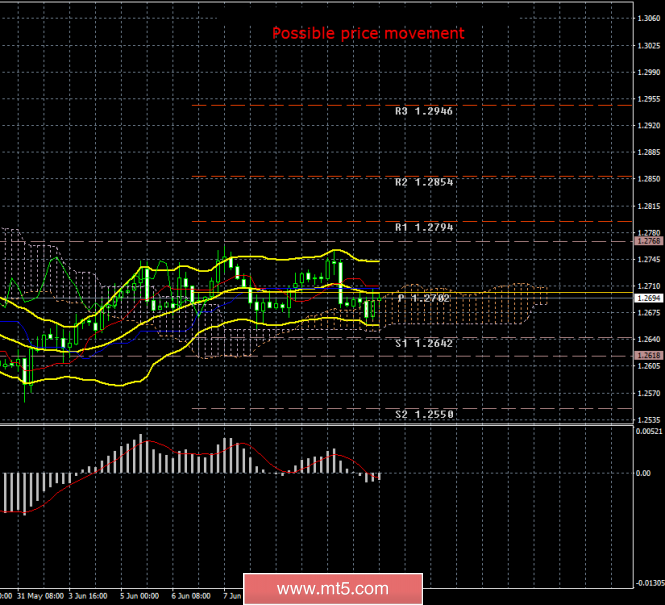
| Posted: 13 Jun 2019 03:58 PM PDT 4-hour timeframe The amplitude of the last 5 days (high-low): 73p - 74p - 89p - 62p - 77p. Average amplitude for the last 5 days: 75p (73p). Boris Johnson won the first round of voting for the future leader of the Conservative Party after Theresa May left. Out of 313 possible votes, Boris Johnson scored 114. The closest competitors Jeremy Hunt and Michael Gove scored 43 and 37 votes. Three out of ten candidates for the post left the race, seven went to the second round. Only two applicants should remain until June 20, after which the entire Conservative Party will vote for one candidate or another, not just the Tory deputies of the House of Commons. It is difficult to say whether this is good news for the pound or something bad. Traders did not respond to the election results in the first round. Moreover, the pound/dollar pair frankly went to the side channel, which displays the indicator Bollinger Bands. Now the pair is at the bottom of the side channel. According to the logic of things, in the event of a rebound from it, it will rise to the upper Bollinger band. No other important news for the pound sterling or the US dollar was received at the disposal of traders today. Thus, sluggish and inactive trading in a currency pair is expected. As for the future of Brexit, even with the hypothetical victory of Boris Johnson in the elections, the situation is not clear. The new prime minister will have the same choice as Theresa May: "hard" Brexit or an agreement with the EU. True, Johnson wants new negotiations with Brussels, but Brussels himself has to take this step, who has already officially declared his unwillingness to revise the agreement reached with Theresa May. Thus, Johnson may want a lot, the European Union must go to meet him in order to fulfill his wishes. Trading recommendations: The pound/dollar currency pair returned to the area below the Kijun-sen line, and Bollinger bands signal a flat at all. Therefore, we recommend not to trade on the pair until the end of the sideways movement. In addition to the technical picture should also take into account the fundamental data and the time of their release. Explanation of the illustration: Ichimoku indicator: Tenkan-sen - the red line. Kijun-sen - the blue line. Senkou Span A - light brown dotted line. Senkou Span B - light purple dotted line. Chikou Span - green line. Bollinger Bands indicator: 3 yellow lines. MACD Indicator: Red line and histogram with white bars in the indicator window. The material has been provided by InstaForex Company - www.instaforex.com |
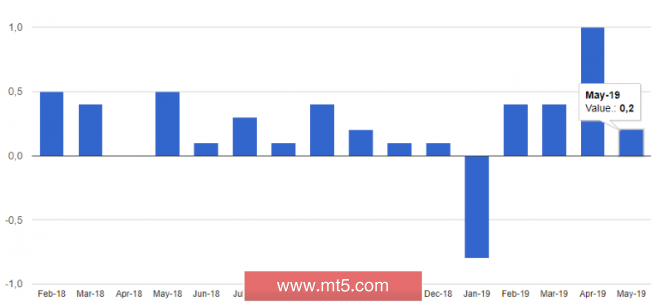
| EUR/USD. June 13th Results of the day. Industrial production in the euro area fell by 0.4% Posted: 13 Jun 2019 03:39 PM PDT 4-hour timeframe The amplitude of the last 5 days (high-low): 108p - 97p - 41p - 37p - 61p. Average amplitude for the last 5 days: 69p (74p). The penultimate trading day of the week for the EUR/USD pair is in a downward movement, but in a rather weak one. The only important macroeconomic report of the day - industrial production in the EU in April - showed a decrease of 0.4% y/y and 0.5% m/m. Thus, traders do not find grounds for new purchases of the European currency at this time. What is happening now is what should have been expected. The block of disappointing macroeconomic information from the US significantly helped the euro, but when the weaker news from the EU began to come out, the single currency began to experience market pressure on itself. Now the market can return to the popular topic in recent weeks that is the "Fed rate". According to many experts, the Fed will decide to ease monetary policy at its next meeting. However, we believe that the rate cut is unlikely to happen so quickly. First, despite the decline in GDP and other economic indicators, the US economy still feels quite well and stable. Secondly, in the confrontation with the euro, the dollar still takes a more advantageous position due to the same rates, which now differ by 2.5%. Thirdly, the ECB is now also holding a "dovish" position, and is also thinking about a possible easing of monetary policy and stimulation of the economy. Thus, a reduction in the ECB rate is also possible. Based on the foregoing, the conclusion is that no matter how the US economy slows down, it is still in a better state than the EU economy. For this reason, we believe that the strengthening of the euro was of a short-term nature, and the bears on the euro/dollar pair can be activated in the near future. Trading recommendations: The EUR/USD overcame the critical line and may resume the downward trend. Thus, it is now recommended to sell the euro in small lots with a target of 1.1212. The "dead cross" signal can be formed in the next few hours. It will be possible to buy the euro/dollar pair again if the bulls manage to return above the critical line, with the goals of 1.1341 and 1.1400. In this case, the initiative for the pair will return to the bulls. In addition to the technical picture, you should also consider the fundamental data and the time of their release. Explanation of the illustration: Ichimoku indicator: Tenkan-sen - the red line. Kijun-sen - the blue line. Senkou Span A - light brown dotted line. Senkou Span B - light purple dotted line. Chikou Span - green line. Bollinger Bands indicator: 3 yellow lines. MACD Indicator: Red line and histogram with white bars in the indicator window. The material has been provided by InstaForex Company - www.instaforex.com |
| June 13, 2019 : EUR/USD Intraday technical analysis and trade recommendations. Posted: 13 Jun 2019 10:09 AM PDT
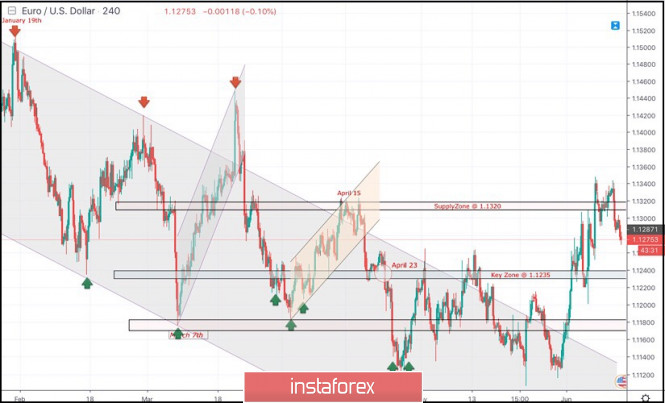
Since January 19th, the EURUSD pair has been moving within the depicted channel with slight bearish tendency. For Intraday traders, the price zone around 1.1235 stood as a temporary demand area which paused the ongoing bearish momentum for a while before bearish breakdown could be executed on April 23. Short-term outlook turned to become bearish towards 1.1175 (a previous weekly bottom which has been holding prices above for a while) On the period between May 17th and 20th, a bearish breakdown below 1.1175 was temporarily achieved. As expected, further bearish decline was expected towards 1.1115 where significant bullish recovery was demonstrated bringing the EUR/USD pair back above 1.1175. Recently, The EURUSD pair has maintained bullish persistence above the highlighted price levels (1.1175) and (1.1235). That's why, further bullish advancement was expected towards 1.1320 which failed to apply instant bearish pressure on the EURUSD pair on the previous Friday. That's why, Temporary Bullish breakout above 1.1320 was demonstrated earlier this week, rendering it a newly-established demand level. However, Yesterday, The pair failed to maintain Bullish persistence above 1.1320 demonstrating a bearish engulfing H4 candlestick. This will probably allow another bearish pullback to occur towards 1.1235 where recent price action should be considered. The material has been provided by InstaForex Company - www.instaforex.com |
| June 13, 2019 : GBP/USD Intraday technical analysis and trade recommendations. Posted: 13 Jun 2019 09:28 AM PDT
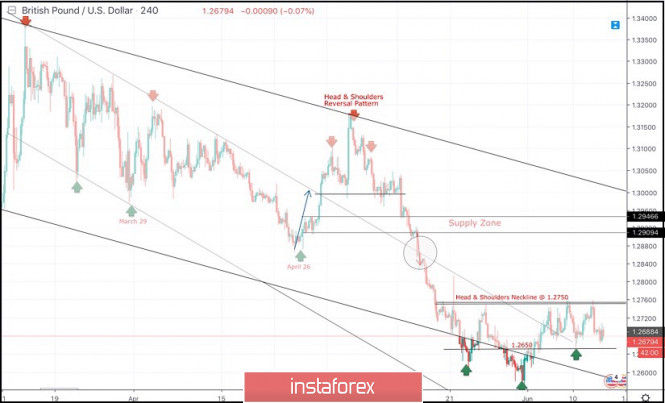
On March 29, a visit towards the price levels of 1.2980 (the lower limit of the newly-established bearish movement channel) could bring the GBPUSD pair again towards the upper limit of the minor bearish channel around (1.3160-1.3180). Since then, Short-term outlook has turned into bearish with intermediate-term bearish targets projected towards 1.2900 and 1.2850. On April 26, another bullish pullback was initiated towards the price zone of 1.3130-1.3170 where the depicted bearish Head and Shoulders reversal pattern was demonstrated on the H4 chart with neckline located around 1.2980-1.3020. Hence, Bearish breakdown below 1.2980 allowed the recent significant bearish movement to occur. Initial bearish Targets were already reached around 1.2900-1.2870 (the backside of the broken channel) which failed to provide any bullish support for the GBPUSD pair. Further bearish decline was demonstrated towards the lower limit of the long-term channel around (1.2700-1.2650) where the GBPUSD pair looked oversold obviously. That's why conservative traders were suggested NOT to consider any SELL signals around those low price levels. As anticipated, bullish breakout above 1.2650 has already been achieved. This enhanced the bullish side of the market towards 1.2750 which is preventing further bullish advancement until now. Recently, the price level of 1.2650 stood as a prominent demand level offering a valid BUY entry (demonstrating the right shoulder of a bullish Head & Shoulders reversal pattern). For the bulls to regain dominance, another bullish breakout above 1.2750 is needed to extend potential bullish targets towards 1.2800, 1.2890 and 1.2940 if sufficient bullish momentum is demonstrated. On the other hand, any bearish breakout below 1.2650 invalidates the mentioned bullish scenario. Trade Recommendations: For Intraday traders, A valid BUY entry can be offered upon bullish breakout above 1.2750. T/P levels to be located around 1.2820, 1.2900 and 1.2940. S/L should be placed below 1.2690. Conservative traders should wait for an extensive bullish movement towards 1.2870-1.2905 (newly-established supply zone) to look for valid long-term SELL entries. S/L should be placed above 1.2950. The material has been provided by InstaForex Company - www.instaforex.com |
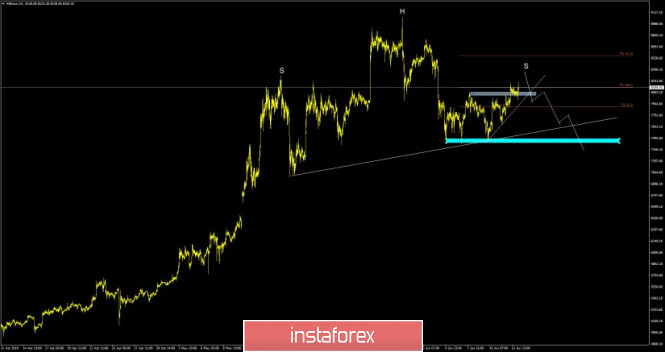
| Bitcoin analysis for June, 13.2019 Posted: 13 Jun 2019 08:45 AM PDT BTC has been trading upwards but if found resistance at the price of $8.240. The big head and shoulders pattern is in creation and you should watch for potential down break for selling opportunities.
Gray rectangle – Resistance became support $8.080 Blue rectangle – Important support $7.410 White upward trendline – Short term support We found head and shoulders pattern in creation, which his indication of potential toping activity. Our advice is to watch for potential breakout of the upward trendline to confirm short-term downward movement and then watch for potential breakout of the key neckline to confirm head and shoulders pattern. Important support is set at the price of $7.415. As long as the swing high at $9.067is not broken, we will watch for selling opportunities. The material has been provided by InstaForex Company - www.instaforex.com |
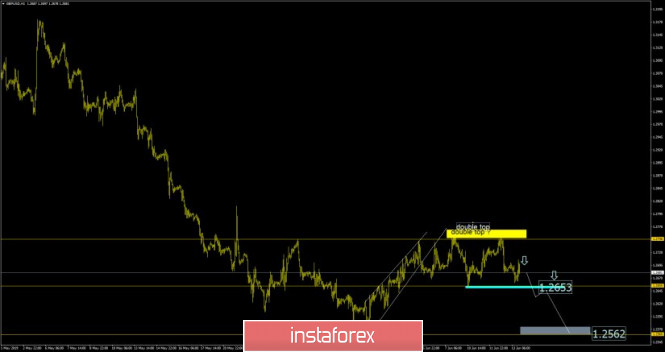
| GBP/USD analysis for June 13,.2019 Posted: 13 Jun 2019 08:00 AM PDT GBP/USD has been trading downwards today. The price tested and rejected from the key resistance at 1.2746, which is strong sign of the reversal and new downward momentum on the GPB.
Yellow rectangle – Resistance (1.2746) Blue rectangle – Support 1 (1.2653) Gray rectangle – Support 2 (1.2562) GBP/USD made potential double top formation and we found strong rejection of the resistance 1.2746, which is for us strong sign of further GBP weakness. Important support for the GBP is set at 1.2653 and the breakout of this level would confirm potential double top formation completion, which will bring us more downward movement. If you see the breakout of 1.2653, watch for second downward target at 1.2652. Key short term resistance is set at the price of 1.276. Watch for selling opportunities on the rallies. The material has been provided by InstaForex Company - www.instaforex.com |
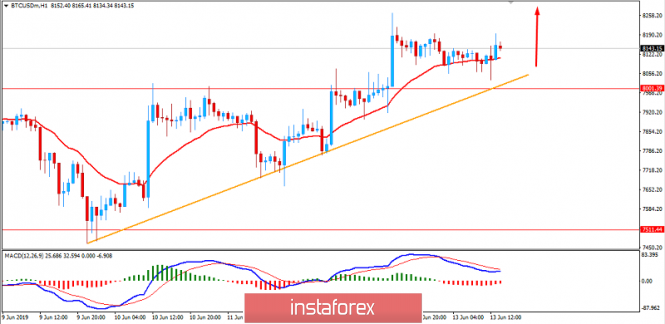
| BITCOIN consolidating above $8,000 to climb higher? June 13, 2019 Posted: 13 Jun 2019 07:51 AM PDT Bitcoin has been consolidating above $8,000 for a few hours now after climbing above the area under strong impulsive bullish momentum. The price managed to extend a steady climb having confluence of dynamic levels. It has been a perfect start for crypto currency investors. Recording double-digit gains over the last two quarters, Bitcoin stands out against other crypto currencies. BTC price has surged almost twice in the recent 12 months. Despite the persistent trade war, BTC investors are optimistic. The trade war between China and the United States has only worsened over recent weeks. Analysts proved that the start of the political dispute was not correlated with early April's Bitcoin boom and the subsequent rally. Nevertheless, some believe that because of the conflict, investors in Asia are looking to stock up on BTC. Bitcoin is not seen as a correlated asset to the S&P 500. However, some analysts are sure that allocating capital to the Cryptocurrency, especially during this volatile trade war, is only logical. Meanwhile, the price is being held by the dynamic level of 20 EMA trading above $8,000 while MACD is showing a bullish crossover above the zero level. The price has also formed a proper Elliott Wave formation while forming a wave 4 correction which is expected to lead to $9,000 by wave 5 formation. As the price remains above $8,000 with a daily close, the bullish bias is expected to continue. SUPPORT: 7,500, 7,800, 8,000 RESISTANCE: 8,400, 8,500, 9,000 BIAS: BULLISH MOMENTUM: VOLATILE
|
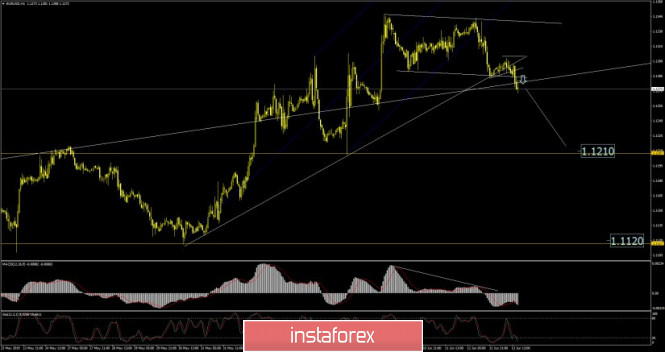
| EUR/USD analysis for June 13,2019 Posted: 13 Jun 2019 07:48 AM PDT EUR/USD has been trading downwards today. The price tested the level of 1.1268. We found the breakout of the important support trend lines in the background, which is sign that we may see further lower price on EUR.
Yellow line 1 - horizontal support 1 (1.1210) Yellow line 2- horizontal support 2 (1.1120) White line – Broken support trendline Blue lines – Broken upward channel in the background There are breaks today of the important support trendlines in the background, which is for us sign that selling looks good. Most recently, we found the breakout of the intraday bear flag on the H1 time-frame, which is good confirmation that sellers are in control on the EUR/USD.The MACD oscillator is showin us continuation of the downward momentum and you should watch for selling opportunities with the targets at 1.1210 and 1.1120. Key short-term resistance is set at the price of 1.1302. The material has been provided by InstaForex Company - www.instaforex.com |
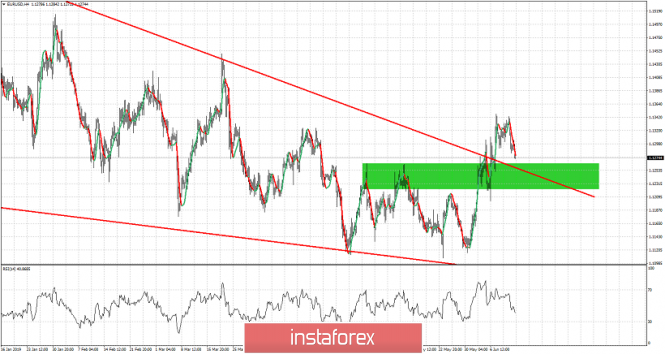
| Technical analysis of EURUSD for June 14, 2019 Posted: 13 Jun 2019 07:00 AM PDT EURUSD is pulling back as expected from our latest posts. Price remains above key support and trend remains bullish as long as price remains above 1.12-1.1250.
Red lines - bullish wedge Green rectangle - support area EURUSD is pulling back towards the green support area and the upward wedge boundary. So far this could be considered a normal and wanted pull back for the bullish momentum to gather more power for the next leg higher. Bulls expect price to enter the green area and even touch the upper wedge boundary and after that bounce strongly higher. If price breaks below 1.12 and stays below 1.1250, bears will be taking over the short-term trend. The material has been provided by InstaForex Company - www.instaforex.com |
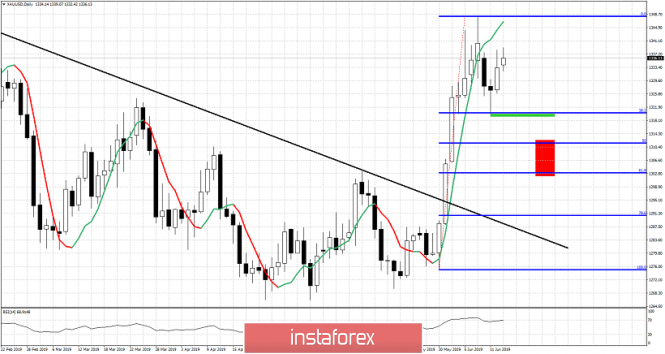
| Technical analysis of Gold for June 14, 2019 Posted: 13 Jun 2019 06:55 AM PDT Gold price has bounced off the 38% Fibonacci retracement support area but it looks like bulls are not strong enough to recapture the major resistance trend level at $1,350. This rejection if followed by a move below $1,320 could lead to a sharp decline towards $1,300.
Green rectangle - support Red rectangle - target if support fails to hold Gold price should move towards the red rectangle target area if support at the green rectangle fails to hold. $1,300 is a major support area. Even if we break below $1,320, bulls will continue to hope for a higher low and an upward reversal. If $1,300 is lost then this would be a bearish sign for the medium-term trend. Until then bulls hope for this pull back to be shallow and short-lived. Breaking above $1,348-50 would give us a bullish sign. The material has been provided by InstaForex Company - www.instaforex.com |
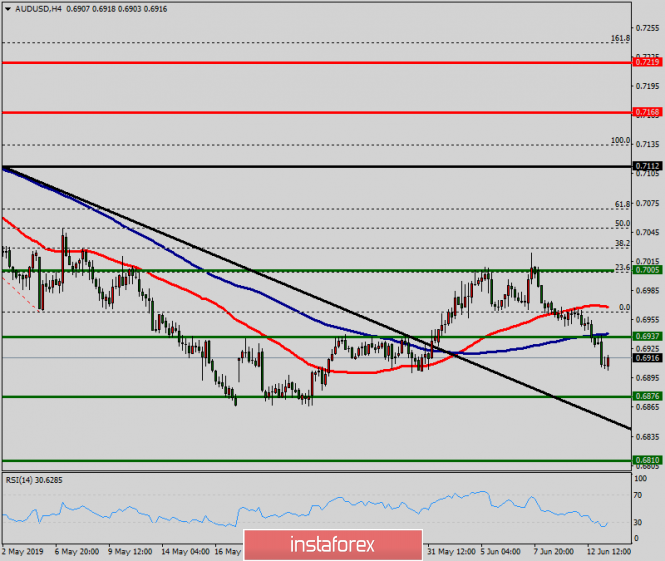
| Technical analysis of AUD/USD for May 13, 2019 Posted: 13 Jun 2019 05:55 AM PDT Overview: The AUD/USD pair is set above strong support at the levels of 0.6937 and 0.6980. This support has been rejected four times confirming the uptrend. The major support is seen at the level of 0.6937, because the trend is still showing strength above it. Accordingly, the pair is still in the uptrend in the area of 0.6937 and 0.6980. The AUD/USD pair is trading in the bullish trend from the last support line of 0.6937 towards thae first resistance level of 0.7000 in order to test it. This is confirmed by the RSI indicator signaling that we are still in the bullish trending market. Now, the pair is likely to begin an ascending movement to the point of 0.7000 and further to the level of 0.7112. The level of 0.7112 will act as the major resistance and the double top is already set at the point of 0.7112. At the same time, if there is a breakout at the support levels of 0.6937 and 0.6980, this scenario may be invalidated. The material has been provided by InstaForex Company - www.instaforex.com |
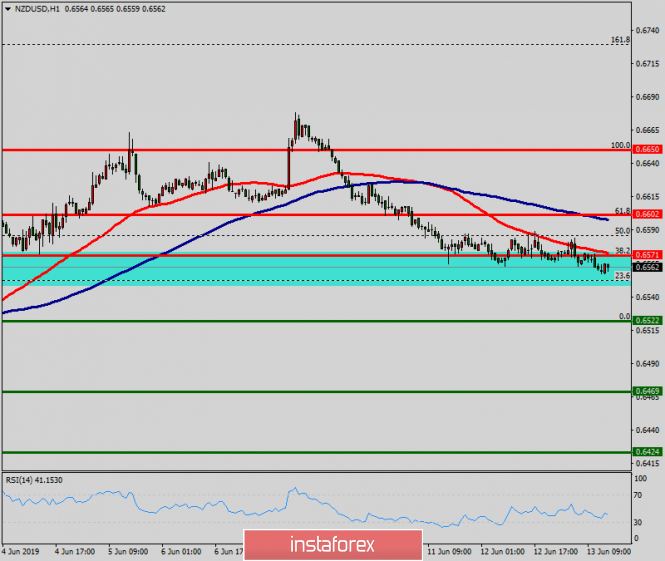
| Technical analysis of NZD/USD for May 13, 2019 Posted: 13 Jun 2019 05:48 AM PDT The NZD/USD pair is showing signs of weakness following a breakout of the lowest level of 0.6571. On the H1 chart, the level of 0.6571 coincides with 38.2% of Fibonacci, which is expected to act as minor resistance today. Since the trend is below the 38.2% Fibonacci level, the market is still in a downtrend. However, the resistance is seen at the level of 0.6571. Furthermore, the trend is still showing strength above the moving average (100). Thus, the market is indicating a bearish opportunity below the above-mentioned support levels, for that the bearish outlook remains the same as long as the 100 EMA is headed to the downside. Therefore, resistance will be found at the level of 0.6571 providing a clear signal to buy with a target seen at 0.6500. If the trend breaks the first supprt at 0.6500, the pair is likely to move downwards continuing the bearish trend development to the levels 0.6469 and 0.6424. The material has been provided by InstaForex Company - www.instaforex.com |
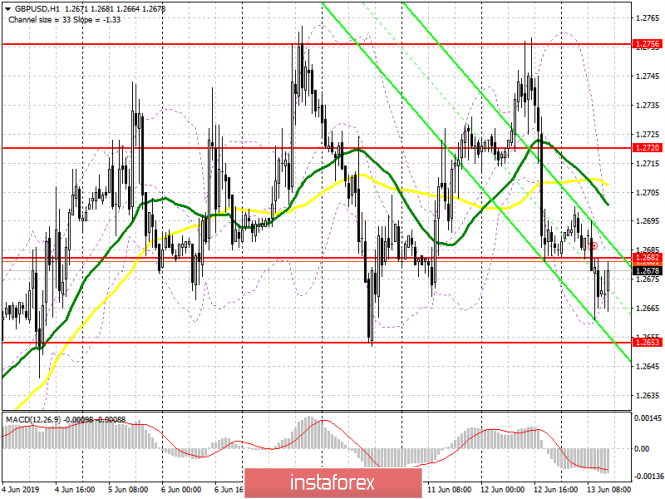
| GBP/USD: plan for the US session on June 13. The pound remains in the wide side channel Posted: 13 Jun 2019 05:38 AM PDT To open long positions on GBP/USD, you need: Despite the fact that the buyers of the pound missed the support level of 1.2682, while trading is above the minimum of 1.2653, it would be wrong to talk about the continuation of the downward trend. The main task of the bulls for the second half of the day is to return to the resistance of 1.2682, which will lead to an update of the highs in the area of 1.2720 and 1.2756, where I recommend taking the profit. With a further decline in GBP/USD, buyers will try to form a false breakout at a minimum of 1.2653. In another scenario, it is best to open long positions on the rebound from the minimum of 1.2617. To open short positions on GBP/USD, you need: Sellers of the pound will try to keep the pair below the resistance of 1.2682, and an unsuccessful consolidation at this level in the second half of the day will be a signal to open short positions in order to reduce to the low of 1.2653 with the update of the area of 1.2617, which will indicate the formation of a new downward trend in the market. In the case of growth above 1.2682 in the second half of the day, it is best to look at short positions on the rebound from the maximum of 1.2720 or from a larger resistance of 1.276. Indicator signals: Moving Averages Trading is below 30 and 50 moving averages, which indicates a possible continuation of the pair's decline. Bollinger Bands In case of the pound growth in the second half of the day, the upper limit of the indicator in the area of 1.2700 will act as a resistance.
Description of indicators
|
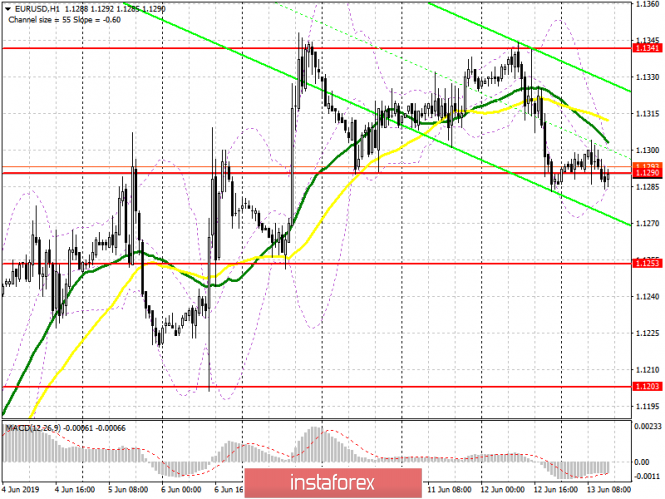
| Posted: 13 Jun 2019 05:38 AM PDT To open long positions on EURUSD, you need: Weak data on industrial production did not surprise traders, which did not allow to maintain the downward trend in the pair. At the moment, trading is conducted around the level of 1.1290, and it will depend on the further direction of movement. A false break was formed, but there is no serious demand for the euro. The main goal of buyers is to update the weekly high in the area of 1.1341, where I recommend taking the profit. In the case of maintaining pressure on the euro and falling under the support of 1.1290 in the second half of the day, it is best to consider long positions on the rebound from the low of 1.1253. To open short positions on EURUSD, you need: At the North American session, the bears will try to break below the support of 1.1290, the breakdown of which will be a signal to open short positions in the euro. Good data on the US labor market can help the EUR/USD to resume the downward trend, which will lead to an update of the lows of 1.1253 and 1.1203, where I recommend taking the profit. If in the second half of the day, the euro resumes growth, it is best to consider short positions to rebound from a weekly high around 1.1341. Indicator signals: Moving Averages Trading is conducted in the area of 30 and 50 moving averages, which indicates the uncertainty of the market with a further direction. Bollinger Bands Volatility has dropped sharply, which does not give signals to enter the market.
Description of indicators
|
| Posted: 13 Jun 2019 05:30 AM PDT US President Donald Trump can boast that trade tariffs bring additional funds to the country, but they do not seem to save the US budget from increasing the deficit. For 8 months of the fiscal year (started on October 1, 2018), the negative balance expanded by 38.8% or $206 billion in annual terms. At the same time, revenues from import duties rose by almost 2 times to $44.9 billion. The White House hoped that the GDP growth would remain at 3%, thanks to tax cuts, but the US economy is slowing. From how quickly it will lose speed, apparently, it will depend on the next steps of the Fed and the fate of the greenback. In January, the American Central Bank announced that it could adjust its monetary policy and pause the rate increase process. In March, the regulator announced plans to curtail the balance reduction program in force since 2017 and when the markets collapsed by $5 trillion in May, it signaled its readiness to support the country's economy with stimulating measures. At the moment, the derivatives market is 97.5% sure of one act of monetary expansion by the Fed this year and 82% in two. Meanwhile, a consensus forecast of more than 100 economists recently surveyed by Reuters suggests that the Federal Reserve will not ease monetary policy easing before the third quarter of 2020. According to experts, since the US GDP from an abnormally high value of + 2.9% is returning to its normal growth rate of 2%, then there is not much point in reducing the federal funds rate. The USD index dropped to its lowest levels in two months against the background of an increase in the likelihood of a Fed rate cut and increased fears for the fate of the American economy. If the chances of maintaining the current parameters of the monetary rate of the Fed begin to grow, it is assumed that the greenback will come to its senses rather quickly. According to Deutsche Bank experts, the derivatives market can be seriously mistaken about the future trajectory of the federal funds rate, which deprives the EUR/USD "bulls" an important advantage. It is no secret that the difference in interest rates and relative to the profitability of assets in dollars and euros are some of the key factors for the foreign exchange market. The inability of the euro bulls to storm the resistance level of $ 1.1345 has once again proved that the weakness of the dollar alone may not be enough to restore the long-term upward trend of EUR / USD. It is expected that before the Fed meeting, which will take place next week and at which the regulator may shed light on its future actions, the EUR / USD pair will consolidate in the range of 1.1255-1.1345. The inability of the euro bulls to storm the resistance level of $1.1345 has once again proved that the weakness of the dollar alone may not be enough to restore the long-term upward trend of the EUR/USD pair. The EUR / USD pair is expected to consolidate in the range of 1.1255-1.1345 before the Fed meeting, which will take place next week and at which the regulator may shed light on its future actions. The material has been provided by InstaForex Company - www.instaforex.com |
| AUD / USD: Aussie declines due to labor market data and Hong Kong events Posted: 13 Jun 2019 04:52 AM PDT The Australian dollar, paired with the US currency, has been trying to return to the 70th figure for the second week. At the end of last week, the AUD/USD bulls managed to reach the local price peak of 0.7025at the end of last week against the background of a weak report on the US labor market. However, the bears rather quickly seized the initiative and returned the Aussie to their previous positions. The psychologically important level of 0.7000 is a key price outpost for traders. This level held back the onslaught of sellers for months but now, the inverse function performs, which keeps the buyers in the area of 69-69 figures. At first glance, good data on the labor market also did not impress the members of the Australian regulator. First, the unemployment rate remained at 5.2% contrary to the expectations of most experts, while the consensus forecast suggested a decline to 5.1%.On the one hand, the increase in the number of employees showed a positive trend as it jumped to 42 thousand with a growth forecast of 16 thousand. However, the structure of this indicator indicates the prematurity of optimistic conclusions. The fact is that employment growth in May was almost entirely due to part-time hiring but full employment has grown negligible only to 2.5 thousand, continuing the negative trend. This factor adversely affects the dynamics of wage growth as full-time positions offer higher wages and a higher level of social security. Not surprisingly, the level of consumer confidence in Australia has a strong downward trend against the background of weak wage growth rates. Let me remind you that at the last meeting, the Reserve Bank of Australia lowered the interest rate by 25 basis points. The Australian dollar then ignored this fact or to be more precise, this event was already taken into account in the prices. Yet, traders are still wondering whether the Australian regulator intends to continue on the path of easing monetary policy or could this be considered a warning signal. Here, expert opinions are divided. Most of them believe that the Australian Central Bank is not only ready to cut rates further. But most likely, it will carry out these intentions already at the July meeting. The probability of such a step is estimated at 70-75%. According to supporters of the "dovish" position, many factors contribute to the mitigation of monetary policy parameters including a low consumer activity, the situation in the housing market, and a slowdown in inflation amid a slowdown in GDP growth. In addition, the general situation is aggravated by the US trade war with China, on which Australia is quite economically dependent. However, supporters of the low profile of the RBA assure traders that the Australian regulator will resort to one more round of rate cuts only if, firstly, the trade war gets its active continuation after the G20. Secondly, if the key economic indicators Australia will be lower than expected values by the end of the year. In this case, according to analysts, the RBA will lower the rate either in December or in early 2020. Today's release has reinforced investors' concerns that the Australian Central Bank will resort to another rate cut next month. This fact puts pressure on the AUD/USD pair, after which, the price again moved away from the key mark of 0.7000 to the base of the 69th figure. In addition, other fundamental factors put pressure on the Aussie. The growth of anti-risk sentiment was due to both the events in Hong Kong and the ongoing trade confrontation between the United States and China. Yesterday, there were serious clashes between protesters and law enforcement officials on the streets of Hong Kong. Protesters called for an immediate end to the consideration of amendments to the law on the extradition of suspects, which would allow Hong Kong to extradite suspects to jurisdictions with which it does not have an extradition agreement including Taiwan, Macau and mainland China. According to the protesters, this rule of law will become a threat to those activists who disagree with official Beijing's policies. It should be noted here that Hong Kong is considered as the financial capital of Asia. Therefore, such a serious confrontation in the largest financial center of the world had a corresponding impact on the market. The demand for safe harbor instruments has increased, while risky assets, were among the outsiders, including the Australian dollar. Thus, the AUD/USD pair has the potential for a local decline to the price minimum of the year at the support level of 0.6860, which coincides with the bottom line of the Bollinger Bands indicator on the daily chart. In my opinion, the downward dynamics of "Aussie" will be more modest and will stop at the base of the 69th figure. The material has been provided by InstaForex Company - www.instaforex.com |


| You are subscribed to email updates from Forex analysis review. To stop receiving these emails, you may unsubscribe now. | Email delivery powered by Google |
| Google, 1600 Amphitheatre Parkway, Mountain View, CA 94043, United States | |
No comments:
Post a Comment