
Forex analysis review |
- Fractal analysis of major currency pairs for June 25
- The pound is aiming for $1.29
- EUR / USD h4 vs USD / JPY h4 vs EUR / JPY. Comprehensive analysis of movement options from June 25, 2019. Analysis of APLs
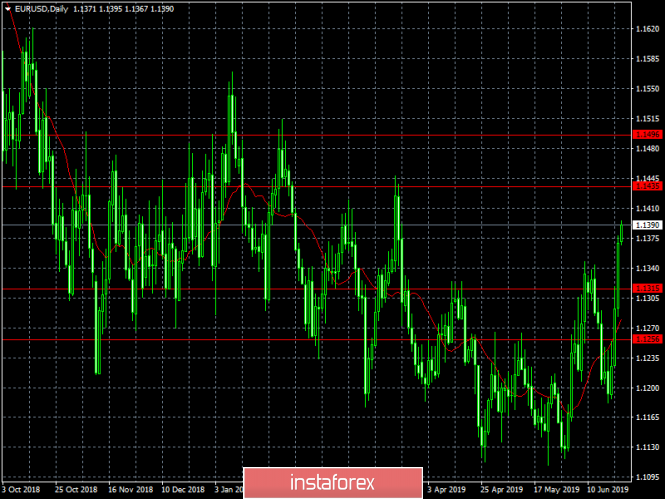
- EUR/USD: Exit above $1.14 will trigger a pullback
- Golden Rush: the price of the yellow metal exceeded $1,400
- GBP/USD. A family scandal lowered Johnson's rating and supported the British currency
- GBP/USD. June 24. Results of the day. The US dollar managed to win back some of the previously lost positions against the
- EUR/USD. June 24. Results of the day. Trade negotiations between Washington and Beijing continue. To no avail
- Yen puts the Bank of Japan
- What was it? (weekly review of EUR/USD and GBP/USD from 06/24/2019)
- June 24, 2019 : EUR/USD may demonstrate a bearish pullback towards 1.1340.
- June 24, 2019
- BTC 06.21.2019 - Cosolidation
- Gold 06.20.2019 - Big domination of bulls continues
- June 24, 2019 : Bullish breakout above 1.2750 is anticipated for the GBP/USD.
- GBP/USD analysis for June 24,.2019
- The dollar began to recover on the eve of the G20 summit
- Gold price could reach $1,440-45 before a meaningful pull back
- EURUSD short-term overbought
- EURUSD: Euro buyers were not scared by the weak report from Ifo, but the growth potential is limited
- GBP/USD: plan for the American session on June 24. Pound buyers will continue to make corrections
- EUR/USD: plan for the American session on June 24. 1.1395 at buyers' eye, but what to do next?
- Technical analysis of AUD/USD for June 23, 2019
- Technical analysis of USD/CAD for June 23, 2019
- BITCOIN settles above $10,500 area. June 24, 2019
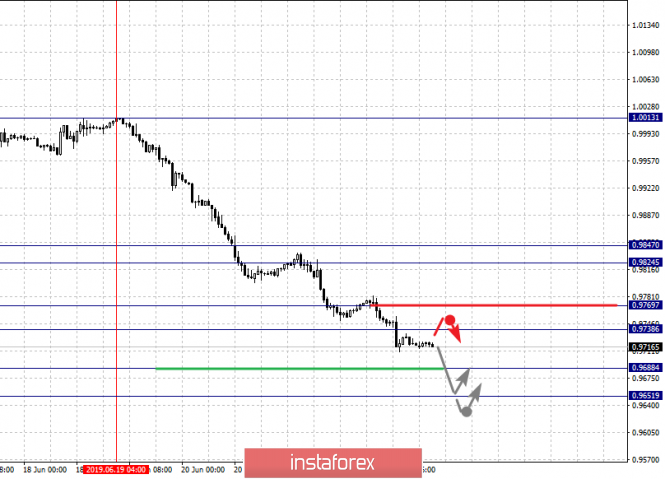
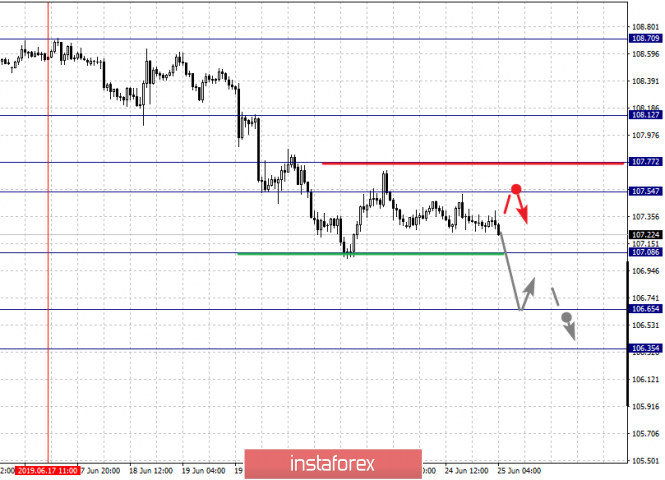
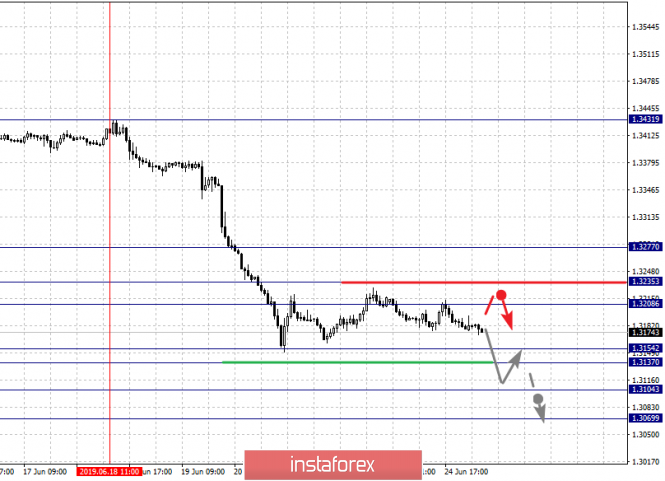
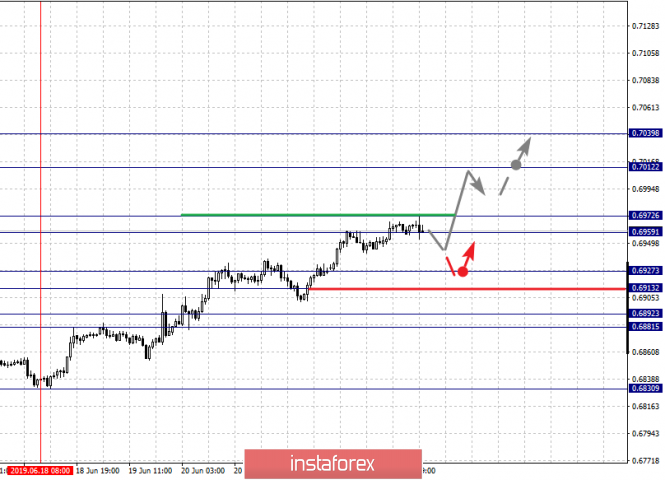
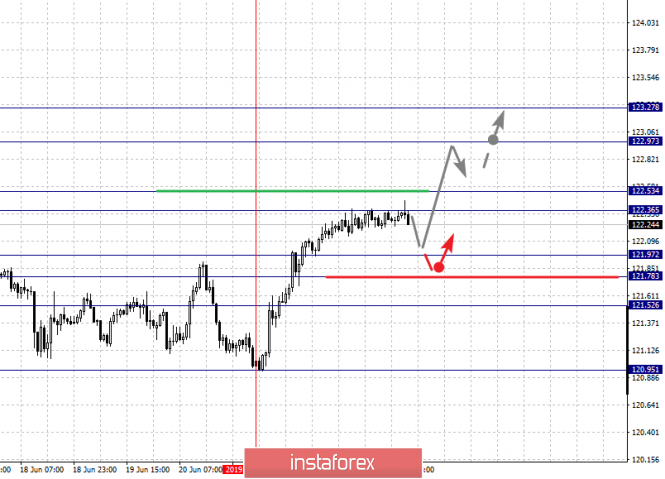
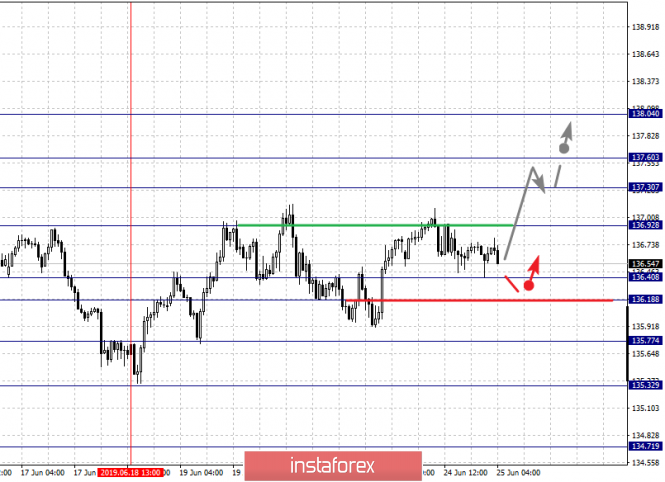
| Fractal analysis of major currency pairs for June 25 Posted: 24 Jun 2019 06:48 PM PDT Forecast for June 25: Analytical review of H1-scale currency pairs: For the euro / dollar pair, the key levels on the H1 scale are: 1.1452, 1.1428, 1.1404, 1.1388, 1.1353, 1.1334 and 1.1305. Here, we continue to follow the development of the ascending structure of June 18. The continuation of the movement to the top is expected after the passage of the price of the noise range 1.1388 - 1.1404. In this case, the target is 1.1428, wherein consolidation is near this level. For the potential value for the top, we consider the level of 1.1452. After reaching which, we expect a departure to the correction. Short-term downward movement is possible in the range of 1.1353 - 1.1334. The breakdown of the latter value will lead to in-depth correction. Here, the goal is 1.1305. This level is a key support for the top. The main trend is the ascending structure of June 18. Trading recommendations: Buy 1.1405 Take profit: 1.1428 Buy 1.1430 Take profit: 1.1452 Sell: 1.1353 Take profit: 1.1335 Sell: 1.1332 Take profit: 1.1305 For the pound / dollar pair, the key levels on the H1 scale are: 1.2906, 1.2842, 1.2798, 1.2713, 1.2688, 1.2636 and 1.2608. Here, we are following the development of the ascending structure of June 18. At the moment, we expect a movement to the level of 1.2798. Short-term upward movement is possible in the range 1.2798 - 1.2842. The breakdown of the latter value will lead to movement to the potential target - 1.2906. Upon reaching this level, we expect a rollback to the bottom. Short-term downward movement is expected in the range of 1.2713 - 1.2688. The breakdown of the last value will lead to a prolonged correction. Here, the target is 1.2636. The range of 1.2636 - 1.2608 is a key support for the top. The main trend is the ascending structure of June 18. Trading recommendations: Buy: 1.2798 Take profit: 1.2840 Buy: 1.2844 Take profit: 1.2904 Sell: 1.2713 Take profit: 1.2688 Sell: 1.2685 Take profit: 1.2636 For the dollar / franc pair, the key levels on the H1 scale are: 0.9847, 0.9824, 0.9769, 0.9738, 0.9688 and 0.9651. Here, we are following the development of the downward cycle of June 19th. The continuation of the movement to the bottom is expected after the breakdown of the level of 0.9688. Here, the potential target is 0.9651. From the range of 0.9688 - 0.9651, we expect to go to the correction zone. Short-term upward trend is possible in the range of 0.9738 - 0.9769. The breakdown of the latter value will lead to the development of a protracted correction. Here, the goal is 0.9824. The range 0.9824 - 0.9847 is a key support for the downward structure. Before it, we expect the initial conditions for the upward cycle. The main trend is the downward cycle of June 19. Trading recommendations: Buy : 0.9738 Take profit: 0.9767 Buy : 0.9773 Take profit: 0.9824 Sell: 0.9686 Take profit: 0.9653 For the dollar / yen pair, the key levels on the scale are : 108.12, 107.77, 107.54, 107.08, 106.65 and 106.35. Here, the downward structure of June 17 is considered as a medium-term initial conditions. The continuation of the movement to the bottom is expected after the breakdown of the level of 107.08. Here, the goal is 106.65. For the potential value for the bottom, we still consider the level of 106.35. After reaching which, we expect to go into a correction. Short-term upward movement is possible in the range of 107.54 - 107.77. The breakdown of the last value will lead to a prolonged correction. Here, the potential target is 108.12. This level is a key support for the downward structure. The main trend: the downward cycle of June 17. Trading recommendations: Buy: 107.55 Take profit: 107.76 Buy : 107.78 Take profit: 108.10 Sell: 107.05 Take profit: 106.65 Sell: 106.62 Take profit: 106.37 For the Canadian dollar / US dollar pair, the key levels on the H1 scale are: 1.3277, 1.3235, 1.3208, 1.3154, 1.3137, 1.3104 and 1.3069. Here, we are following the development of the downward structure of June 18. The continuation of the movement to the bottom is expected after the price passes the noise range 1.3154 - 1.3137. In this case, the target is 1.3104, wherein consolidation is near this level. For the potential value for the bottom, we consider the level of 1.3069. After reaching which, we expect a rollback to the top. Short-term upward movement is possible in the range of 1.3208 - 1.3235. The breakdown of the latter value will lead to a prolonged correction. Here, the target is 1.3277. This level is a key support for the downward structure. The main trend - the downward structure of June 18. Trading recommendations: Buy: 1.3208 Take profit: 1.3233 Buy : 1.3237 Take profit: 1.3275 Sell: 1.3137 Take profit: 1.3106 Sell: 1.3102 Take profit: 1.3070 For the pair Australian dollar / US dollar, the key levels on the H1 scale are : 0.7039, 0.7012, 0.6972, 0.6959, 0.6927, 0.6913, 0.6892 and 0.6881. Here, we are following the development of the ascending structure of June 18. The continuation of the movement to the top is expected after the price passes the noise range 0.6959 - 0.6972. In this case, the target is 0.7012, wherein consolidation is near this level. For the potential value for the top, we consider the level of 0.7039. After reaching which, we expect a consolidation, as well as a rollback to the bottom. Short-term downward movement is possible in the range of 0.6927 - 0.6913. The breakdown of the last value will lead to a prolonged correction. Here, the target is 0.6892. The range of 0.6892 - 0.6881 is a key support for the top. The main trend is the upward structure on June 18. Trading recommendations: Buy: 0.6972 Take profit: 0.7012 Buy: 0.7014 Take profit: 0.7036 Sell : 0.6927 Take profit : 0.6914 Sell: 0.6910 Take profit: 0.6892 For the euro / yen pair, the key levels on the H1 scale are: 123.27, 122.97, 122.53, 122.36, 121.97, 121.78 and 121.52. Here, we are following the formation of the ascending structure of June 21. The continuation of the movement to the top is expected after passing by the price of the noise range 122.36 - 122.53. In this case, the goal is 122.97, wherein consolidation is near this level. For the potential value for the top, we consider the level of 123.27. After reaching which, we expect a rollback to the bottom. Short-term downward movement is expected in the range of 121.97 - 121.78. The breakdown of the last value will lead to a prolonged correction. Here, the goal is 121.52. This level is a key support for the upward structure. The main trend - the formation of potential for the top of June 21. Trading recommendations: Buy: 122.36 Take profit: 122.50 Buy: 122.56 Take profit: 122.95 Sell: 121.97 Take profit: 121.80 Sell: 121.76 Take profit: 121.52 For the pound / yen pair, the key levels on the H1 scale are : 138.04, 137.60, 137.30, 136.92, 136.40, 136.18, 135.77 and 135.32. Here, we continue to monitor the formation of the potential for the top of June 18. The continuation of the movement to the top is expected after the breakdown of the level of 136.92. In this case, the goal is 137.30. A short-term upward movement is in the range of 137.30 – 137.60, as well as consolidation. For the potential value for the top, we consider the level of 138.04. The movement to which is expected after the breakdown of the level of 137.60. Consolidated movement is possible in the range of 136.40 - 136.18. The breakdown of the latter value will lead to a prolonged correction. Here, the goal is 135.77. This level is a key support for the top. Its price passage will count on movement towards the first goal for the downward movement - 135.32. The main trend - the formation of potential for the top of June 18. Trading recommendations: Buy: 136.92 Take profit: 137.30 Buy: 137.32 Take profit: 137.60 Sell: 136.18 Take profit: 135.85 Sell: 135.75 Take profit: 135.33 The material has been provided by InstaForex Company - www.instaforex.com |
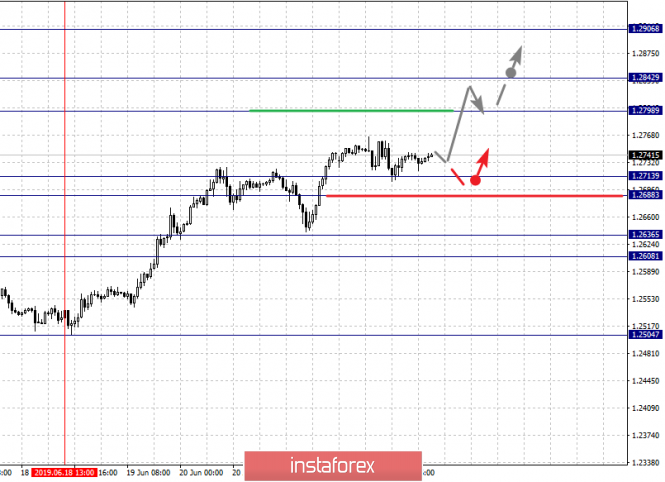
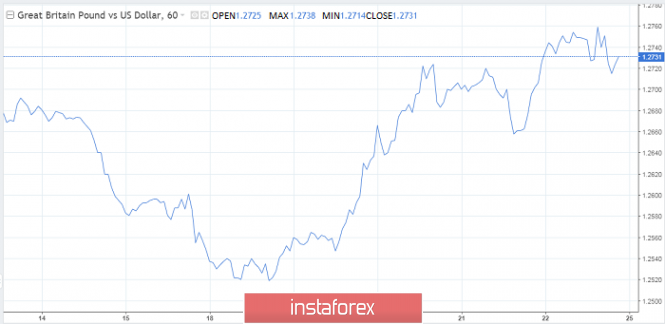
| Posted: 24 Jun 2019 05:27 PM PDT The G-20 summit, which will take place this weekend and is anticipated by market participants, will be crucial for US-China relations. It should show how the parties are interested in resolving the trade conflict. So far, traders hopes to achieve at least some agreements between the United States and China support high-yielding and risky assets. The dollar at this time continues to be under pressure because of the Fed's announced plans to lower the rate this year and next. It also became apparent that the Republicans and Democrats, who forever oppose each other, have both agreed that a weak dollar was needed for further prosperity of the United States. It doesn't matter which way this effect will be achieved - by a stream of negative statistics either by lowering the FED rate, or by Donald Trump's tweets. While Washington clearly set a course for lowering the value of its national currency, the previously oversold British pound is trying to take advantage of the situation and at least partially restore losses. The cautious policy of the Bank of England speaks in favor of the GBP/USD pair growth. The BOE is very restrained in assessing the prospects for global growth, but still sees the need for tighter policies if his predictions are correct. Judging by the latest reports, the UK economy is not in the best shape: retail sales have fallen by 0.5% for the second month in a row, which has already led to a decrease in the annual figure to 2.3% from 5.1%. Until the Brexit problem is solved, the central bank of England will not go for a rate increase. As for Brexit, Boris Johnson and Jeremy Hunt quite logically meet in the finals of the struggle for the post of Tory leader, but the latter has no chance of winning. "Without 5 minutes," prime minister - Johnson - actively speaks out on the topic of Brexit and states the need to preserve the possibility of blackmail in the matter of paying compensation for leaving the European Union. The last announced amount was more than 50 billion euros. Boris Johnson will most likely want new negotiations on the subject of "divorce" conditions, but Europe's position is tough and, according to Tusk, the United Kingdom is simply inefficiently wasting time. However, there was some certainty regarding Brexit, it became clear to everyone that Britain will leave the EU this autumn, no matter what, and no matter who becomes the next British prime minister. Market participants perceived a new certainty rather positively. Thus, the pound may recover to $1.2920-50 in the coming weeks. |
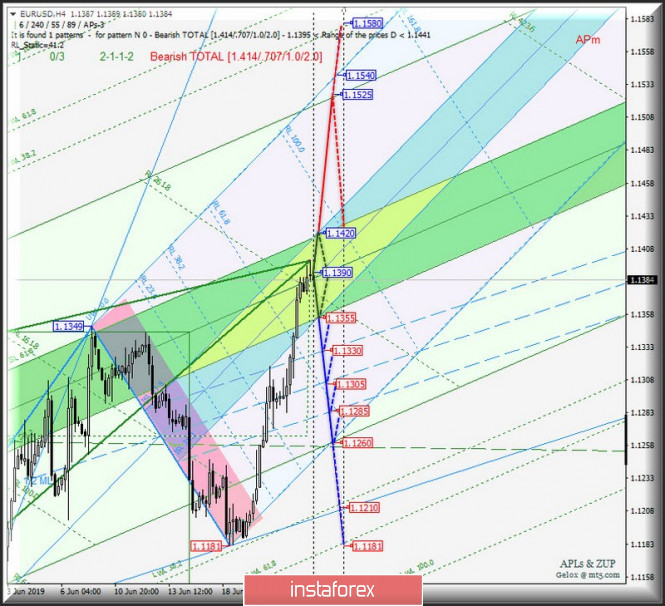
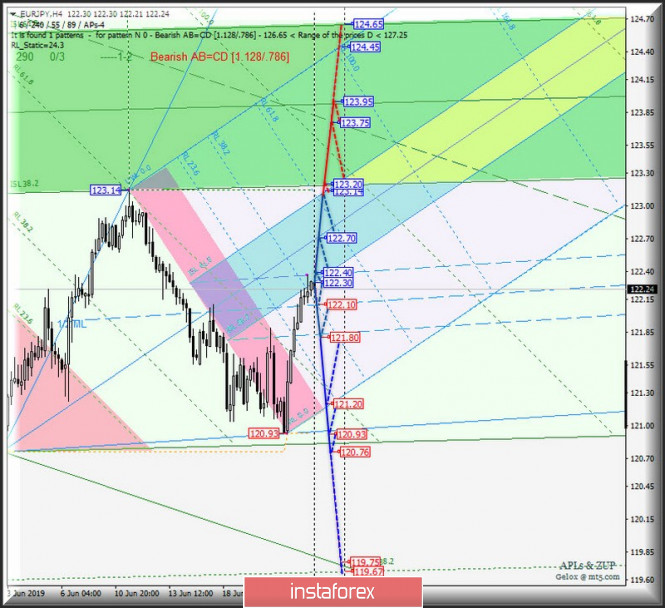
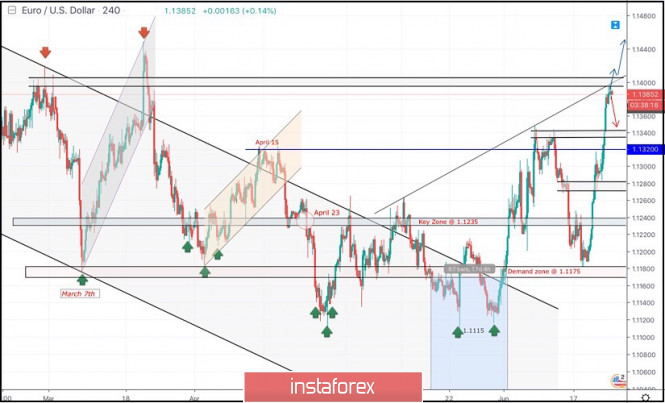
| Posted: 24 Jun 2019 05:22 PM PDT A comprehensive analysis of movement options of the European and Japanese currency + cross-instrument of these -> EUR / USD vs USD / JPY vs EUR / JPY from June 25, 2019. ____________________ Euro vs US Dollar Testing and the direction of the breakdown of coincident boundaries (1.1355 <-> 1.1390 <-> 1.1420) equilibrium zone of Minuette operating scale fork will determine the further development of the movement of the single European currency EUR / USD on June 25 2019. Details of working out the boundaries of these zones of equilibrium can be seen on the animated graphics. The breakdown of the support level of 1.1355 (intersection of ISL38.2 Minuette and ISL38.2 Minuette) -> development of the downward movement of EUR / USD can be continued to the boundaries of the 1/2 Median Line channel Minuette (1.1330 <-> 1.1305 <-> 1.1285) with the prospect of reaching the support level of 1.1260 at the intersection of the initial SSL lines of the Minuette operational scale fork. The breakdown of the resistance level of 1.1.1420 (intersection of ISL61.8 Minuette and ISL61.8 Minuette) -> the option of continuing the development of the upward movement of the single European currency to the final FSL (1.1525) line of the Minuette operational scale fork. The markup of the EUR / USD movement options is shown in the animated graphics.
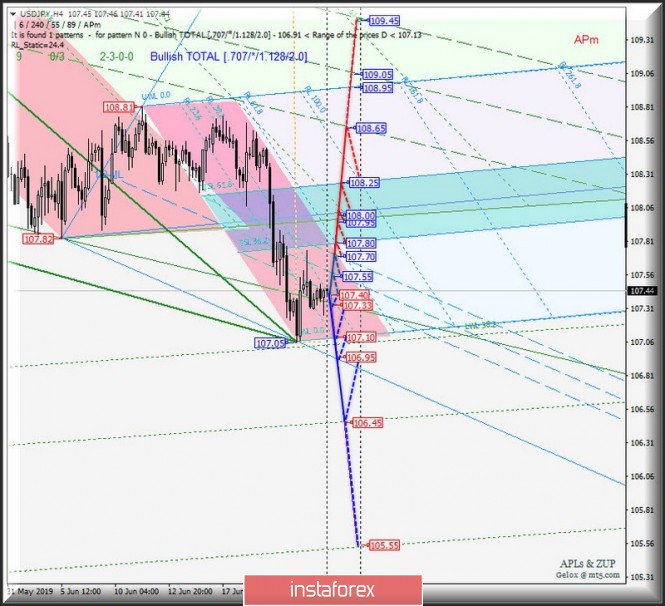
____________________ US Dollar vs Japanese Yen The movement of the USD / JPY on June 25, 2019 is due to perfecting the boundaries channel of the 1/2 Median Line (107.40 <-> 107.55 <-> 107.70) Minuette operational scale fork. More details of the movement inside this channel are shown on the animated graphics. The breakdown of the level of resistance 107.70 (the upper boundary of the channel of the 1/2 Median Line Minuette) together with ISL38.2 Minuette (107.80) -> development of the movement USD / JPY continues to equilibrium zone (107.80 <-> 108.00 <-> 108.25) Minuette operational scale fork, and in case of a breakdown of ISL61.8 Minuette (108.25), the upward movement of this currency instrument can be continued to the boundaries of the 1/2 Median Line channel (108.65 <-> 109.05 <-> 109.45) of the Minuette operational scale fork. The breakdown of the support level of 107.40 (lower boundary of the channel of the 1/2 Median Line Minuette) and the control line LTL (107.33) of the Minuette operational scale fork -> development of the USD / JPY movement can continue to the goals -> initial line SSL Minuette (107.10) <-> local minimum (107.05) <-> control line LTL Minuette (106.95) <-> warning line LWL38.2 (106.45) Minuette operating scale fork. Markup options for the USD / JPY movement are indicated in the animated graphic ->
____________________ Euro vs Japanese Yen From June 25, 2019, the cross-instrument EUR / JPY will develop its movement in accordance with the working out and direction of the breakdown of the boundaries of the 1/2 Median Line channel (121.80 <-> 122.10 <-> 1.2240) of the Minuette operating scale fork. The breakdown of the lower boundary of the channel of the 1/2 Median Line Minuette (support level of 121.80) -> the downward movement of the cross instrument can be continued to the goals -> SSL start line (121.20) of the Minuette <-> minimum (120.93 <-> 120.76). On the other hand, the breakdown of the upper boundary of the channel of the 1/2 Median Line Minuette (resistance level of 122.40) will confirm that further development of the cross-instrument movement will continue in the equilibrium zone (122.30 <-> 122.70 <-> 123.14) of the Minuette operating scale fork, and later , the breakdown of ISL61.8 Minuette (123.14) and ISL38.2 Minuette (123.20) will be the actual development of the EUR / JPY movement within the equilibrium zone (123.20 <-> 123.95 <-> 124.65) of the Minuette operational scale fork. Marking options for the movement of the cross-instrument EUR / JPY is presented in the animated graphic ->
____________________ The review was compiled without taking into account of the news background. The opening of the trading session of the main financial centers does not serve as a guide to action (placing orders "sell" or "buy"). The material has been provided by InstaForex Company - www.instaforex.com |
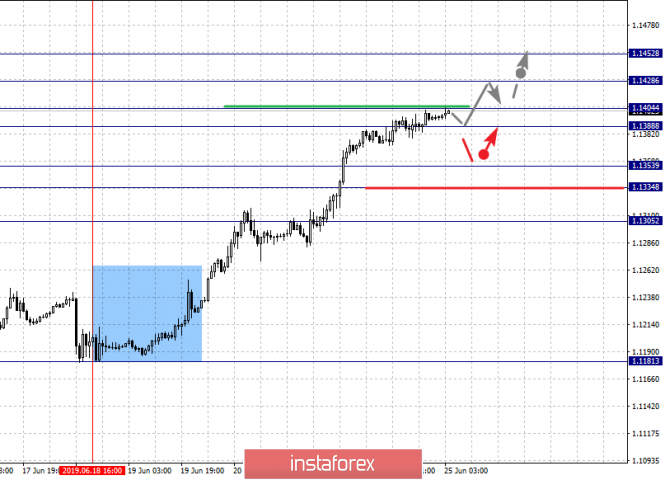
| EUR/USD: Exit above $1.14 will trigger a pullback Posted: 24 Jun 2019 05:04 PM PDT Now, when the Fed and the ECB have given an open signal to the market to ease monetary policy, the question arises, who has the largest arsenal of ammunition? There is no need to look for an answer for a long time, since the European Central Bank clearly looks weaker: interest on deposits is already negative, and the effectiveness of QE is debatable. In this case, Jerome Powell and his team can safely reduce the rate several times. The derivatives market signals a 94% and 66% probability of easing policy this year by 25 bp and 50 bp A good background for EUR/USD, so why not grow? In order to update the June peak, euro fans needed fresh drivers, and they got them. Business activity in the eurozone services sector rose to a 7-month high, pulling the composite purchasing managers index. Yes, trade wars make their mark, the manufacturing sector remains weak, but ahead of Donald Trump and Xi Jinping, who can change everything. The chain of events: the end of the US-China conflict - the recovery of the Chinese economy - the growth of German exports - the strengthening of the euro is working. That's just for its implementation takes time. It is worth noting that the growth of the euro entirely now depends on the demand for the dollar. Therefore, it is unlikely that the EUR/USD pair would be able to shoot at the data on business activity in the euro bloc. Of course, the main role here was played by the large-scale closure of long speculative positions on the US currency. However, the fundamental factors are now emerging in favor of a gradual upward trend in EUR/USD. The Fed is ready to lower rates, the market is waiting for the end of the trade war and the improvement of macroeconomic statistics for the eurozone. Here again, not everything goes smoothly. There is an opinion that the Fed is deceiving or, more correctly, to say, keep back. In reality, there are not enough reasons to reduce the rate. If Washington agrees with China, then they will not remain at all. Recall, Fed Vice Chairman Richard Clarida noted that the regulator will start to operate only when necessary. FOMC spokesperson Lael Brainard said that economic growth in the country is quite strong, just in early May there was uncertainty of a political nature, which may well disappear. Then the word "patience" will reappear in the lexicon of the Fed leadership. The US, like many other countries of the world, is facing a slowdown in inflation, but the reason for this lies in an extremely soft monetary policy. The head of the Federal Reserve Bank of St. Louis, James Bullard is confident that the rate cut will accelerate inflation. Theoretically it should be so, but in real life we see a different picture. Rumors of monetary expansion contribute to a fall in inflation expectations and a slowdown in PCE. "Bullish" forecasts for EUR/USD come true, quotes of the pair ended at multi-month highs last week. The main pair also began the new week with growth. At the same time, the euro's growth to the levels of $1.14 and $1.144 will enhance the risks of a pullback against the background of the de-escalation of the trade conflict between the United States and China and the associated increase in yield of treasuries. Consideration should also be given to increased tensions between the United States and Iran. The euro will not like it, however, like the US dollar, if we consider it together with the safe-haven yen. However, the greenback is unlikely to fall below 105, since a significant refusal of investors from dollar assets is unlikely. |
| Golden Rush: the price of the yellow metal exceeded $1,400 Posted: 24 Jun 2019 04:53 PM PDT On Monday, June 24, the price of gold istood at a previously reached mark, exceeding $1,400 per ounce. Last Friday, the precious metal's price soared to $1,411 per ounce and is currently seeking to hold its positions. According to analysts, the current price is the highest since September 2013. Experts believe that the rising cost of precious metals demonstrates a decrease in risk appetite against the backdrop of increasing geopolitical tensions. The yellow metal is once again becoming attractive to investors as a safe-haven asset. Previously, gold was supported by the decision of the US Federal Reserve to soften monetary policy, if necessary. The reasons for this were such factors as the growth of geopolitical uncertainty and low inflation, slowing the rise of the American economy. Following the Fed's meeting, the yellow metal's quotes rose by $13, to $1,364 for 1 troy ounce. At the end of last week, the precious metal managed to overcome the psychologically important mark of $1,400 per ounce. In this regard, a number of experts believe that gold may later become cheaper, since it has already reached the target range of $1,375– $ 1,400 for an ounce. The yellow metal grew in price for the fifth week in a row. Experts believe that in the short term, it will continue to fluctuate in the range of $1,380 to $1,410 per ounce. A positive impulse for gold may continue in the second half of 2019, as the Fed is ready to ease monetary policy, and other leading regulators may follow its example. Experts consider the $1450 gold price per troy ounce to be the medium-term benchmark. According to analysts, the current rise of gold prices in many currencies of the world is close to the record levels of previous years. A few months ago, the cost of precious metals peaked in countries such as Argentina, Australia, Brazil and Sweden. In a number of other countries, such as Canada, India, Mexico, South Africa, Turkey, and Uruguay, the price of gold remains high. In Russia and Hungary, the precious metal is almost close to its maximum values. Experts do not exclude that in the near future the yellow metal will be able to break the current price record. |
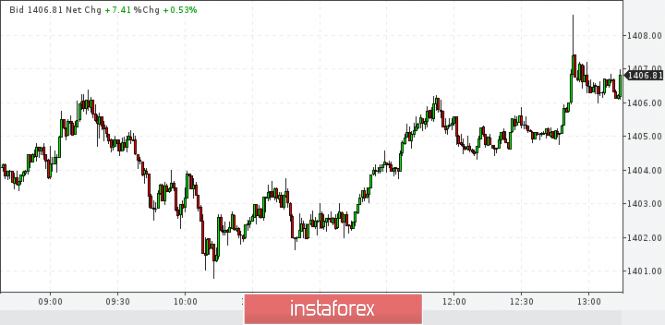
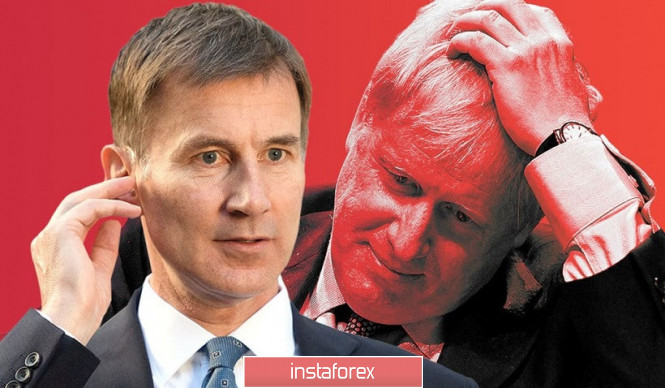
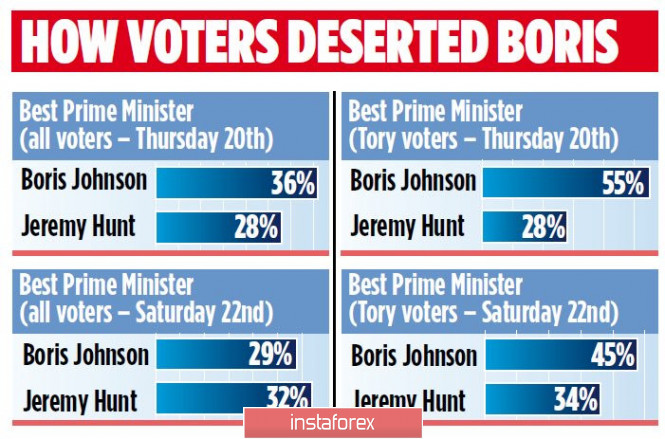
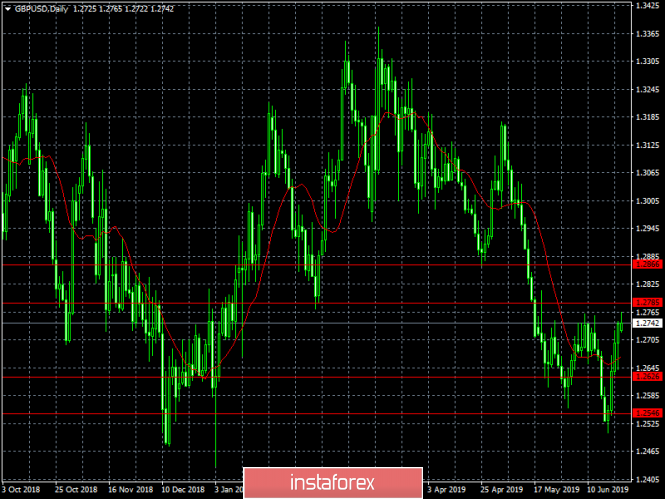
| GBP/USD. A family scandal lowered Johnson's rating and supported the British currency Posted: 24 Jun 2019 04:34 PM PDT The pound-dollar pair within the 27th figure had increased by over 200 points during the week. The British currency has moved away from the price lows of the year and is now trying to show character using the greenback's weakness. However, not only is the dollar devaluation pulling up the GBP/USD: for the first time in a long time, the pound had its own growth arguments, which appeared from a rather unexpected side. And although the general uncertainty still puts pressure on the pair, buyers are using every opportunity to prolong the period of the corrective price increase. Today, the GBP/USD pair has reached the resistance level of 1.2770 (the top line of the Bollinger Bands indicator on the daily chart), but could not break through it, but the potential for further growth still remains. Against the background of an almost empty economic calendar, the British currency reacts to news of a political nature. Let me remind you that now in Britain there is a struggle for the post of head of the leading Conservative Party, and in fact for the post of prime minister of the country. After several rounds of voting, two candidates entered the "finals" of the political race: ex-foreign minister Boris Johnson and current foreign minister Jeremy Hunt. Throughout the pre-election period, Johnson, who is known for his tough position on Brexit, was considered the undisputed favorite of the race. He is in favor of revising the terms of the deal, but at the same time he opposes the extension of the negotiation period after October 31. In his opinion, Brexit should take place at all costs on November 1 - with or without a deal. A "hard" Brexit does not frighten Johnson, moreover - he threatened Brussels not to pay the multibillion-dollar amount of "compensation" until Europe reconsiders the terms of the agreement with London. In other words, his coming to power does not bode well for the pound, given the position of the British regulator, who, in fact, "tied" the question of Brexit to the prospects of monetary policy. It is for this reason that the British currency has been under strong pressure for several weeks: Johnson has maintained an undeniable advantage in the political race all this time, and this fact increased the likelihood of a "chaotic" Brexit. Hunt, following several rounds of voting, lagged behind the leader of the election campaign by several dozen points and seemed to have no chance of winning. But, as it turned out, everything is possible in politics, and even more so in British politics. According to the results of the latest opinion polls, Boris Johnson not only lost his advantage in the overall rating over his main opponent Jeremy Hunt, but is now behind him. The reason for this, oddly enough, was the personal life of Johnson, namely his quarrel with the mistress. At the end of last week, the neighbors of the couple recorded the audio of the beats and female cries that were heard from their home in London. They even called the police, but law enforcement officers only recorded the fact of a family quarrel without any offenses. But after this incident in the UK, a rather heated debate began on whether Boris Johnson is capable of being prime minister, given his personal qualities, in particular, stress tolerance. He added fuel to the fire and his public reaction to this incident. He refused to answer the question about this situation, saying the following: "I believe that people do not want to hear about such things." After this, Johnson was even criticized by his colleagues in the Conservative Party. In particular, Tory deputy Malcolm Rifkind accused him of hiding "important information for the public," and former Foreign Minister Alan Duncan said that Johnson now has a "big question mark over his head." As a result, a domestic family conflict has found fatal consequences for an odious candidate: after the incident, Johnson's leadership declined among all voters and among Conservatives. The latest poll showed that 29% of all voters consider Boris Johnson to be the most optimal prime minister, while Hunt was supported by 32%. Among members of the Conservative party, Johnson's leadership also declined (from 55% to 45%), while Hunt's position increased from 28% to 34%. In addition, according to the British edition of The Times, even if elected, Johnson can pass a vote of no confidence - if he tries to withdraw the country from the European Union without a deal on October 31. According to anonymous sources, the Labour Party initiates a Parliamentary vote on this issue nearly on the first day of Johnson's term in office. According to the publication's interlocutors, a significant part of the Conservatives will support Labour, especially if Johnson does not abandon the idea of extending the negotiation process after October 31. On the one hand, such information reduces the likelihood of the implementation of a "hard" Brexit. On the other hand, the published information is in the nature of rumors, which are often not confirmed. Johnson's downgrade is good news for GBP/USD bulls, but even against the background of the scandal, he retains leadership among members of the Conservative Party (although the gap with Hunt has significantly decreased). Thus, the controversial fundamental background does not make it possible for bulls of the pair to break through the resistance level of 1.2770 and enter the 28th figure. But if Johnson's rating will continue to fall, and the dollar will still be under pressure from the US Federal Reserve's position, these price targets will be easily overcome by GBP/USD bulls. The material has been provided by InstaForex Company - www.instaforex.com |
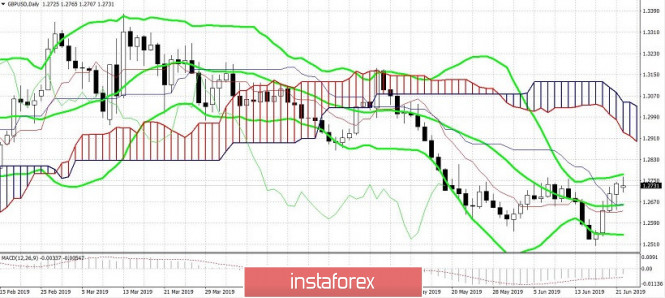
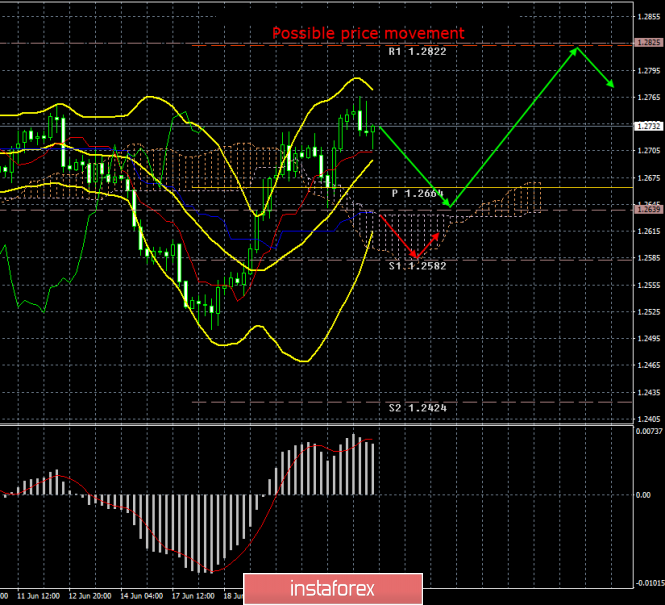
| Posted: 24 Jun 2019 04:24 PM PDT 4-hour timeframe The amplitude of the last 5 days (high-low): 76p - 59p - 131p - 96p - 104p. Average amplitude for the last 5 days: 93p (93p). The British pound sterling was slightly adjusted on Monday, June 24. As we remember from the EUR/USD review, there was no correction. Accordingly, this is what we talked about earlier. The situation with Brexit, a political crisis and a hazy future continues to dominate over the pound. That is why the euro can show a strengthening in the future (although its prospects are also not 100%) while the pound can resume a fall. So far, of course, it is still too early to talk about resuming the downward trend, too much negative has come from overseas in recent weeks. Nevertheless, traders are simply afraid to buy the British currency, knowing that the "hard" Brexit is not one of the possible options now, but the most likely option of a "divorce" between the EU and the UK. Firstly, because Boris Johnson is not at all afraid of the "hard" scenario. Secondly, because the European Union officially abandoned new negotiations under the terms of the exit agreement and advised the new prime minister not to waste time on false dreams. New referendum? The probability of holding it is present, especially since Opposition party leader Jeremy Corbyn supports this option. But this also testifies to the fact that even before the proclamation of the new prime minister, we already have a potential split in opinions between the Conservatives and the Laborites. It is because of this that the Parliament can again "slip" at the polls. Recall that the new date Brexit is October 31. Trading recommendations: The pound/dollar currency pair started the downward correction, keeping the upward trend. Thus, a rebound from the Kijun-sen line or a reversal of the MACD upwards will make it possible to buy the pound to a resistance level of 1.2822. It will be possible to buy the US dollar if the pair has consolidated below the Kijun-sen line. In this case, the downward trend may resume with the first target support level of 1.2582. In addition to the technical picture should also take into account the fundamental data and the time of their release. Explanation of the illustration: Ichimoku indicator: Tenkan-sen - the red line. Kijun-sen - the blue line. Senkou Span A - light brown dotted line. Senkou Span B - light purple dotted line. Chikou Span - green line. Bollinger Bands indicator: 3 yellow lines. MACD Indicator: Red line and histogram with white bars in the indicator window. The material has been provided by InstaForex Company - www.instaforex.com |
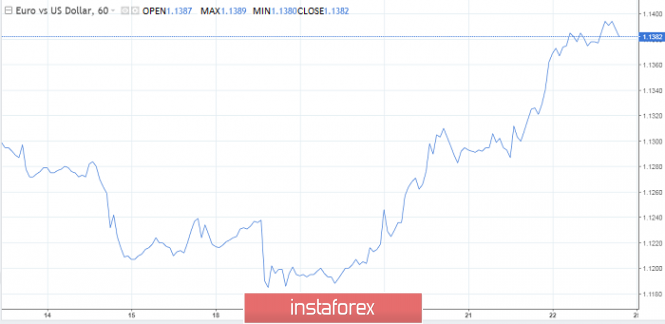
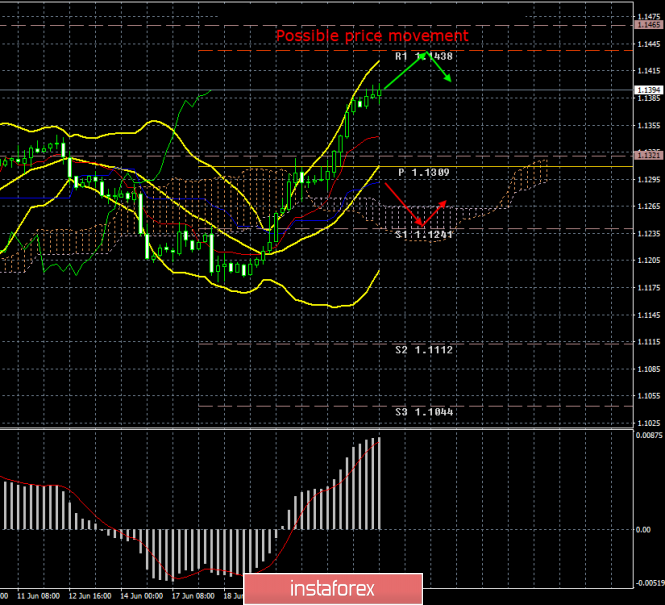
| Posted: 24 Jun 2019 04:11 PM PDT 4-hour timeframe The amplitude of the last 5 days (high-low): 43p - 62p - 67p - 92p - 95p. Average amplitude for the last 5 days: 72p (70p). While the euro continues to grow steadily against the US currency, traders have completely turned their attention away from meetings of EU and US regulators to the upcoming G-20 summit, at which the leaders of the US and China will have to meet to discuss a trade agreement between the countries. Donald Trump has previously stated that at the G-20 summit, he expects that Xi Jinping himself would initiate dialogue with him and will not hide or delay the entire process of negotiations. According to Trump, the Chinese side is deliberately in no hurry to negotiate, hoping that Trump will not win in future presidential elections, and that the new president will be more loyal in the negotiations. At the same time, China is not ready to make the concessions that Trump is asking for. If he wanted to, he had already gone with them. But Beijing understands that the US economy will also suffer from a trade war, especially now that macroeconomic indicators have been disappointing for the third consecutive week. Economic indicators are falling, and many analysts attribute this to Trump's protectionist policies. Accordingly, his popularity among the electorate will fall. It seems that this is exactly what China is counting on, but Trump is preparing to introduce new duties on Chinese imports, which will fully cover the entire turnover, if in the near future negotiations will not end in success. "Success," according to Trump, is when China accepts the terms. Beijing does not agree with this position, and on the eve of the summit, made an official statement that both sides must make concessions in order to reach agreement, and not just one. It is difficult to say whether the dollar is getting cheaper on Monday precisely because of the low probability of reaching an agreement between Beijing and Washington, or it's echoes from last week. One way or another, a correction is brewing. Trading recommendations: EUR/USD continues to move up. Thus, long positions remain relevant for the euro/dollar pair with a target of 1.1438, and the MACD reversal will indicate a downward correction. It will be possible to sell the euro/dollar pair if the bears manage to gain a foothold below the critical line, with the first goal of 1.1241. In this case, the initiative for the EUR/USD pair may return to the bears' hands. In addition to the technical picture should also take into account the fundamental data and the time of their release. Explanation of the illustration: Ichimoku indicator: Tenkan-sen - the red line. Kijun-sen - the blue line. Senkou Span A - light brown dotted line. Senkou Span B - light purple dotted line. Chikou Span - green line. Bollinger Bands indicator: 3 yellow lines. MACD Indicator: Red line and histogram with white bars in the indicator window. The material has been provided by InstaForex Company - www.instaforex.com |
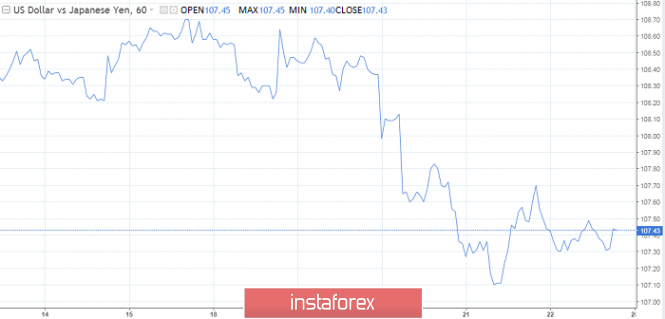
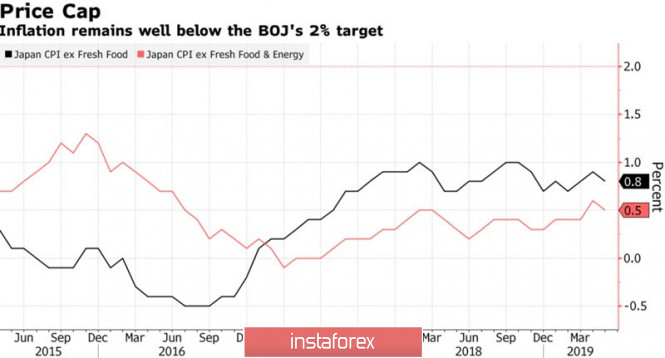
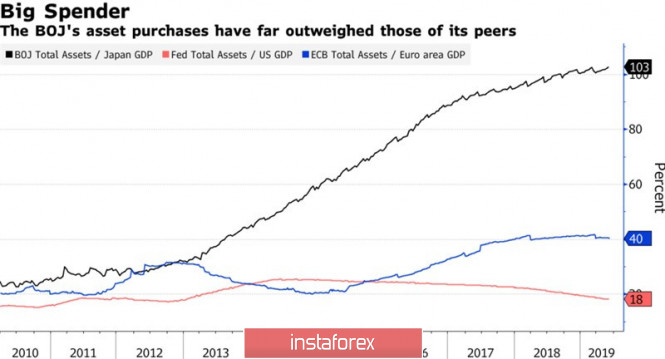
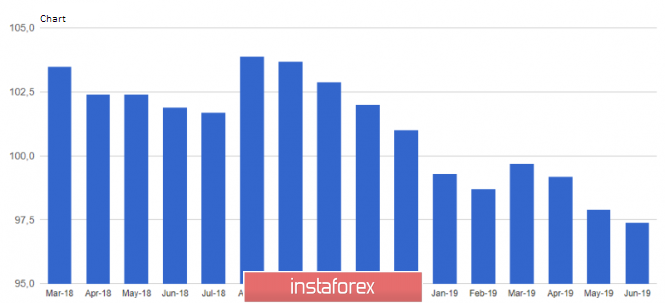
| Posted: 24 Jun 2019 04:00 PM PDT Escalating US and Chinese trade conflicts, hints that the Fed will lower the federal funds rate and sluggish inflation pushed the yield on Treasury 10-year bonds to their lowest level since 2016. Investors are seriously worried about the slowdown of the US and global economy and are increasing their share of safe-haven assets in investment portfolios. As a result, not only bonds, but the yen and gold are also very popular. If someone is not satisfied with the appreciation of the currency of the rising sun, then this is the Bank of Japan. Despite a large-scale stimulus package, inflation cannot rise above 1%, and a fall in business activity in the manufacturing sector, a reduction in exports, supply chain breakdowns and a decline in business investment as a result of trade wars risk plunging the economy into recession. The situation is exacerbated by a sales tax increase, which in 2014 led to a technical decline. As a result, public support for Shinzo Abe's government is falling, and officials needs to seriously consider what kind of incentive measures can help the GDP. Dynamics of Japanese inflation It is unlikely that something serious should be expected from the central bank. Despite Harukiho Kuroda's threats to lower rates and expand QE, investors realize that the BoJ's ammunition arsenal is limited. Instead of the claimed £80 trillion per year over the past 12 months, he gained only £29 trillion. It is no longer necessary to maintain the yield of 10-year bonds in the range of -0.2%/+ 0.2%. Deepening the overnight rate to negative territory will cause additional damage to the country's banking system. Perhaps Kuroda is right, and the government should increase the fiscal stimulus and issue more bonds. With the current yield, the cost of servicing the debt actually falls on the shoulders of their buyers. The yen is a typical example of the QE's inefficiency. Not only does inflation in Japan persistently not want to go to the target, so also a large-scale monetary stimulus does not lead to devaluation. The Bank of Japan has expanded its balance sheet much more than its counterparts from the Fed and the ECB, but the goals have not been achieved. Dynamics of central bank balances The situation may even turn into a breeze if Donald Trump and Xi Jinping do not find a common language at the Osaka G20 summit. In this scenario, which will be interpreted by investors as a further escalation of the trade conflict, the yields of bonds around the world will continue to fall, and the Fed will be forced to lower the federal funds rate in July. The expectations of the monetary expansion of the Fed are a "bearish" factor for USD/JPY. And no matter how much the Bank of Japan would like to adequately respond to its colleagues from Washington, its possibilities are limited. On the contrary, if after the negotiations of the two presidents the deal becomes closer, the global risk appetite will increase, and the demand for safe-haven assets will fall. Technically, the 5-0 pattern was clearly implemented on the daily USD/JPY chart. Reversal to the wave of the "Shark" CD pattern made it possible to form short positions. If the "bears" succeed in rewriting the June low, the chances for the realization of the target by 261.8% according to the AB = CD pattern will increase. The material has been provided by InstaForex Company - www.instaforex.com |
| What was it? (weekly review of EUR/USD and GBP/USD from 06/24/2019) Posted: 24 Jun 2019 04:00 PM PDT So I want to exclaim - what was it?! The dollar stood still for a couple of days and then rushed into the unknown distance. Yes, even with such speed that no one could come to its senses. The Federal Reserve System gave a magic kick in the ass already at the stage of announcing the composition of the team, so even before Jerome Powell's press conference it became known that one of the members of the Federal Commission on Open Market Operations had voted to lower the refinancing rate. Then the team captain gave the dollar even greater acceleration, saying that a considerable number of its partners, part-time employees and subordinates, do not exclude the possibility of reducing the refinancing rate to as much as 2.0%. True, so far they do not intend to take such actions, but the situation is developing in such a way that such an opportunity should not be ruled out. So all Thursday, the dollar flew like a soccer ball sent to its own goal. As soon as it lost all the kinetic energy, Lael Brainard and Loretta Mester played the role of defenders, they almost cut the ball into their own goal. They managed to say such that the number of gray-haired people in the world clearly increased. Although they voted for the preservation of the parameters of the monetary policy pursued, but only for the reason that right now they do not see the need to lower the refinancing rate, they do not exclude such a possibility for this year. Take note, not a word about raising the refinancing rate, which appears in the previously announced plans of the Federal Reserve System. So, laughter is laughter, but in fact we are on the verge of a cardinal turn in the policy of the Federal Reserve System, and instead of gradually tightening it on the horizon, its softening looms with might and main. It is no wonder that investors sold out portraits of dead American presidents with incredible frenzy. The frequency with which representatives of the Federal Reserve make such statements is more like an attempt to please Donald Trump, who is so outraged by the dollar that he again threatened Jerome Powell with early resignation. Against the background of such large-scale events, no one paid attention to the meeting of the Board of the Bank of England, which continues to remain in an ostrich's pose, hiding its head in the sand. Although even if there were no harsh statements by representatives of the Federal Reserve System, no one would have paid attention to the inaction of the Bank of England. The Office of Mark Carney has long stated that there will be no changes in the regulator's policy until it becomes clear how Brexit will end. But events are developing in such a way that everything goes in time for the saddest end of this whole epic. Boris Johnson, who is in favor of a speedy divorce with the European Union, and even without an agreement, because the existing one does not fully suit him, since it implies certain payments from the United Kingdom, confidently won the qualifying race for the post of head of the Conservative Party. Now almost one hundred and sixty thousand party members through the mail must choose who will become their leader, Boris Johnson or Jeremy Hunt. Considering how far the former foreign minister has bypassed the current one, there is almost no doubt that Boris Johnson will become the new head of the Conservative Party, and considering its majority in the House of Commons, also the new prime minister. This means that Brexit will follow the worst-case scenario, without any deal and with unpredictable consequences for the economy of both the UK and the European Union. It is clear that the economy of continental Europe will experience a number of difficulties, but it is still difficult to say how it will all end for the United Kingdom. Tarot cards give an ambiguous answer - whether the Apocalypse or Armageddon. Naturally, enthusiastically eating popcorn while watching the Brexit series and the Federal Reserve System is somehow not conducive to the study of boring and dreary macroeconomic statistics. But there was something to see. The number of building permits increased by 0.3%, but the number of new construction projects decreased by 0.9%. Although home sales in the secondary market increased by 2.5%. Also, the total number of applications for unemployment benefits fell by 43 thousand, while waiting for a decline of only 13 thousand. But at the same time, preliminary data on business activity indices showed a decrease in the production index from 50.5 to 50.1, and in the service sector from 50.9 to 50.6. As a result, the composite index of business activity fell from 50.9 to 50.7. But this is as far as the United States is concerned, and it can be seen that, in general, the data are not so positive and rather neutral. But there were enough interesting results in Europe. There is only one, the final data on inflation, which due to the revision of the previous values showed a decrease from 1.7% to 1.2%. Given that until recently, April inflation was estimated at 1.2% and it was expected that it will remain unchanged in May, the picture looked relatively good. Now everyone has seen that inflation is seriously slowing down, which means that the European Central Bank will be much more likely to look for options for easing monetary policy. True, this is the only thing that could upset investors, since the rest of the macroeconomic data from Europe were clearly positive. In particular, the growth rate of the construction industry slowed from 5.8% not to 1.9%, but to 3.9%. But what is much more interesting is that the preliminary data on business activity indices turned out to be significantly better than the American ones, since all the indicators showed an increase. The manufacturing index of business activity rose from 47.7 to 47.8, and in the service sector from 52.9 to 53.4, which gave a composite index increase from 51.8 to 52.1. But given the extremely weak data on inflation, there are clearly no reasons for the growth of the single European currency. But the British statistics more likely indicates that the pound had to go down with confidence, because not only did inflation fall from 2.1% to 2.0%, so also the growth rate of retail sales slowed down from 5.1% to 2 3%. But such an explosive mixture for all sorts of investors is the very incense, from which devils scatter through all the cracks. After Fed representatives sent the dollar into unthinkable distances, the market, of course, needs to take a breath and collect its thoughts. But this week, Jerome Powell is again in favor, and there is every reason to believe that he will continue to bury the portraits of the dead presidents of the United States with further hints of a speedy reduction in the refinancing rate. There will be at least one person who will rejoice over this, Donald Trump. However, in the US they expect a slight increase in sales of new homes, as well as orders for durable goods. Moreover, the final GDP data for the first quarter should confirm the fact of accelerating economic growth. Personal incomes with personal expenses can show an increase of 0.3% and 0.4%, respectively, which usually pleases investors. In Europe, preliminary inflation data will be published, which are expected to show its stability. As for the UK, there is still a slight lull in terms of Brexit, since the results of the election of the head of the Conservative Party will not be known anytime soon. But the final GDP data for the first quarter will be published, which will almost certainly confirm the fact of accelerating economic growth. Nevertheless, this is already taken into account by market participants, and they will increasingly reflect on the consequences for the British economy, just unregulated Brexit. In other words, if Jerome Powell does not add fuel to the fire again, then, due to macroeconomic statistics and the oversoldness of the dollar, the single European currency may drop to 1.1300 - 1.1325. Well, if the head of the Fed continues to frighten market participants, then we are waiting for a rise above 1.1400. In regards to the pound, the options are exactly the same, and either we will witness its decline to 1.2625 or see a continued growth to 1.2800 and above. |
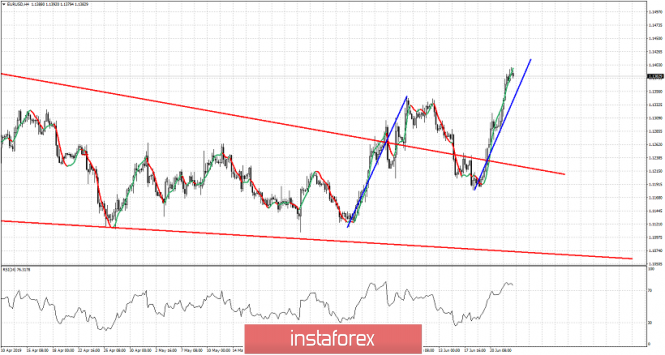
| June 24, 2019 : EUR/USD may demonstrate a bearish pullback towards 1.1340. Posted: 24 Jun 2019 10:45 AM PDT
Since February 28, the EURUSD pair has been moving within the depicted channel with slight bearish tendency. Short-term outlook turned to become bearish towards 1.1175 (a previous weekly bottom which has been holding prices above for some time. On the period between May 17th and June 5th, a bearish breakdown below 1.1175 was temporarily achieved. As expected, further bearish decline was expected towards 1.1115 where significant bullish recovery was demonstrated bringing the EUR/USD pair back above 1.1175 demonstrating a significant bullish breakout off the depicted bearish channel. Although Temporary Bullish breakout above 1.1320 was initially demonstrated (suggesting a high probability bullish continuation pattern), Recently, The EURUSD pair has failed to maintain bullish persistence above 1.1320 and 1.1280 (the depicted price levels/zones). This was followed by a quick breakdown below the next key-zone around 1.1235. This triggered a deeper bearish pullback towards 1.1200-1.1175 where significant bullish price action was demonstrated. Currently, the EURUSD looks overbought facing a confluence of supply levels. Thus, a bearish pullback towards 1.1340 should be anticipated. Short-term outlook remains positive/bullish as long as bullish persistence above 1.1340 (Demand-Zone) and 1.1280 (Demand-Zone) is maintained on the H4 chart. A valid BUY entry was recently suggested upon the recent bullish breakouts above 1.1235 and 1.1320. Both are running in profits. SL should be raised to 1.1270 to secure more profits. Trade recommendations : For Intraday traders who missed the initial breakout, They should wait for another bullish breakout above 1.1400 as a BUY signal. Initial Target levels to be located around 1.1460 and 1.1500 Bearish decline below 1.1370 invalidates this bullish breakout scenario. The material has been provided by InstaForex Company - www.instaforex.com |
| Posted: 24 Jun 2019 10:45 AM PDT |
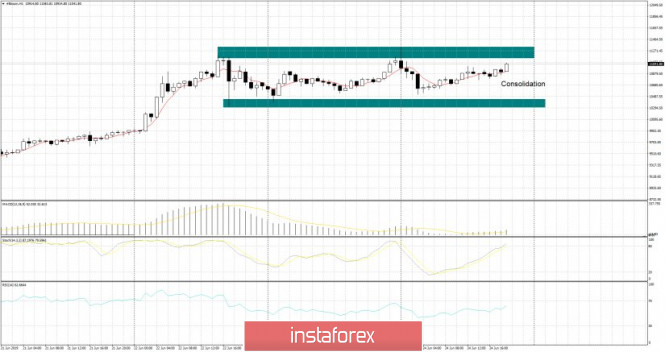
| Posted: 24 Jun 2019 09:41 AM PDT BTC has been trading sideways in past 2 days and it is doing consolidation at the moment. You should watch for potential breakout of the horizontal base to confirm further direction.
Green rectangles – trading range support-resistance BTC did enter into consolidation mode between the price of $11.346 (resistance) and $10.311(support). Watch for potential breakout of resistance or support to confirm further direction. The upward breakout would confirm the potential test of $12.364. From other side, the potential break of the support would confirm test of $9.311. Mid trend is still bullish. The material has been provided by InstaForex Company - www.instaforex.com |
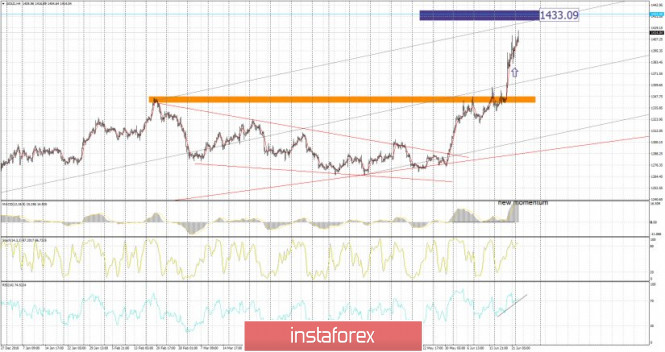
| Gold 06.20.2019 - Big domination of bulls continues Posted: 24 Jun 2019 09:31 AM PDT Gold has been trading upwards as I expected. The price tested the level of $1.414. The oscillators is showing us the new momentum on the upside and I still expect more upside to come. Key resistance is set at the price of $1.433.
Blue rectangle – Important resistance Orange rectangle – Support Black lines – Upward Pitchfork channel New momentum up on the MACD oscillator is showing us strong conviction to the upside. The Gold is near my critical resistance at the price of $1.433 so there is still a small space for trading on the upside. The trend is very bullish and you should watch for buying on any pullback. The level of $1.381 seems like short-term support and I will pay big attention cause as long the Gold is trading above the support, I will remain bullish. The material has been provided by InstaForex Company - www.instaforex.com |
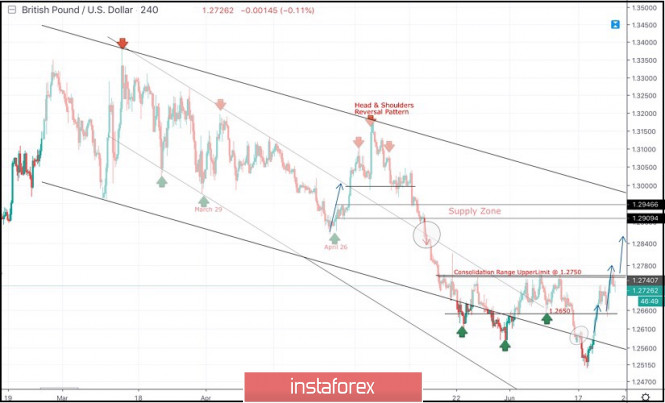
| June 24, 2019 : Bullish breakout above 1.2750 is anticipated for the GBP/USD. Posted: 24 Jun 2019 09:30 AM PDT On April 26, another bullish pullback was initiated towards the price zone of 1.3130-1.3170 (the upper limit of the movement channel) where the depicted bearish Head and Shoulders reversal pattern was demonstrated on the H4 chart with neckline located around 1.2980-1.3020. Bearish breakdown below 1.2980 allowed the recent significant bearish movement to occur towards the lower limit of the long-term channel around (1.2700-1.2650) where temporary bullish rejection was expressed. Shortly after, temporary bullish breakout above 1.2650 was demonstrated for a few trading sessions. This enhanced the bullish side of the market towards 1.2750 which prevented further bullish advancement. However, recent temporary bearish decline was demonstrated below 1.2600 hindering the mentioned bullish scenario for some time before bullish breakout could be achieved earlier last week. For the bullish side of the market to remain dominant, bullish persistence above 1.2750 (consolidation range upper limit ) should be achieved by the bulls. Bullish breakout above 1.2750 brings further bullish advancement towards 1.2840 and 1.2900. For conservative traders, SELL positions shouldn't be considered around the current price levels unless bearish breakout below 1.2570 becomes confirmed on higher timeframes (which is low probability). Trade Recommendations: Intraday traders can have a valid BUY Entry upon bullish breakout above 1.2750. T/P levels to be located around 1.2840, 1.2900 and 1.2940. S/L should be placed below 1.2680. The material has been provided by InstaForex Company - www.instaforex.com |
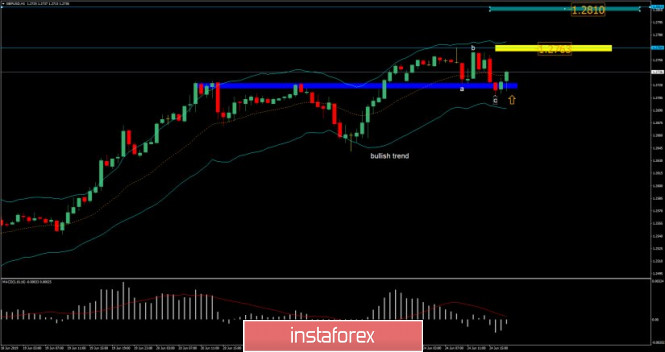
| GBP/USD analysis for June 24,.2019 Posted: 24 Jun 2019 09:19 AM PDT GBP/USD has been trading downwards in past 10 hours but I found that there is potential end of the downward correction (ABC) in the background. Buying opportunities are preferable.
Blue rectangle – Important support Yellow rectangle – Resistance Green rectangle- Resistance 2 GBP/USD did nice test and reject of the key support at the price of 1.2726. There is potential of ABC downward correction completion, which is sign that sellers don't have enough power. MACD oscillator is showing that selling power is decreasing and that there is potential for more upside. Upward targets are set at the price of 1.2763 and 1.2810. As long as the GBP is trading above the 1.2707, I would watch for buying opportunities. The material has been provided by InstaForex Company - www.instaforex.com |
| The dollar began to recover on the eve of the G20 summit Posted: 24 Jun 2019 08:46 AM PDT
The dollar opened a new week with a pullback after its biggest weekly fall in the last four months, traders became cautious again about the prospects of trade negotiations between the US and China at the G20 summit. The reason for the large-scale sale in the main markets was the "dovish" forecasts of the world central banks led by the US Federal Reserve due to growing signs of weakness of the world economy. The dollar lost 1.4% against other currencies last week, its biggest weekly drop since mid-February. The sell-off raised concerns that markets have become overly bearish against the dollar, although the Fed has more room to lower interest rates than the ECB, where rates are already at a negative level. "The Fed's rates are still higher than those of other countries, and the yield on US bonds is unlikely to become negative soon, while the yields of many other countries are already at a negative level. The dollar is the best in this negative company," said Marshal Hitler, a strategist at ACLS Global. Investors are now focused on whether Washington and Beijing will be able to resolve their trade differences at the summit in Japan this week. As noted by Vice Minister of Commerce of China, Wang Shouwen, the Chinese and American sides "must compromise in trade negotiations." Positive news from the tariff front should give impetus to the US currency. The material has been provided by InstaForex Company - www.instaforex.com |
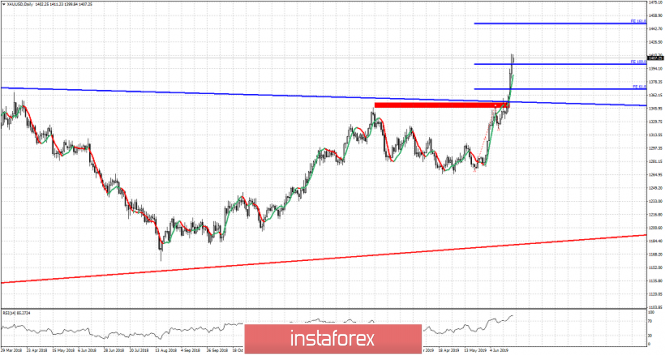
| Gold price could reach $1,440-45 before a meaningful pull back Posted: 24 Jun 2019 08:12 AM PDT Gold price has broken through the important resistance of $1,350-60 and is now trading above $1,400. Trend remains bullish and although the short-term oscillators are in overbought territory, we could see this upward move continue higher towards $1,440 before a meaningful pull back.
Red line - major support Red rectangle - horizontal resistance Gold price has reached the 100% extension of the first upward move from $1,270. Price could continue higher towards the 161.8% Fibonacci extension. Trend remains bullish and even a pull back towards $1,360 would not be a surprise. However at this point such a pull back would be considered as a back test of the break out area. The recent rise in price has been vertical. If price stabilizes and creates a $10-$15 trading range this would be a bullish sign. If price pulls back below the break out area this would be a bearish sign. So far bulls remain in control and have the upper hand. The material has been provided by InstaForex Company - www.instaforex.com |
| Posted: 24 Jun 2019 07:22 AM PDT EURUSD has made new higher highs at 1.1398 thus far with price reaching the equality target with respect to the first upward leg from 1.1107 to 1.1347. The RSI is at short-term overbought levels so a pull back is justified.
Blue lines - comparing two bullish moves EURUSD has almost reached the level that will make the second upward move equal to the first. The RSI is overbought so a short-term pull back towards 1.1350 should not come as a surprise. The RSI has not given any topping sign nor a reversal sign. Trend remains bullish in short- and medium-term trend. The break out above the wedge pattern is a medium-term bullish signal implying we could see 1.17 and higher over the coming weeks. Support is at previous highs at 1.1350 and next at 1.13. Trend changes only with a break below 1.1180. The material has been provided by InstaForex Company - www.instaforex.com |
| EURUSD: Euro buyers were not scared by the weak report from Ifo, but the growth potential is limited Posted: 24 Jun 2019 07:17 AM PDT The demand for the euro remains quite strong despite the weak report on the sentiment of German companies, which in June announced a deterioration in their prospects for the next few months due to growing pessimism. The lack of reaction to sharp sales of the euro, even at current highs, with such a weak report, once again indicates the strength of large players who bet on the growth of risky assets against the US dollar due to the expected decrease in the Federal Reserve interest rates. Currently, the federal funds rate is in the range of 2.25% -2.50%. For a real revival of the economy and the resumption of growth of key sectors, a reduction in the rate of at least 0.5% is required, and preferably by 0.75% at once. Apparently, along with such actions by the Fed, it will be necessary to launch another wave of bond purchases and take additional measures of unconventional policy, which will further weaken the US dollar in the medium term. It is for this reason that traders ignored the report of the German Institute Ifo. According to the data, the Ifo business sentiment index in June 2019 dropped to 97.4 points against 97.9 points in May of this year. Economists had expected the index to fall to 97.6 points in June. If we analyze the index data in more detail, it is clear that the decrease did not occur in all directions. Thus, the expectations index in June fell to 94.2 points from 95.2 points in May, while the current conditions index showed an increase to 100.8 points from 100.7 points in May. The deterioration in the sentiments of business circles in Germany already suggests that the 2nd quarter for the economy will be a period of weakness after a good first quarter. Economic activity will continue to weaken under the threat of new downside risks. Some of the risks that have identified the largest companies include tensions in the Persian Gulf, as well as duties from the United States, which the White House constantly introduces. The situation with Brexit, which is now at an impasse, also does not give optimism. Let me remind you that the most likely candidate for the post of Prime Minister of Great Britain is Boris Johnson, who is a supporter of the tough Brexit. As for the technical picture of the EURUSD pair, it remained unchanged compared with the morning forecast. Further growth is unlikely to continue without the necessary downward correction. The 1.1400 level test was the key target of speculative players. Now, it is best to return to long positions for correction from the support of 1.1340 or for the rebound from a larger support range – 1.1310. The task of the buyers of risky assets this week will be a breakthrough above the resistance of 1.1400, which will lead the trading instrument to the area of highs: 1.1460 and 1.1540. The material has been provided by InstaForex Company - www.instaforex.com |
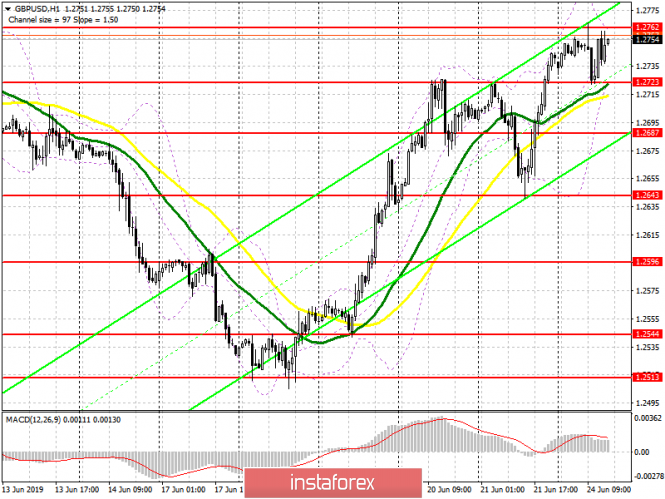
| GBP/USD: plan for the American session on June 24. Pound buyers will continue to make corrections Posted: 24 Jun 2019 07:17 AM PDT To open long positions on GBP/USD, you need: Today's correction to the area of the first support levels, as well as at the end of last week, allowed the buyers of the pound to retain the upward potential of the pair. However, as in the first half of the day, the target of the bulls remains a large resistance of 1.2762, the breakthrough of which will provide good support to buyers, which will lead to an update of the highs in the area of 1.2800 and 1.2860, where I recommend taking the profits. In the downward correction scenario, you can look at the long positions in the pound on the false breakout from the support of 1.2723 or on the rebound from the low of 1.2687, where the lower limit of the upward channel passes. To open short positions on GBP/USD, you need: Sellers of the pound will try to keep the pair above the resistance of 1.2762, as it was in the morning, but it will be quite difficult to do. Only the formation of a false breakout at this level will be a direct signal to open short positions based on a small downward correction to the support area of 1.2723 and 1.2687, where I recommend taking the profit. However, more interesting levels for selling GBP/USD today are seen at the highs of 1.2799 and 1.2858. Indicator signals: Moving Averages Trading is conducted above 30 and 50 moving averages, which indicates the preservation of the bullish market. Bollinger Bands If the pound falls, the support will be provided by the lower limit of the indicator around 1.2723.
Description of indicators
|
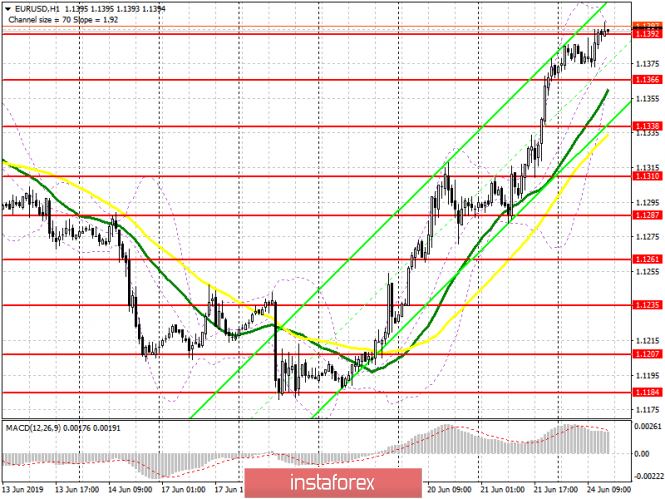
| EUR/USD: plan for the American session on June 24. 1.1395 at buyers' eye, but what to do next? Posted: 24 Jun 2019 07:17 AM PDT To open long positions on EURUSD, you need: Buyers have reached the resistance of 1.1392 and are now trying to gain a foothold on it, but whether the upward trend will continue above this level is a big question. Now, the bulls need to close the day above this range, and then we can expect further growth of EUR/USD to the highs in the area of 1.1427 and 1.1460, where I recommend taking the profit. In the scenario of returning to the support of 1.1392 in the second half of the day, you can look at long positions on a false breakout near the minimum of 1.136 or on a rebound from the support of 1.1338. To open short positions on EURUSD, you need: The big bears are on the sidelines. However, speculative sellers of the European currency will try to do everything to keep the bulls above the resistance of 1.1392, and the next false breakout and return to this level will be a signal to open short positions in the euro with the main purpose of the decline and the support test of 1.1366, where I recommend taking the profit. If the bulls find themselves and continue the growth of the EUR/USD, it is best to consider short positions on a rebound from the maximum of 1.1427. Indicator signals: Moving Averages Trading is conducted above 30 and 50 moving averages, which indicates the continuation of the bullish scenario. Bollinger Bands If the euro falls, support will be provided by the lower limit of the indicator in the area of 1.1366.
Description of indicators
|
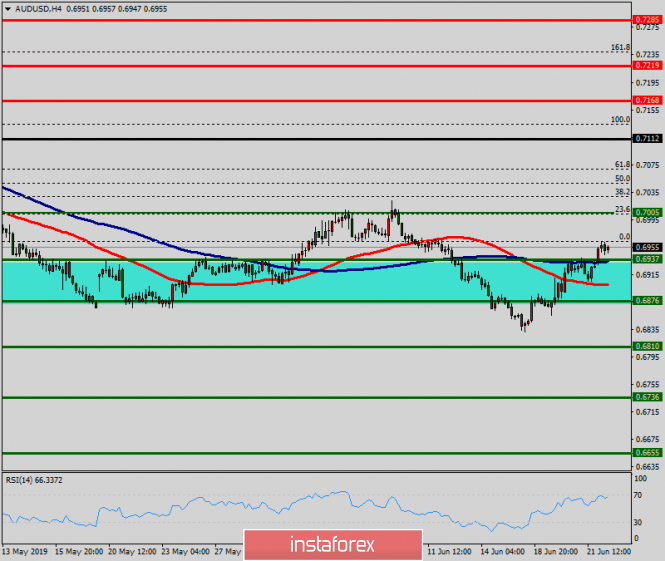
| Technical analysis of AUD/USD for June 23, 2019 Posted: 24 Jun 2019 04:31 AM PDT The AUD/USD pair is set above strong support at the levels of 0.6876 and 0.6810. This support has been rejected four times confirming the uptrend. The major support is seen at the level of 0.6810, because the trend is still showing strength above it. Accordingly, the pair is still in the uptrend in the area of 0.6810 and 0.6876. The AUD/USD pair is trading in the bullish trend from the last support line of 0.6876 towards thae first resistance level of 0.6937 in order to test it. This is confirmed by the RSI indicator signaling that we are still in the bullish trending market. Now, the pair is likely to begin an ascending movement to the point of 0.6937 and further to the level of 0.7005. The level of 0.7005 will act as the major resistance and the double top is already set at the point of 0.7005. At the same time, if there is a breakout at the support level 0.6810, this scenario may be invalidated. The material has been provided by InstaForex Company - www.instaforex.com |
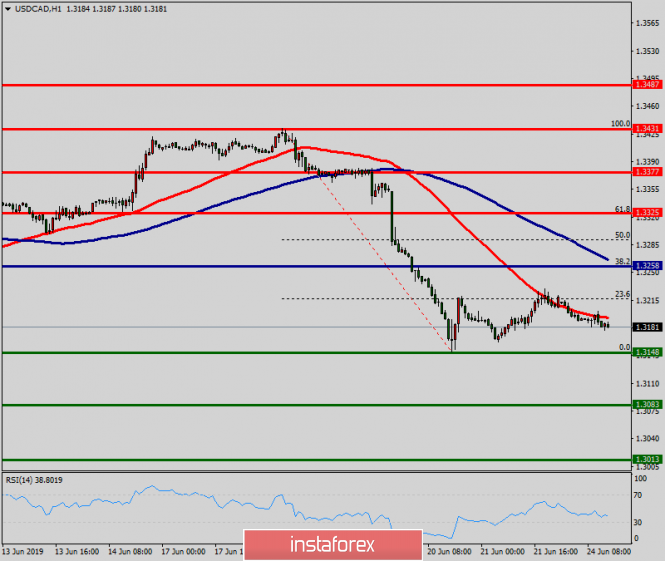
| Technical analysis of USD/CAD for June 23, 2019 Posted: 24 Jun 2019 04:27 AM PDT The USD/CAD pair continues to move downwards from the level of 1.3258. Last week, the pair dropped from the level of 1.3258 (this level of 0.9965 coincides with the double top) to the bottom around 1.3148. Today, the first resistance level is seen at 1.3258 followed by 1.3325, while daily support 1 is found at 1.3148. Also, the level of 1.3258 represents a weekly pivot point for that it is acting as major resistance/support this week. Amid the previous events, the pair is still in a downtrend, because the USD/CAD pair is trading in a bearish trend from the new resistance line of 1.3258 towards the first support level at 1.3038 in order to test it. If the pair succeeds to pass through the level of 1.3038, the market will indicate a bearish opportunity below the level of 1.3038 in order to continue towards the point of 1.3013. However, if a breakout happens at the resistance level of 1.3325, then this scenario may be invalidated. The material has been provided by InstaForex Company - www.instaforex.com |
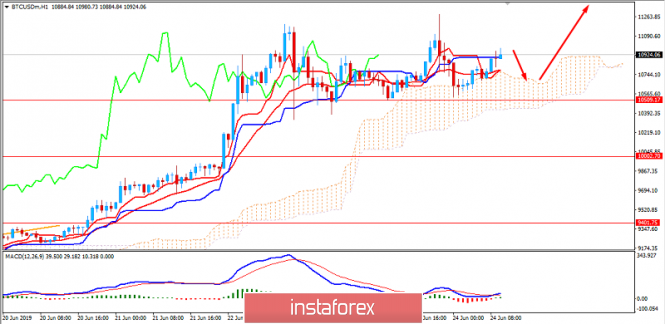
| BITCOIN settles above $10,500 area. June 24, 2019 Posted: 24 Jun 2019 04:05 AM PDT Bitcoin managed to break above $10,000 area with a daily close allowing the bullish bias to dominate in the market. After the non-volatile bullish breakout, Bitcoin managed to sustain the bullish momentum but currently consolidating above $10,500. Bitcoin reached a peak on Sunday at $11,246, as trading volumes picked up and reached $29 billion's equivalent per day over the weekend. Later, the activity subsided a bit, and Bitcoin traded at $10.681.38. Some investors have looked to bitcoin and other Cryptocurrencies as a hedge against possible declines in domestic currencies as the global trade tensions and economic unrest is being analyzed. In late March, Bitcoin broke out of a spell of limited price moves. It has since risen more than 160%, an ascent peppered by double-digit price swings that have reminded some of its retail investor-fueled 2017 bubble. Bitcoin's volatility has been a boon to larger investors such as hedge funds, and other investors searching for returns as central banks across the world lean towards lower interest rates. Bitcoin as safe-haven is expected to lead to further gains as the global economy struggle hikes. To sum up, the price is expected to push higher towards $11,000 and later towards $12,000 area. The price remains above $10,000-500 area while being held by the dynamic levels and Kumo Cloud as support. MACD lines are residing above 0.00 area with a Bullish Crossovers and signal of Bullish Divergence. It may indicate further upward thrust. SUPPORT: 10000, 10500 RESISTANCE: 11000, 11500, 12000 BIAS: BULLISH MOMENTUM: NON-VOLATILE
|


| You are subscribed to email updates from Forex analysis review. To stop receiving these emails, you may unsubscribe now. | Email delivery powered by Google |
| Google, 1600 Amphitheatre Parkway, Mountain View, CA 94043, United States | |
No comments:
Post a Comment