Forex analysis review |
- Fractal analysis of major currency pairs on June 26
- EUR/USD Rally: Further progress or decline?
- GBP/USD. June 25th. Results of the day. Boris Johnson opposes a second referendum
- EUR/USD. June 25th. Results of the day. Donald Trump: by hook or by crook
- AUD/USD. "Rollercoaster" for the Australian dollar and a price outpost of 0.7000
- EURUSD: The EU is ready to submit a special financial mechanism to circumvent US sanctions in order to preserve the Iranian
- Bitcoin analysis for June 25,.2019
- June 25, 2019 : GBP/USD Intraday technical analysis and trade recommendations.
- June 25, 2019 : EUR/USD demonstrates a short-term bearish pullback below 1.1400.
- Gold 06.25.2019 - Upper trendline held successfuly, possible drop
- GBP/USD 06.25.2019 - Downward cycle in play
- Gold risk reward ratio favors neutral positions
- EURUSD expectation to pull back remains
- Gold. June 25th. Trading system "Regression Channels". US dollar falls – gold becomes more expensive
- Oil. June 25th. Oil traders tend to buy "black gold," but it will depend on the news this week
- GBP/USD: plan for the US session on June 25. Buyers of the pound were unable to hold the resistance of 1.2762, which was
- EUR / USD plan for the US session on June 25. The euro correction is about to begin, but much depends on the Fed chairman's
- Brent goes to the path of war
- The dollar plummets against the euro, the yen talks of lowering rates
- BITCOIN heading towards $11,500 event area. June 25, 2019
- EURUSD: USD to regain ground ahead of GDP. June 25, 2019
- USD/JPY: USD to pullback against dominant JPY? June 25, 2019
- Swing oil prices reduce inventory
- Waiting for G20: AUD and NZD are preparing to resume the fall
- Any hint by J. Powell on lowering the rates will lower the dollar rate (We expect the EUR/USD pair to continue growing and
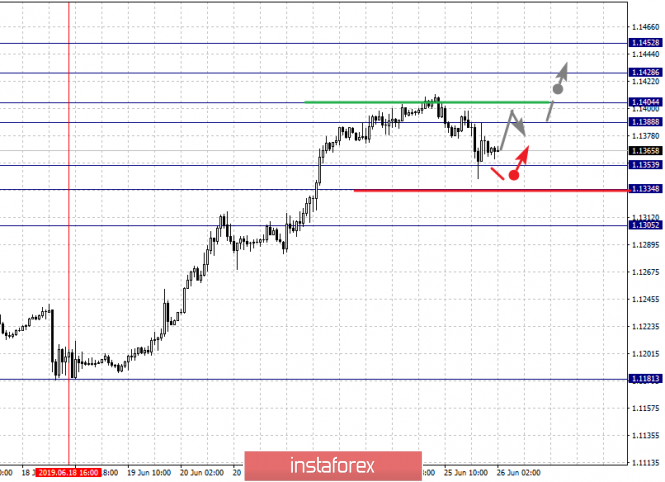
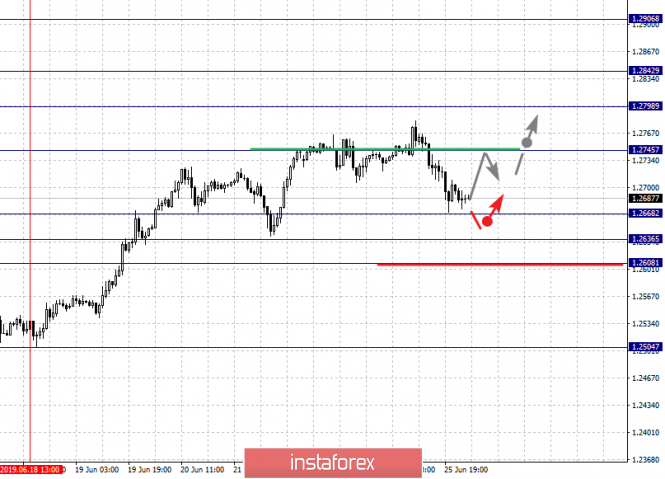
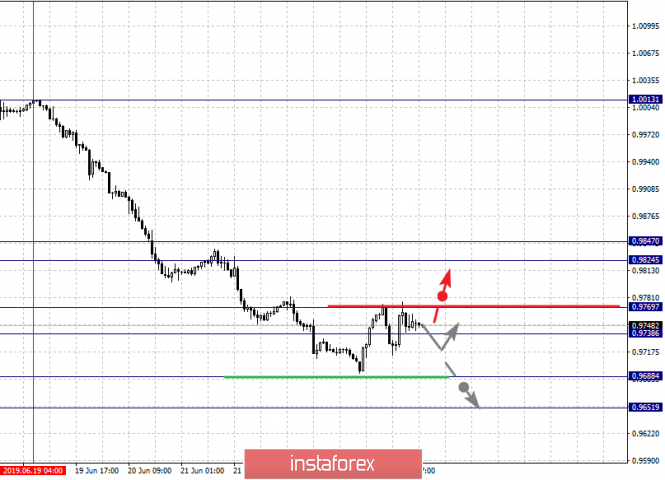
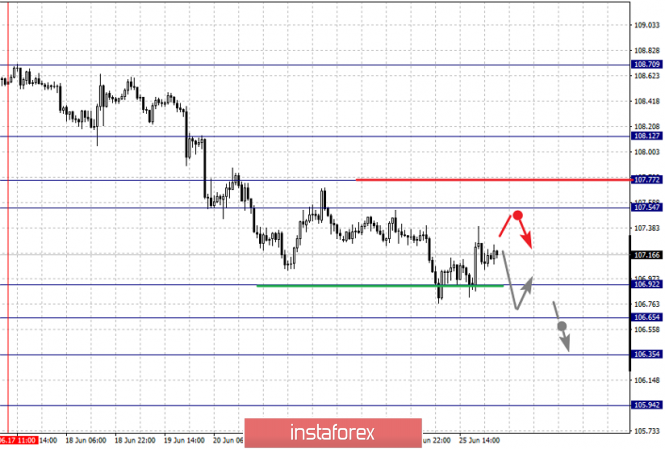
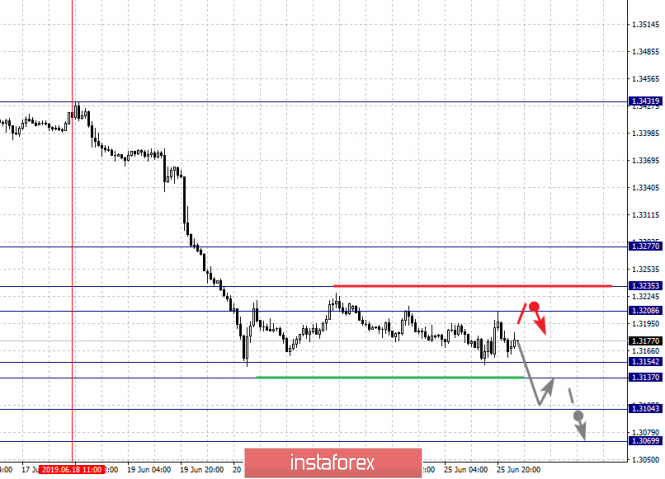
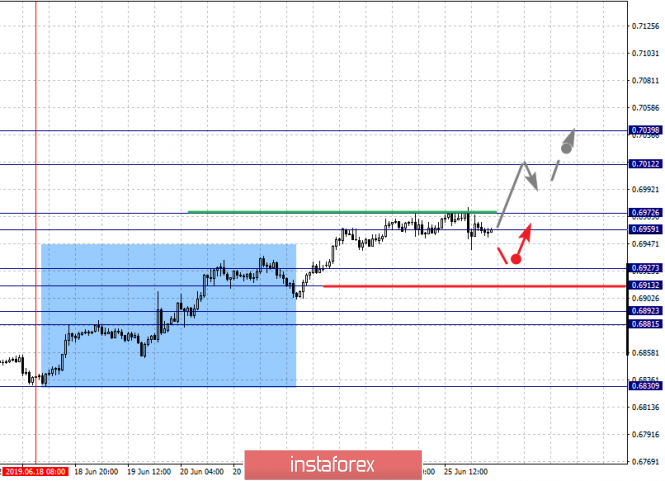
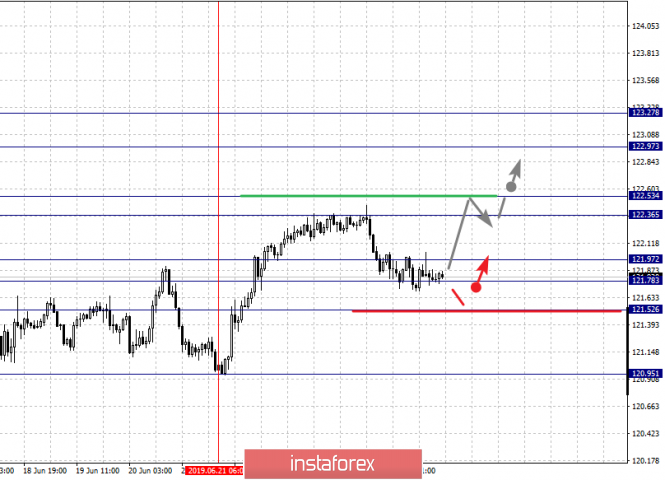
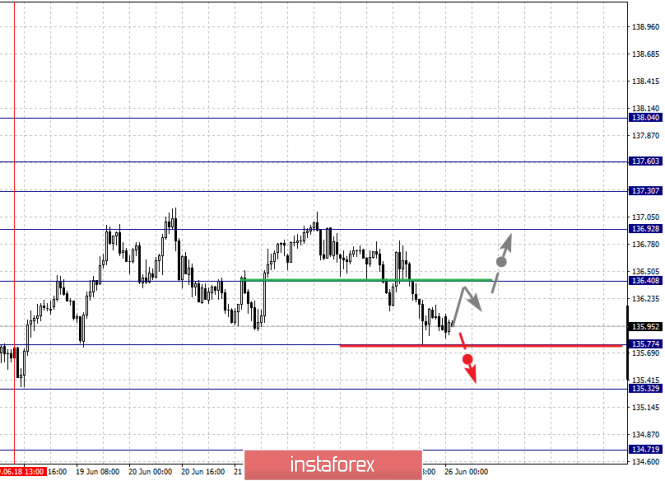
| Fractal analysis of major currency pairs on June 26 Posted: 25 Jun 2019 06:31 PM PDT Forecast for June 26: Analytical review of H1-scale currency pairs: For the euro / dollar pair, the key levels on the H1 scale are: 1.1452, 1.1428, 1.1404, 1.1388, 1.1353, 1.1334 and 1.1305. Here, we continue to follow the development of the ascending structure of June 18. At the moment, the price is in the correction. The continuation of the movement to the top is expected after the passage of the price of the noise range 1.1388 - 1.1404. In this case, the target is 1.1428, wherein consolidation is near this level. For the potential value for the top, we consider the level of 1.1452. After reaching which, we expect a departure to the correction. Short-term downward movement is possible in the range of 1.1353 - 1.1334. The breakdown of the latter value will lead to in-depth correction. Here, the goal is 1.1305. This level is a key support for the top. The main trend is the upward structure of June 18, the stage of correction. Trading recommendations: Buy 1.1405 Take profit: 1.1428 Buy 1.1430 Take profit: 1.1452 Sell: 1.1353 Take profit: 1.1335 Sell: 1.1332 Take profit: 1.1305 For the pound / dollar pair, the key levels on the H1 scale are: 1.2906, 1.2842, 1.2798, 1.2745, 1.2668, 1.2636 and 1.2608. Here, we are following the development of the ascending structure of June 18. We expect a continuation of the upward movement after the breakdown of the level of 1.2745. In this case, the first target is 1.2798. Short-term upward movement is possible in the range of 1.2798 - 1.2842. The breakdown of the latter value will lead to movement to the potential target - 1.2906. Upon reaching this level, we expect a rollback to the bottom. Short-term downward movement is expected in the range of 1.2668 - 1.2636. The breakdown of the last value will lead to a prolonged correction. Here, the target is 1.2608. This level is a key support for the top. The main trend is the ascending structure of June 18. Trading recommendations: Buy: 1.2745 Take profit: 1.2798 Buy: 1.2800 Take profit: 1.2842 Sell: 1.2668 Take profit: 1.2636 Sell: 1.2634 Take profit: 1.2608 For the dollar / franc pair, the key levels on the H1 scale are: 0.9847, 0.9824, 0.9769, 0.9738, 0.9688 and 0.9651. Here, we are following the development of the downward cycle of June 19. At the moment, the price is in the correction zone. The continuation of the movement to the bottom is expected after the breakdown of the level of 0.9688. Here, the potential target is 0.9651. Meanwhile, from the range of 0.9688 - 0.9651, we expect to go to the correction zone. Consolidated movement is possible in the range of 0.9738 - 0.9769. The breakdown of the latter value will lead to the development of a protracted correction. Here, the goal is 0.9824. The range 0.9824 - 0.9847 is a key support for the downward structure, and before it, we expect the initial conditions for the upward cycle. The main trend is the downward cycle of June 19, the stage of correction. Trading recommendations: Buy : 0.9738 Take profit: 0.9767 Buy : 0.9773 Take profit: 0.9824 Sell: Take profit: Sell: 0.9686 Take profit: 0.9653 For the dollar / yen pair, the key levels on the scale are : 108.12, 107.77, 107.54, 106.92, 106.65, 106.35 and 105.94. Here, the downward structure of June 17 is considered as a medium-term initial conditions. The continuation of the movement to the bottom is expected after the breakdown of the level of 106.92, here the target is 106.65. The breakdown of which, in turn, will allow us to count on the movement to the level of 106.35. Consolidation is near this value. For now, the potential value for the bottom, we considered the level of 105.94. After reaching which, we expect to go into correction. Short-term upward movement is possible in the range of 107.54 - 107.77. The breakdown of the latter value will lead to a prolonged correction. Here, the potential target is 108.12. This level is a key support for the downward structure. The main trend: the downward cycle of June 17. Trading recommendations: Buy: 107.55 Take profit: 107.76 Buy : 107.78 Take profit: 108.10 Sell: 106.92 Take profit: 106.65 Sell: 106.62 Take profit: 106.37 For the Canadian dollar / US dollar pair, the key levels on the H1 scale are: 1.3277, 1.3235, 1.3208, 1.3154, 1.3137, 1.3104 and 1.3069. Here, we are following the development of the downward structure of June 18. The continuation of the movement to the bottom is expected after the price passes the noise range 1.3154 - 1.3137. In this case, the target is 1.3104, wherein consolidation is near this level. For the potential value for the bottom, we consider the level of 1.3069. After reaching which, we expect a rollback to the top. Short-term upward movement is possible in the range of 1.3208 - 1.3235. The breakdown of the last value will lead to a prolonged correction. Here, the target is 1.3277. This level is a key support for the downward structure. The main trend - the downward structure of June 18. Trading recommendations: Buy: 1.3208 Take profit: 1.3233 Buy : 1.3237 Take profit: 1.3275 Sell: 1.3137 Take profit: 1.3106 Sell: 1.3102 Take profit: 1.3070 For the pair Australian dollar / US dollar, the key levels on the H1 scale are : 0.7039, 0.7012, 0.6972, 0.6959, 0.6927, 0.6913, 0.6892 and 0.6881. Here, we are following the development of the ascending structure of June 18. The continuation of the movement to the top is expected after the price passes the noise range 0.6959 - 0.6972. In this case, the target is 0.7012, wherein consolidation is near this level. For the potential value for the top, we consider the level of 0.7039. After reaching which, we expect a consolidation, as well as a rollback to the bottom. Short-term downward movement is possible in the range of 0.6927 - 0.6913. The breakdown of the latter value will lead to a prolonged correction. Here, the target is 0.6892. The range 0.6892 - 0.6881 is a key support for the top. The main trend is the upward structure on June 18. Trading recommendations: Buy: 0.6972 Take profit: 0.7012 Buy: 0.7014 Take profit: 0.7036 Sell : 0.6927 Take profit : 0.6914 Sell: 0.6910 Take profit: 0.6892 For the euro / yen pair, the key levels on the H1 scale are: 123.27, 122.97, 122.53, 122.36, 121.97, 121.78 and 121.52. Here, we are following the formation of the ascending structure of June 21. At the moment, the price is in correction. The continuation of the movement to the top is expected after passing by the price of the noise range 122.36 - 122.53. In this case, the goal is 122.97, wherein consolidation is near this level. For the potential value for the top, we consider the level of 123.27. After reaching which, we expect a rollback to the bottom. Consolidated movement is expected in the range of 121.97 - 121.78. The breakdown of the last value will lead to a prolonged correction. Here, the goal is 121.52. This level is a key support for the upward structure. The main trend is the formation of potential for the top of June 21, the stage of correction. Trading recommendations: Buy: 122.36 Take profit: 122.50 Buy: 122.56 Take profit: 122.95 Sell: 121.97 Take profit: 121.80 Sell: 121.76 Take profit: 121.52 For the pound / yen pair, the key levels on the H1 scale are : 138.04, 137.60, 137.30, 136.92, 136.40, 135.77 and 135.32. Here, we continue to monitor the formation of the potential for the top of June 18. The continuation of the movement to the top is expected after the breakdown of the level of 136.40. Here, the first goal is 136.92. The breakdown of which should be accompanied by a pronounced movement to the level – 137.30. Meanwhile, in the range of 137.30 – 137.60, there is a short-term upward movement, as well as consolidation. For the potential value for the top, we consider the level of 138.04. The movement to which, is expected after the breakdown of the level of 137.60. The level of 135.77 is a key support for the top. Its price passage will have to form a downward structure. Here, the potential target is 135.32. The main trend is the formation of potential for the top of June 18, the stage of deep correction. Trading recommendations: Buy: 136.45 Take profit: 136.90 Buy: 136.92 Take profit: 137.30 Sell: 135.75 Take profit: 135.40 Sell: 135.28 Take profit: 134.75 The material has been provided by InstaForex Company - www.instaforex.com |
| EUR/USD Rally: Further progress or decline? Posted: 25 Jun 2019 04:42 PM PDT The euro quite quickly overcame the highs one after another when paired with the dollar. The "news" so hastily climbed up that they did not pay attention to the deterioration of the German business climate and did not take into account the fact that the German economy is in a depressed state. On Tuesday, market participants still looked at the gloomy data from France, and the euro stopped its growth. Although the reason, perhaps, was not a report on production activity, but the dollar itself, which, closer to the second half of the day, made attempts at recovery. According to the Dallas Federal Reserve, the uncertainty about trade wars and global growth really creates headwinds for the US economy. At the same time, it is too early to talk about monetary easing. The derivatives market is confident of a 25bp decrease in the rate at the July meeting and gives 45% to the fact that the rate will be reduced by 50bp It is clear that someone is mistaken, but who? According to Donald Trump, the Fed is mistaken, and also does not know what it is doing. The US president attacked Jerome Powell with a new criticism after a short break. Trump compared the Fed with a stubborn child, and if it were not for the regulator, then the Dow Jones could have been thousands of points higher, and GDP could be accelerated to 4% or even 5%. There was a time when the markets were in a fever from such statements, now they have developed immunity. However, it's hard not to admit thatTrump's persistent desires will come to life sooner or later. The US president has set a goal to lower rates and weaken the dollar, and he also wants to stock markets to rally. The S&P 500 is at the highest level in the entire history, FOMC members admit monetary policy adjustments, and the dollar index for the week by June 21 showed the worst performance since January last year. As for the possible rate cut at the July meeting, on Tuesday the picture should become clearer. Traders are waiting for Jerome Powell's speech as well as those of his colleagues. High-ranking financial officials will comment on policy easing. Meanwhile, the euro's confident pace leads to a plethora of bullish forecasts. The assumption that the US central bank will begin to cut rates more aggressively than the ECB allows JP Morgan analysts to expect the EUR/USD rate to rise to 1.15. Nordea expects the main pair to approach the level of 1.17 by the end of the year. In addition, the bank seriously believe in the stabilization of macroeconomic statistics for the eurozone. In Bloomberg, we saw that the course of the pair forms a "bullish" model. Ahead of the single currency key resistance in the area of 1.1380 and 1.1416. A break through of these marks will mean that the euro is able to re-test the highs of the current year. There will be growth potential to double the top of 2018 in the area of 1.1815–54. If we talk about the trade conflict between the US and China, the markets are waiting for tips from the G20 summit. From further confrontation, including imposing duties on all Chinese imports, protective assets will be in an advantageous position. At this time, the correction of stock indices will be restrained by belief in an aggressive weakening of the Fed policy in July. A breakthrough in the negotiations will boost the US dollar due to the growth in yield of Treasuries. The absence of a deal and at the same time waiting for its conclusion in the near future will lead to a short-term consolidation of the EUR/USD pair. USD/JPY Barclays believes that the likelihood of the resumption of the US-China talks is already priced in. The yen rose to its highest level since January, and Treasury bills rose after Iran announced the end of diplomatic relations with the United States, as America introduced new sanctions. The USD/JPY rate fell below 107 on Tuesday, the next target could be 106.60. Potentially, there are risks for the pair to decrease to 106 and even to the lowest of that of the flash-crash of this year - below 105. The recovery potential of the USD/JPY pair quotes is limited, since many players are prepared to sell. The dollar is likely to decline, unless markets notice positive changes in the Washington and Beijing talks. The material has been provided by InstaForex Company - www.instaforex.com |
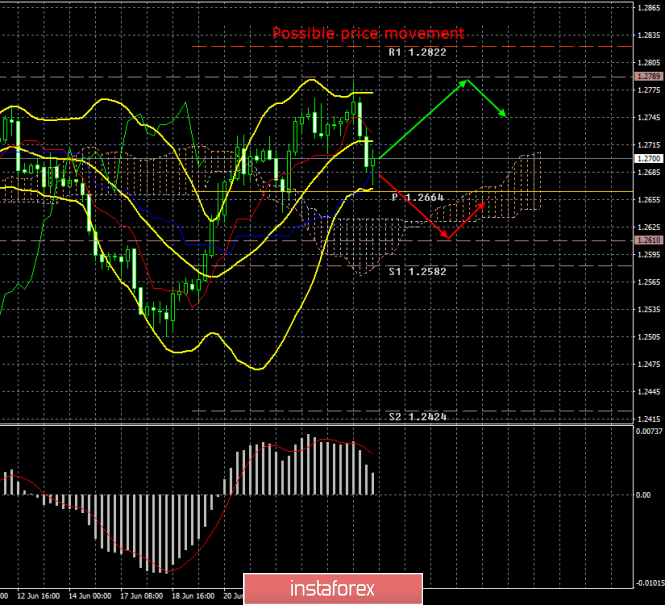
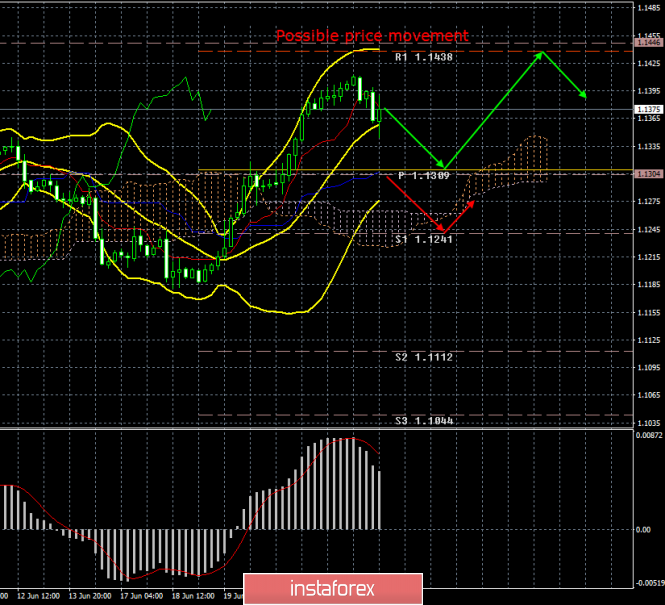
| GBP/USD. June 25th. Results of the day. Boris Johnson opposes a second referendum Posted: 25 Jun 2019 04:30 PM PDT 4-hour timeframe The amplitude of the last 5 days (high-low): 59p - 131p - 96p - 104p - 59p. Average amplitude for the last 5 days: 90p (93p). On Tuesday, June 25, the British pound sterling also started to adjust, and the pound/dollar pair worked off the Kijun-sen critical line. Meanwhile, the main candidate for the post of the Conservative Party leader and British prime minister Boris Johnson said that he would lead the country out of the EU before November 1, and no matter in what way. That is, Johnson is mentally prepared for a "hard" Brexit and states that the British government must keep the promise it made to the people. Labour Party leader Jeremy Corbyn is in favor of holding a second referendum, because he believes that negotiations with the EU are stalled, the current agreement does not suit most MPs, a hard Brexit will be destructive for the economy. Parliament rejects May's "deal" and the hard scenario. Johnson also believes that if the new prime minister cannot "translate the dream into reality," that is, implement Brexit before October 31, the consequences will be devastating for both the Conservative Party and the UK. Watching developments in the UK is thus becoming more and more interesting. The pound sterling is the only thing that is sad, which could return to a downward low tomorrow if bears manage to push the critical line on the first attempt. All the chances for this are available. If Jerome Powell doesn't stun the markets with yet more dovish messages tonight, then the pound will not have any special grounds for further growth. Trading recommendations: The pound/dollar currency pair started the downward correction, keeping the upward trend. Thus, the rebound from the Kijun-sen line will make it possible to buy the pound again with the target level of 1.2789. It will be possible to buy the US currency when the pair has consolidated below the Kijun-sen line. In this case, the downward trend may resume with the first targets at the levels of 1.2610 and 1.2582. In addition to the technical picture should also take into account the fundamental data and the time of their release. Explanation of the illustration: Ichimoku indicator: Tenkan-sen - the red line. Kijun-sen - the blue line. Senkou Span A - light brown dotted line. Senkou Span B - light purple dotted line. Chikou Span - green line. Bollinger Bands indicator: 3 yellow lines. MACD Indicator: Red line and histogram with white bars in the indicator window. The material has been provided by InstaForex Company - www.instaforex.com |
| EUR/USD. June 25th. Results of the day. Donald Trump: by hook or by crook Posted: 25 Jun 2019 04:18 PM PDT 4-hour timeframe The amplitude of the last 5 days (high-low): 62p - 67p - 92p - 95p - 37p. Average amplitude for the last 5 days: 71p (72p). The presidency of Donald Trump began with the fact that he regularly declared the "high cost" of the national currency, that is, the dollar. During the first year of his presidential term, we often heard that the "dollar" was too expensive. Later phrases began to appear that the "expensive" dollar makes it difficult to service the national debt, even later, that many countries deliberately underestimate the course of their monetary units in order to gain an advantage in trade relations with the United States, even later - Trump launched several trade wars and began to blame the Federal Reserve and Jerome Powell in raising the key rate too quickly, which led to an even greater increase in the US currency. And now Jerome Powell sends signals to the market that the Fed is ready to lower its key rate in 2019. Is this the victory of Donald Trump? If yes, then it's very doubtful. After all, now the rate will go down after it has risen to 2.5%. Yes, the dollar has dropped in the last few weeks, but before that it had been growing for several years. Yes, the rate can be lowered, but it still remains higher than that of the ECB or Bank of England. Yes, Trump got his way, but when: in a few years? And the Fed as it was independent of Trump, and will remain so, and if macroeconomic statistics will no longer disappoint, then the Fed can abandon the easing of monetary policy. Today, the US currency began to rise in price from the middle of the European trading session. Perhaps due to the fact that a technical correction has come, perhaps on the eve of Jerome Powell's speech, who is not expected to make new dovish comments on monetary policy. Either way, the euro/dollar began to decline to a critical line, and a rebound from it could trigger a resumption of an upward trend, and to overcome it - the beginning of a new downward trend. Trading recommendations: The EUR/USD pair started to adjust. Thus, long positions remain relevant for the euro/dollar pair with a target of 1.1438, and an upward reversal of MACD or a rebound from the Kijun-sen line will indicate the completion of the downward correction. It will be possible to sell the euro/dollar pair if bears manage to gain a foothold below the critical line, with the first goal of 1.1241. In this case, the initiative for the EUR/USD pair may return to the bears' hands. In addition to the technical picture should also take into account the fundamental data and the time of their release. Explanation of the illustration: Ichimoku indicator: Tenkan-sen - the red line. Kijun-sen - the blue line. Senkou Span A - light brown dotted line. Senkou Span B - light purple dotted line. Chikou Span - green line. Bollinger Bands indicator: 3 yellow lines. MACD Indicator: Red line and histogram with white bars in the indicator window. The material has been provided by InstaForex Company - www.instaforex.com |
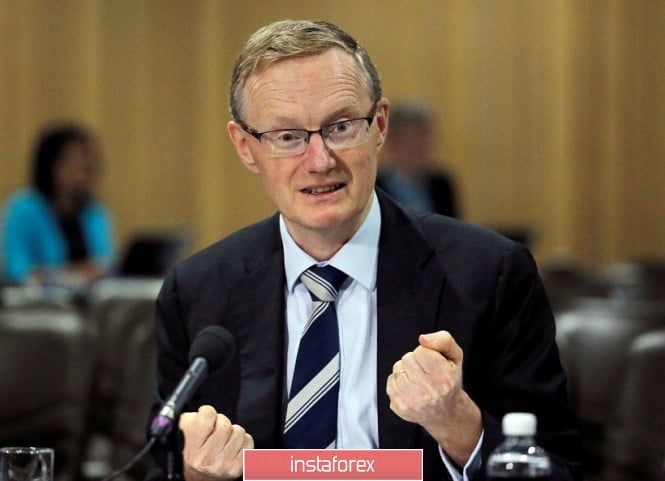
| AUD/USD. "Rollercoaster" for the Australian dollar and a price outpost of 0.7000 Posted: 25 Jun 2019 04:01 PM PDT The Australian dollar updated its annual low against the US currency last week, dropping to the 68th figure. However, the pair turned and moved up. After several days of growth, the aussie has come to the key resistance level of 0.7000. For many months, bears of the pair tried to push this level through, and now the bulls face a similar task - only they need to break through this target, on the contrary - from the bottom up. Before assessing the chances of a recovery of AUD/USD, it is necessary to understand the reasons for its short-term decline. The aussie updated its 2.5-year low on June 18, that is, on the eve of the last Fed meeting. After a series of positive macroeconomic releases, the dollar bulls have hopes to maintain a wait-and-see position on the part of the Fed. These hopes were not justified, after which the US currency began to swoop down in the entire market. However, on the eve of the June meeting, the greenback felt quite confident, having a corresponding impact on quoted currencies. However, the Australian dollar was also declining for its own reasons after the resonant statements of the head of the RBA, Philip Lowe. Earlier this week, he said that a one-time reduction in the rate to a record low of 1.25% would not be enough to stimulate economic growth. By this, he confirmed the market's concerns regarding the future actions of the Australian regulator. In particular, currency strategists at Westpac (one of the largest banks in Australia) said in the spring that the RBA would cut rates twice or even three times this year. After the relevant comments of Lowe, it became clear that the sounded scenario may well come true. Against the background of such prospects, the AUD/USD pair could have fallen lower than last week's trough (0.6835), if not for the subsequent events. First is the Fed meeting. The outcome of the June meeting put an end to the greenback's rally: the US dollar weakened throughout the market, and even in tandem with the Australian currency, it showed its vulnerability. Secondly, the Australian dollar has received support from the commodity market. The cost of iron ore continues to exceed $100 per ton (currently $ 107) amid fears of a global shortage of raw materials. In early June, Chinese futures for iron ore on the Dalian Commodity Exchange rose by almost 5%, that is, to $110 per ton - this is the highest value in the past 6 years. Quotes jumped to the highest levels after Brazilian authorities announced an extension of the suspension of the mine at Vale in Minas Gerais. Let me remind you that Vale is the world's largest mining company (along with the BHP Group). In January of this year, a dam broke at one of the company's mines: the incident led to the death of 231 people. After this tragedy, the Brazilian court suspended the work of the mine, and local authorities initiated inspections of all mines in the country. As a result of this audit, inspectors identified 5 BHP dams with an extremely high threat to the environment in the event of a breakthrough. These circumstances, according to experts, will keep a shortage of raw materials not only in this, but also in the next year. It should be noted that the Australian economy is quite keenly aware of such "tectonic shifts" in the assessment of strategically important raw materials, given that Australia exports mainly iron ore, copper and coal. Therefore, the recent developments in the commodity market have provided significant support to the aussie. Surprising and the inconsistent position of the head of the RBA, Philip Lowe. After the frankly "dovish" comments, he unexpectedly changed his mind and at the beginning of this week and questioned the effectiveness of reducing interest rates in the context of "universal monetary policy easing," apparently referring to the Fed's intentions. Despite the fact that this comment looks very strange (especially against the background of his recent statements of the opposite nature), traders interpreted it in their own way as a signal to the wait-and-see position of the RBA. This factor served as an additional reason for the Australian dollar's growth, which eventually strengthened throughout the market, and came into the area of the key resistance level of 0.7000 when paired with the greenback. Although the overall fundamental picture has now developed in favor of the Australian dollar, the fate of its further growth depends on the outcome of the G20 summit. The Fed is unlikely to change its position regarding the interest rate. Taking into account the 100% probability of its decline in July, the regulator is unlikely to make a different decision. But the Reserve Bank of Australia can adjust its rhetoric, focusing on both the trade relations between China and the United States in general, and the dynamics of the Chinese economy in particular. Therefore, the resolution of the question of breaking through the key mark of 0.7000 is expected at the end of the trading week - naturally, if the leaders of the United States and China complete the dialogue on a positive note. All other fundamental factors will play only a supporting role. The material has been provided by InstaForex Company - www.instaforex.com |
| Posted: 25 Jun 2019 03:51 PM PDT Passions around Iran and the US are heating up. This morning it became known that yesterday the US president signed a decree on sanctions against the leader of the Islamic Republic, Ayatollah Ali Khamenei, which is also directed against other leaders of the country associated with the supreme leader. It is also expected that sanctions against Iranian Foreign Minister Javad Zarif will be imposed soon. All this only aggravates the conflict and, ultimately, can lead to the rupture of diplomatic relations. Iranian authorities drew attention to this fact, saying that the sanctions against the leader of the Islamic Republic close the possibilities for diplomacy and threaten world stability, hinting at a high probability of military conflict. Let me remind you that last week an American reconnaissance drone was shot down in the Gulf of Oman. Also, the United States accuses Iran of attacking oil tankers that occurred even earlier. Today, the White House's national security adviser, John Bolton, called on Iran to discuss a new, broader agreement that could replace the 2015 nuclear agreement. I recall that the White House administration withdrew from the transaction in May last year, but other countries remained in it, including the EU countries. In this regard, Iran has repeatedly appealed to the EU to ignore the sanctions imposed by the United States and to comply with the deal, which was concluded in 2015. Up to this point, the EU representatives ignored the appeal of the leader of the Islamic Republic, but today the EU representative Federica Mogherini said that the European Union is ready to launch a special financial mechanism to circumvent the US sanctions against Iran. She also noted that the EU authorities are doing everything in their power to complete the transaction on the Iranian nuclear program. As for the fundamental statistics, which was released in the first half of the day for the euro area, then it is worth noting the deterioration of sentiment in the manufacturing sector in France, which is not surprising given the current problems associated with trade relations in foreign markets. The decline in the activity of this sector directly influenced the optimism of company executives, among whom the survey was conducted. According to the statistics agency Insee, the French business sentiment index dropped to 102 points in June 2019, compared with 104 points in May. Economists predicted that the figure will not change in June compared with May. As for the technical picture of the EURUSD pair, it remained unchanged. The demand for the euro is extremely low, indicating a possible reduction in the pair before the speech of the president of the Federal Reserve, from whom everyone is waiting for a direct statement on the subject of lowering interest rates. Even if this does not follow, it is unlikely that major players will give up risky assets, and with any good correction will open long positions. Good levels to buy are seen in the 1.1350 and 1.1320 area. The material has been provided by InstaForex Company - www.instaforex.com |
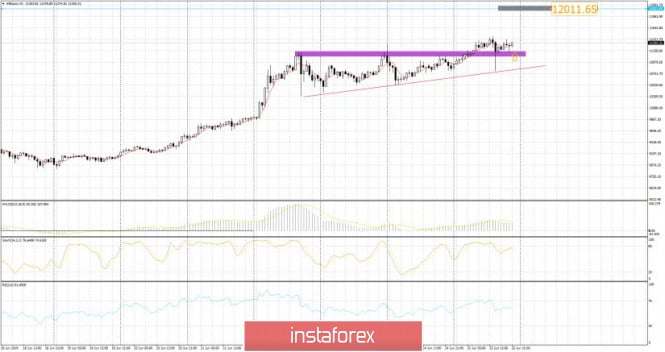
| Bitcoin analysis for June 25,.2019 Posted: 25 Jun 2019 12:02 PM PDT BTC has been trading upwards and there is the breakout of the horizontal trading range. My advice is to watch for buying opportunities. The projected upward target is set at the price of $12.000
Purple rectangle – important support Gray rectangle – projected target Red line – Upward most recent trend line I found breakout of the ascending triangle on the H1 time-frame, which is sign that buyers are in control and you should watch for buying opportunities. MACD oscillator is in positive territory and the RSI and Stochastic are showing strong reading above 50 level. My bullish view will be negated if the BTC trades below $10.850. The projected upward target based on ascending triangle pattern is set at the price of $12.00. The material has been provided by InstaForex Company - www.instaforex.com |
| June 25, 2019 : GBP/USD Intraday technical analysis and trade recommendations. Posted: 25 Jun 2019 10:02 AM PDT
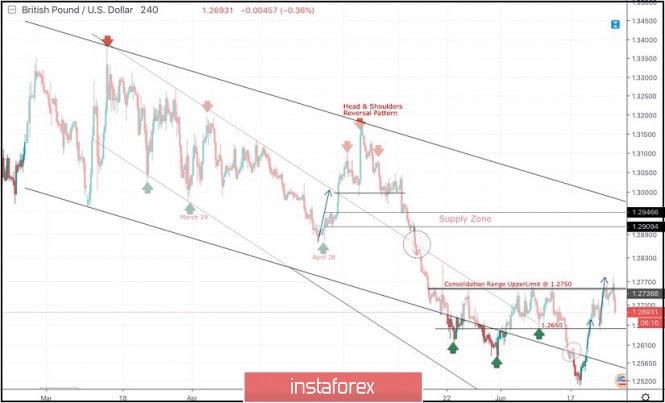
On April 26, another bullish pullback was initiated towards the price zone of 1.3130-1.3170 (the upper limit of the movement channel) where the depicted bearish Head and Shoulders reversal pattern was demonstrated on the H4 chart with neckline located around 1.2980-1.3020. Bearish breakdown below 1.2980 allowed the recent significant bearish movement to occur towards the lower limit of the long-term channel around (1.2700-1.2650) where temporary bullish rejection was expressed. Shortly after, temporary bullish breakout above 1.2650 was demonstrated for a few trading sessions. This enhanced the bullish side of the market towards 1.2750 which prevented further bullish advancement. However, recent temporary bearish decline was demonstrated below 1.2600 hindering the mentioned bullish scenario for some time before bullish breakout could be achieved earlier last week. For the bullish side of the market to remain dominant, bullish persistence above 1.2750 (consolidation range upper limit ) should be achieved by the bulls. Bullish breakout above 1.2750 brings further bullish advancement towards 1.2840 and 1.2900. Recently, the GBP/USD failed to establish a successful bullish breakout above 1.2750. Instead, early signs of bearish rejection have been manifested (Bearish Engulfing H4 candlestick). A quick bearish pullback towards 1.2650 should be expected shortly. For conservative traders, SELL positions shouldn't be considered around the current price levels unless bearish breakout below 1.2570 becomes confirmed on higher timeframes (which is low probability). Trade Recommendations: Intraday traders can have a valid BUY Entry upon bullish breakout above 1.2750. T/P levels to be located around 1.2840, 1.2900 and 1.2940. S/L should be placed below 1.2680. The material has been provided by InstaForex Company - www.instaforex.com |
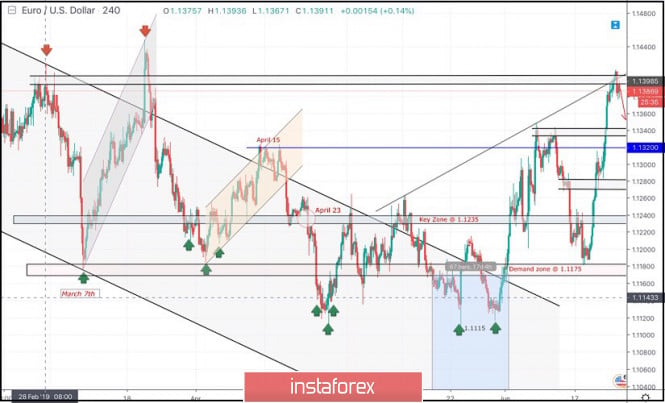
| June 25, 2019 : EUR/USD demonstrates a short-term bearish pullback below 1.1400. Posted: 25 Jun 2019 09:51 AM PDT
Since February 28, the EURUSD pair has been moving within the depicted channel with slight bearish tendency. Short-term outlook turned to become bearish towards 1.1175 (a previous weekly bottom which has been holding prices above for some time. On the period between May 17th and June 5th, a bearish breakdown below 1.1175 was temporarily achieved. As expected, further bearish decline was expected towards 1.1115 where significant bullish recovery was demonstrated bringing the EUR/USD pair back above 1.1175 demonstrating a significant bullish breakout off the depicted bearish channel. Although Temporary Bullish breakout above 1.1320 was initially demonstrated (suggesting a high probability bullish continuation pattern), Recently, The EURUSD pair has failed to maintain bullish persistence above 1.1320 and 1.1280 (the depicted price levels/zones). This was followed by a quick breakdown below the next key-zone around 1.1235. This triggered a deeper bearish pullback towards 1.1200-1.1175 where significant bullish price action was demonstrated. Currently, the EURUSD looks overbought facing a confluence of supply levels around 1.1400. Thus, a bearish pullback at least towards 1.1340 should be anticipated. On the other hand, Intermediate-term outlook remains bullish as long as bullish persistence above 1.1340 (Demand-Zone) and 1.1280 (Demand-Zone) is maintained on the H4 chart. A valid BUY entry was recently suggested upon the recent bullish breakouts above 1.1235 and 1.1320. Both are running in profits. Stop Loss should be raised to 1.1270 to secure more profits. Trade recommendations : For Intraday traders, a counter-trend SELL entry can be considered anywhere around 1.1400. Initial Target levels to be located around 1.1340 - 1.1320. Bullish breakout above 1.1400 invalidates this bearish pullback scenario. The material has been provided by InstaForex Company - www.instaforex.com |
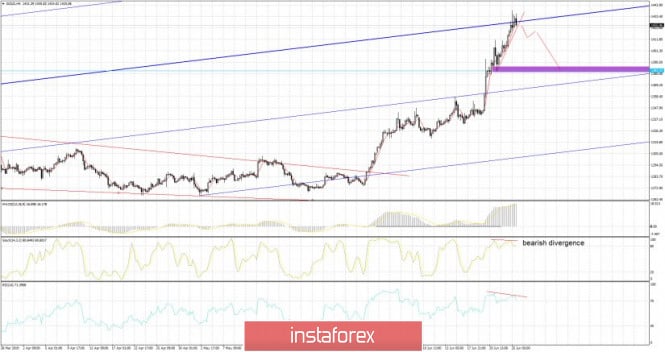
| Gold 06.25.2019 - Upper trendline held successfuly, possible drop Posted: 25 Jun 2019 09:47 AM PDT Gold has tested and rejected from our major parallel resistance at the price of $1.436. In my opinion gold is in big extended run and downward correction is very likely to happen in next period. Watch for selling opportunities.
Blue lines – Pitchfork upward channel Purple rectangle – Support 1 Red line – Upward most recent trend line Gold did consolidation for few hours near my upper parallel Pitchfork line (resistance), which is good sign that buyers are exhausted and that drop my come. The level of $1.438 is key resistance for the gold and as long as the Gold is trading below, you should watch for selling opportunities. Stochastic oscillator and RSI showed us bearish divergence, which is another sign that buyers lost momentum. The breakout of the upward tendline (redline) would confirm further downside. Downward target is set at the price of $1.382. The material has been provided by InstaForex Company - www.instaforex.com |
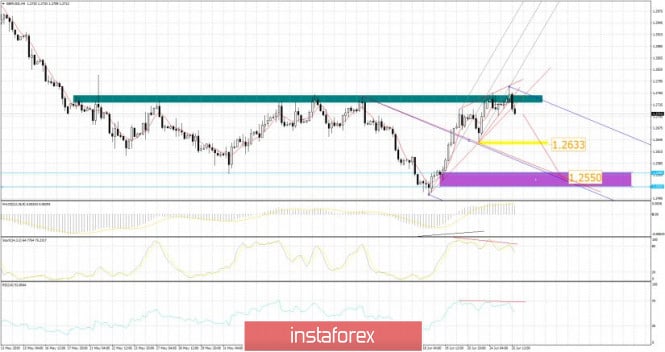
| GBP/USD 06.25.2019 - Downward cycle in play Posted: 25 Jun 2019 09:28 AM PDT BTC price has tested the strong resistance at the price of 1.2759 and it go rejected. This is for me strong sign that buyers don't have power for any larger upward, which is great for further downside. Watch for selling opportunities on the rallies.
Green rectangle – multi swing high resistance Yellow rectangle- Support 1 Purple rectangle – Median channel line projection Blue lines – Pitchfork downward channel Red lines – Broken rising wedge GBP/USD did break rising wedge after the fail test of the important resistance at 1.2759, which caused the GBP to drop. For me, this is strong indication that at least on the short term prospective, we might see downward movement. I placed Pitchfork channel to identify the potential target zone and I found the supports at 1.2533 and main ML according to current down channel at 1.2550. As long as the GBP is trading below the 1.2759, you should watch for selling opportunities. Stochastic and RSI oscillator are showing the bearish divergence, which is another sign of the weakness on the GBP, The material has been provided by InstaForex Company - www.instaforex.com |
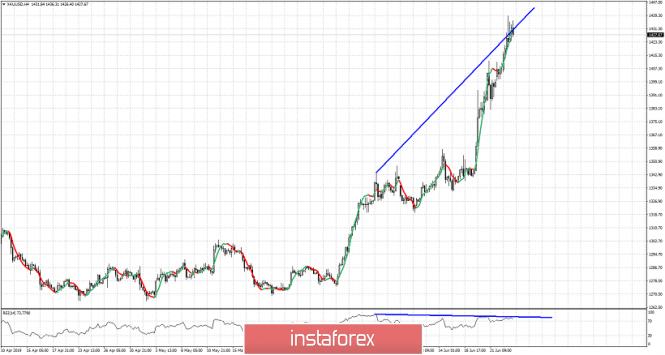
| Gold risk reward ratio favors neutral positions Posted: 25 Jun 2019 08:54 AM PDT Gold price has moved closer to our $1,440-50 target area of 161.8% Fibonacci extension. Price reached $1,439 but we now observe some warning signs in the RSI. This is not the time to be opening long positions. This is the time to take profits, raise stops or remain neutral.
In the 4 hour chart of Gold, we observe that the RSI is not making higher highs as price does. This is not a reversal signal but a warning signal for bulls. Risk reward does not favor opening new long positions. The rise in price is almost vertical. This kind of price moves is usually followed by pull backs towards previous consolidation levels. This means that we could see Gold price pull back towards $1,400 before continuing higher. That is why I prefer to be neutral or take profits or raise stops if long. The material has been provided by InstaForex Company - www.instaforex.com |
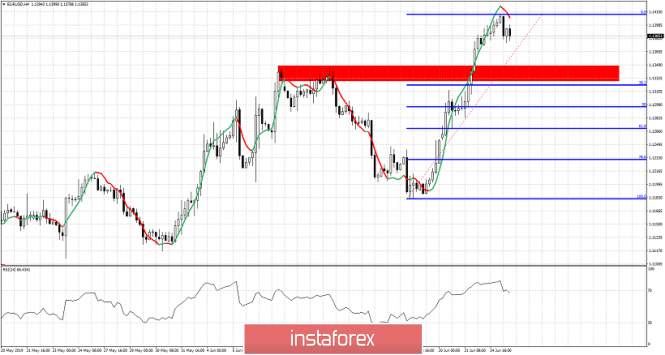
| EURUSD expectation to pull back remains Posted: 25 Jun 2019 08:48 AM PDT As we explained in our last analysis, EURUSD is showing short-term overbought signs and at least a short-term pull back is expected. EURUSD has given us very bullish signs over the previous sessions by recapturing 1.13-1.1350 resistance.
EURUSD is showing short-term reversal signs. I expect EURUSD to continue its pull back towards the red rectangle support area and the 38% Fibonacci retracement of the last leg higher. Price could even fall towards the 61.8% Fibonacci retracement in order to form a higher low before continuing higher towards 1.17 which is our medium-term target. We remain bullish EURUSD. The material has been provided by InstaForex Company - www.instaforex.com |
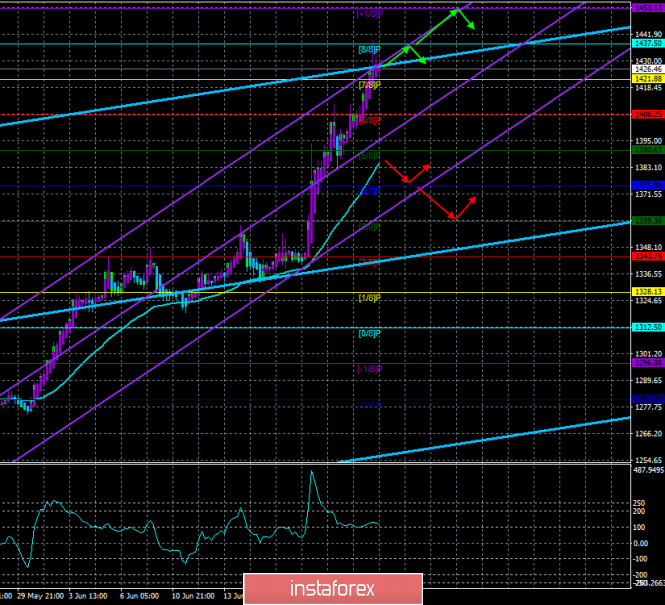
| Gold. June 25th. Trading system "Regression Channels". US dollar falls – gold becomes more expensive Posted: 25 Jun 2019 07:06 AM PDT 4-hour timeframe
Technical data: The upper linear regression channel: direction – up. The lower linear regression channel: direction – up. The moving average (20; smoothed) – up. CCI: 114.7640 Gold from May 30 rises in price continuously. For almost a month, the most famous drag metal managed to rise from $1,280 to $1,425. And the main culprit of this growth in gold prices is the US dollar, which in recent weeks has become cheaper on all fronts. Thus, it is not gold that is rising in price, and the US dollar is getting cheaper, which is reflected in the growth of gold prices. Accordingly, the further dynamics of the precious metal will be 90 percent dependent on the US dollar, US macroeconomic statistics and the Fed's actions. If the Fed confirms (first) its intention to soften monetary policy, and then moves from words to action, it is likely to cause new sales of the US currency, the demand for it will drop, even more, the price will fall, and gold will rise. However, it is impossible to put all the blame only on the US dollar. After all, gold has repeatedly shown growth and in the absence of a fall in the dollar. We should not forget about the speculative factor, geopolitical risks and traders' appetite for risky transactions and purchases of risky currencies. Now, gold continues to grow, as evidenced by all technical indicators, including Heiken Ashi (intraday) and ending with the moving average and two channels of linear regression. Thus, we recommend to continue buying gold as long as the upward trend remains. Nearest support levels: S1 – 1421.88 S2 – 1406.25 S3 – 1390.63 Nearest resistance levels: R1 – 1437.50 R2 – 1453.13 R3 – 1468.75 Trading recommendations: Gold continues to move up. Thus, it is recommended to trade for an increase with the goals of 1437.50 and 1453.13 before the reversal of the indicator Heiken Ashi down. Orders for sale will become relevant not earlier than traders to overcome the Moving Aim with targets at 1375.00 and 1359.38. In addition to the technical picture should also take into account the fundamental data and the time of their release. Explanation of illustrations: The upper linear regression channel – the blue line of the unidirectional movement. The lower linear regression channel – the purple line of the unidirectional movement. CCI – the blue line in the indicator window. The moving average (20; smoothed) is the blue line on the price chart. Murray levels – multi-colored horizontal stripes. Heiken Ashi is an indicator that colors bars in blue or purple. The material has been provided by InstaForex Company - www.instaforex.com |
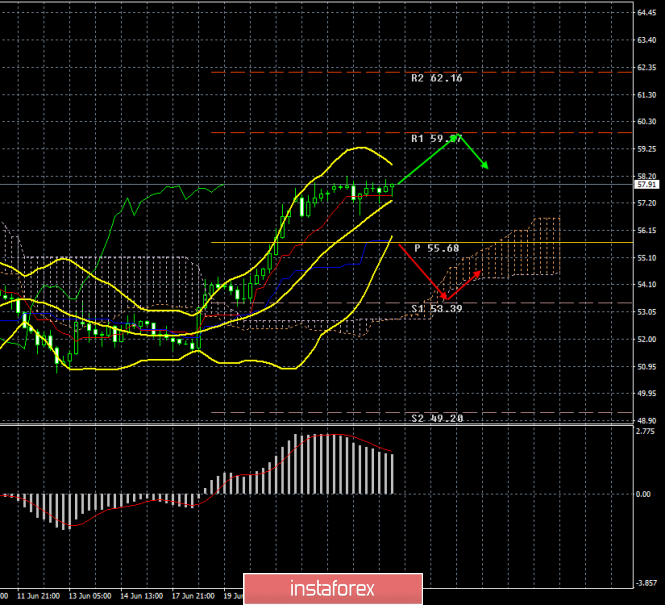
| Oil. June 25th. Oil traders tend to buy "black gold," but it will depend on the news this week Posted: 25 Jun 2019 07:06 AM PDT 4-hour timeframe
In the last two weeks, oil of all sorts has increased in price. As usual, there are plenty of factors influencing oil pricing. The main factor, in our view, is the weakening of the US dollar on all fronts, caused by weak macroeconomic statistics in recent weeks, as well as the "dovish" attitude of many members of the FOMC Committee. At the same time, the continuing geopolitical tensions between the States and Iran should be noted, which significantly reduces the supply of oil on world markets. But on the other hand, the trade war between the States and China reduces the demand for "black gold". Thus, some factors that affect the cost of oil, neutralize each other. At the beginning of the new trading week, oil prices stand still. In principle, we can assume that traders are hiding and waiting for the results of the OPEC meeting and the G20 summit. At the OPEC meeting, a decision can be made on another reduction in oil production, at the G20 summit – Trump and Xi Jinping can agree on a trade agreement that will allow the US leader not to introduce new duties on all imports from China, and to cancel the current trade duties in the future, which will definitely have a positive impact on the volume of production, imports, and exports, as well as on the demand for oil. Accordingly, oil tends to respond to specific facts and events, and not just grow or fall under the influence of speculators and oil traders. Therefore, we need to wait for specific fundamental messages. From a technical point of view, we have a "golden cross" from Ichimoku, but the MACD indicator turned down and indicates a correction that is lateral. Bulls now dominate the market, and the MACD turn to the top will indicate the resumption of oil purchases by the Forex market. Trading recommendations: At the moment, the #CL tool is in the correction stage. It is recommended to wait for the MACD indicator to turn upwards and open new long positions with the purpose of the first resistance level of 59.87. In addition to the technical picture should also take into account the fundamental data and the time of their release. Explanation of illustration: Ichimoku Indicator: Tenkan-Sen – red line. Kijun-Sen – blue line. Senkou Span A – light brown dotted line. Senkou Span B – light purple dotted line. Chinkou Span – green line. Bollinger Bands Indicator: 3 yellow lines. MACD Indicator: A red line and a histogram with white bars in the indicator window. The material has been provided by InstaForex Company - www.instaforex.com |
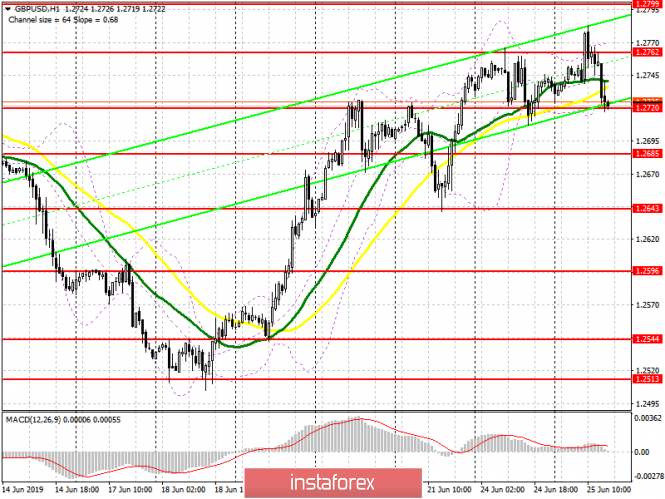
| Posted: 25 Jun 2019 07:06 AM PDT To open long positions on GBP/USD, you need: Buyers of the pound were unable to hold the resistance of 1.2762, which was expected to lead to a correction. At the moment, the task will be to hold the pair above the support of 1.2720, and the formation of a false breakout there will be a signal to buy. The aim of the bulls will also be the resistance of 1.2762, the breakthrough of which will lead to a maximum of 1.2799, where I recommend taking the profit. In the scenario of decline below the level of 1.2720 to long positions in GBP/USD, it is best to return to the rebound from the minimum of 1.2685 and 1.2643. To open short positions on GBP/USD, you need: The movement of the pound down will depend on the speech of Fed Chairman Jerome Powell. The breakout of the support of 1.2720 will provide further bearish movement to the area of lows of 1.2685 and 1.2643, where I recommend taking the profit. If the head of the Fed announces his intention to lower rates, it will lead to an increase in the pound. In this scenario, it is best to return to short positions only after updating the highs of 1.2799 and 1.2858 Indicator signals: Moving Averages Trading is below 30 and 50 moving averages, which indicates the formation of a downward correction. Bollinger Bands The breakthrough of the lower boundary of the indicator in the area of 1.2720 will increase the chance of a bearish market.
Description of indicators
|
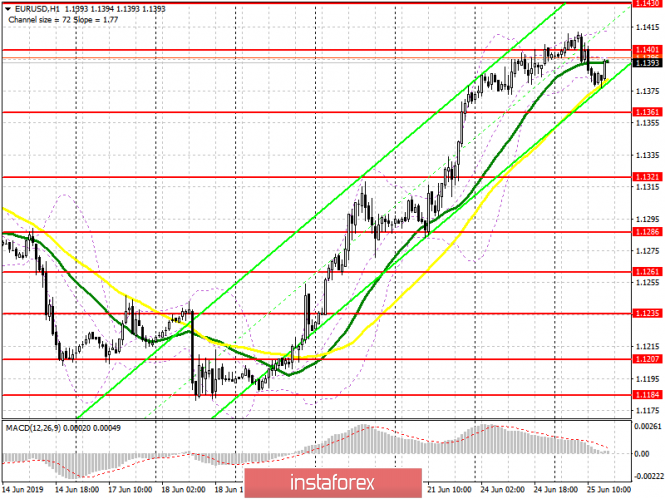
| Posted: 25 Jun 2019 06:45 AM PDT To open long positions on EUR/USD pair, you need: Euro buyers are gradually withdrawing from the market before an important speech by the Fed Chairman and their main task at the moment is to return and consolidate above the resistance 1.1401, which was formed in the morning. Only after such, it will be possible to count on further growth of EUR / USD in the region of the highs of 1.1430 and 1.1459, where I recommend taking profits. With a downward correction scenario (which has been asking for quite some time), long positions can be returned to the 1.1361 support test, provided that a false breakdown occurs or to rebound from a minimum of 1.1321. To open short positions on EUR/USD pair, you need: The bearish scenario can be played by big players during the Fed chairman's speech, which will be held later in the evening. An unsuccessful fixation above the 1.1401 resistance in the second half of the day will be a signal to open short positions in order to return to the support area of 1.1361. A breakthrough of which will lead to a larger downward correction to the lows of 1.1321 and 1.1286, where I recommend taking profits. If the demand for the euro returns during a speech by Jerome Powell, then it's best to look closely at EUR/USD sales after testing the highs of 1.1430 and 1.1459. Indicator signals: Moving averages Trade is conducted in the region of 30 and 50 moving averages, which indicates a possible correction of the euro in the afternoon. Bollinger bands A break of the lower border of the indicator in the area of 1.1380 will lead to a larger drop in the euro. MA (moving average) 50 days - yellow MA (moving average) 30 days - green MACD: fast EMA 12, slow EMA 26, SMA 9 The material has been provided by InstaForex Company - www.instaforex.com |
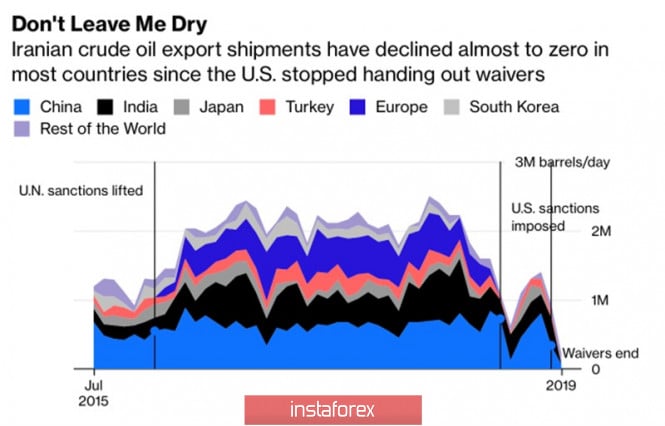
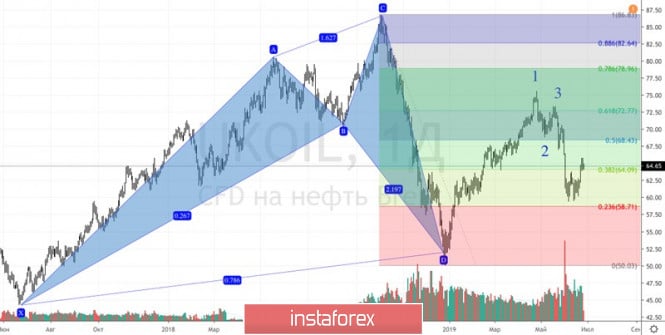
| Posted: 25 Jun 2019 05:38 AM PDT The report about the American drone shot down by Iran and Donald Trump's intention to launch a military strike on Tehran allowed the oil to mark the best day rally in 2019. The market immediately recalled the situation of the end of the last century when armed conflicts in the Middle East led to an increase in Brent quotes above $100 a barrel. For the first time, the US President changed his mind to attack the enemy, limiting himself to the expansion of economic sanctions. In modern conditions, they are no less effective tool than an armed invasion. In May, deliveries of black gold from Iran to other countries fell to 225 thousand b/s. The average monthly figure is 993 thousand b/d this year, which is the lowest value since 1979. The country's GDP fell by 6% while inflation jumped to 37%. Tehran is experiencing serious problems against the background of economic isolation and constantly threatens to block the Strait of Hormuz. Supplies of all liquid petroleum products in value of 21% in the world and a third of the maritime transportation of oil passed through it. Supply disruptions are clearly a bullish factor for Brent and WTI. Dynamics of oil supplies from Iran Black gold is supported by the hope of resolving the conflict between the US and China during the Donald Trump and Xi Jinping meeting on the sidelines of the G20 summit. The belief in prolonging the agreement to reduce production by OPEC and other producing countries, including Russia, as well as the American dollar, has significantly fallen recently. A trade war between the world's leading economies contributes to disrupting supply chains, slowing global trade and GDP, as well as reducing the growth rate of oil demand. If duties are removed, the situation on the black gold market will improve significantly. Brent and WTI can help OPEC. Moscow refused to directly answer the question of whether it would agree to extend the term of the Vienna agreement to reduce production by 1.2 million b/s until the end of 2019. At the same time, the Russian Federation does not get tired to emphasize the role of the alliance with the cartel in stabilizing the oil market. The country is well aware of the price at which this is achieved. By the end of the week on June 14, exports of black gold from the United States amounted to 3.4 million b/s, which is close to the historical maximum that occurred in February (3.6 million b/s). At the same time, imports from OPEC to the States fell to a 30-year bottom. Loss of market share is an important aspect, especially for Russia, which can afford oil at $40 a barrel. Support from black gold fans has weakened in front of the US dollar. Despite the fact that the Fed and wishes of Donald Trump, the federal funds rate did not lower in June. The Central Bank hint at a weakening of monetary policy in the near future became a catalyst for the sales of the USD index. Technically, a breakthrough of resistance at $ 64.1 per barrel is a good sign for the bulls. Their main task is to keep this level. It turns out that you can count on the continuation of the rally to $68.4 and $72.8 but the risks of implementing the 5-0 pattern with targets below the December lows will increase. Brent daily chart |
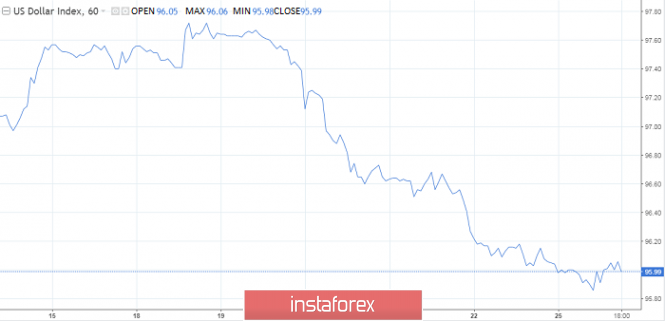
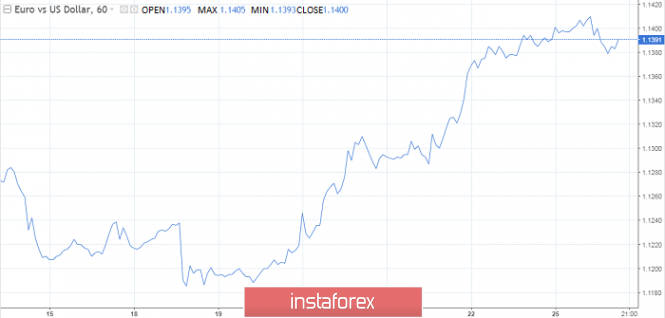
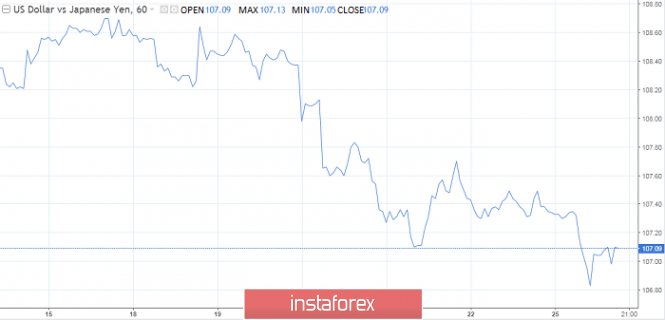
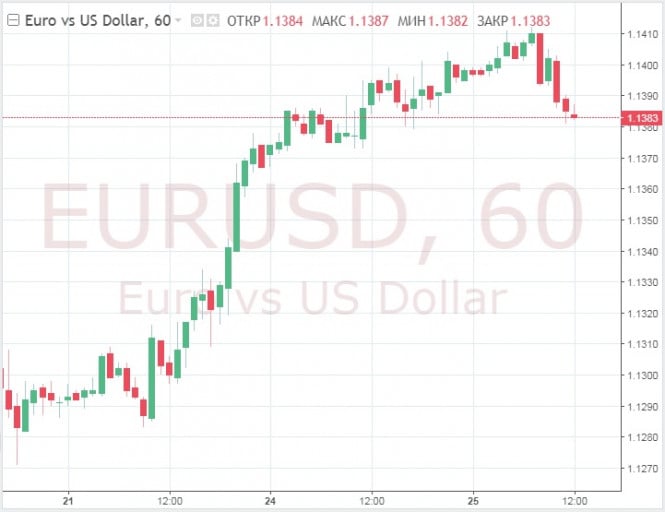
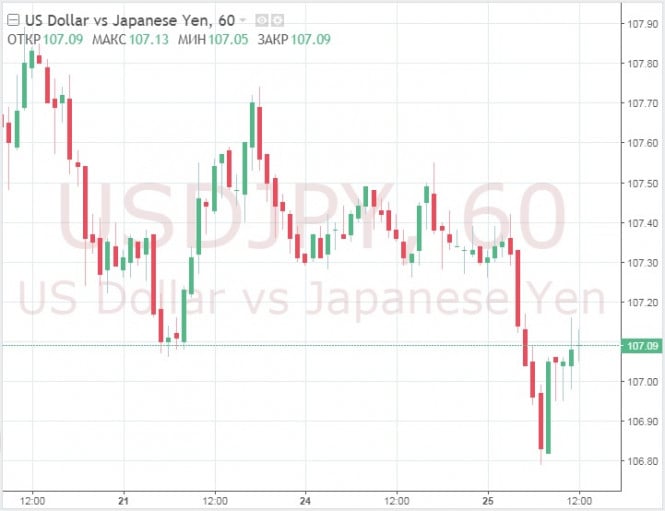
| The dollar plummets against the euro, the yen talks of lowering rates Posted: 25 Jun 2019 05:15 AM PDT The dollar fell to a three-month low against the euro and to the weakest value since the beginning of January against the Japanese yen due to the prospect of the Fed's monetary policy easing to reduce the demand for the US currency. Euro added 2 percent and reached a three-month high of 1.1412 dollars. The dollar fell by 0.3 percent to 106.97 yen, dropping below the psychologically important mark of 107 yen per dollar. The Japanese currency is rising against the background of tensions between the US and Iran. Recall, Tehran said that the US sanctions have permanently closed diplomatic channels between the two countries. In addition, the Fed's hints accelerated the dollar sale. The regulator made it clear that by the end of the year, it will lower interest rates amid growing concerns about a slowdown in economic growth and the effects of tariff wars between the United States and China. The yield on 10-year US Treasury bonds again fell below 2%, reducing the advantage of the interest rate that the dollar has enjoyed in recent years. "We expect that the proactive reduction of the Fed's rates will temporarily affect the dollar, especially in relation to the currencies of the G10 countries, since the advantage of high interest rates is eliminated in the context of slowing global growth," Barclays said. However, the Fed's ability to support expanded US expansion contrasts with a clear steady slowdown and growing risks in China and Europe, which implies a recovery of the dollar in 2020. Investors are waiting to see whether Trump and Xi can at least conclude a truce in a trade war when they meet at the G20 summit in Osaka later this week. Trump believes that his meeting with Xi is an opportunity to "show his interest" and see where China is in their trade dispute. However, the current state of affairs suggests that the two leaders are unlikely to agree to a deal. |
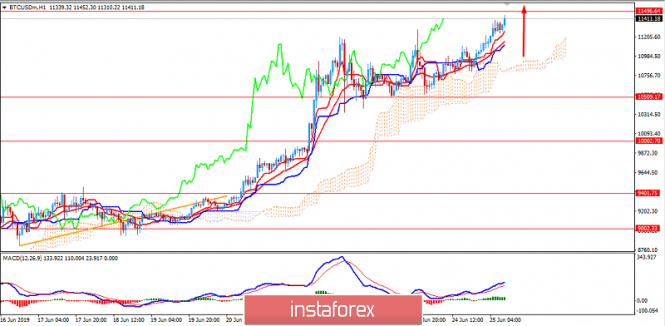
| BITCOIN heading towards $11,500 event area. June 25, 2019 Posted: 25 Jun 2019 04:12 AM PDT Bitcoin has been volatile with a strong bullish bias. It has recently pushed higher above $10,000 approaching $11,500. A big bullish weekend is usually followed by a red Monday for bitcoin and crypto markets, but this has yet to materialize. Bitcoin has continued to climb and is now back at its 2019 and 15 months high again. Further gains are likely and if Bitcoin can repeat is previous six month's performance then $20,000 can be reached within a very short time. It is the third time since breaking the five- figure barrier that BTC has hit this resistance point so a move above it could be on the cards. Bitcoin's recent retest above $11,000 has lifted total crypto market capitalization to $333 billion and now Bitcoin commands almost 60 percent of the entire market and is showing no signs of abating. There has been no dip this week as we have seen in previous ones. Daily volume is back over $20 billion and BTC market cap has just hit $200 billion as the train keeps on going cranking another 5 percent on the day. To conclude, Bitcoin is expected to break above $11,500 area after bouncing off the Kumo cloud support. Though $11,500 is an event area where the price has been rejected several times. However, a break above this level would indicate quicker gains which may lead the price towards $20,000 again in a short period of time. At the current price point, $12,000 and $13,000 levels are going to play a vital resistance role if the price overcomes these levels, the $20,000 target will be much easier to achieve. SUPPORT: 10000, 10500, 11000 RESISTANCE: 11500, 12000, 13000 BIAS: BULLISH MOMENTUM: NON-VOLATILE
|
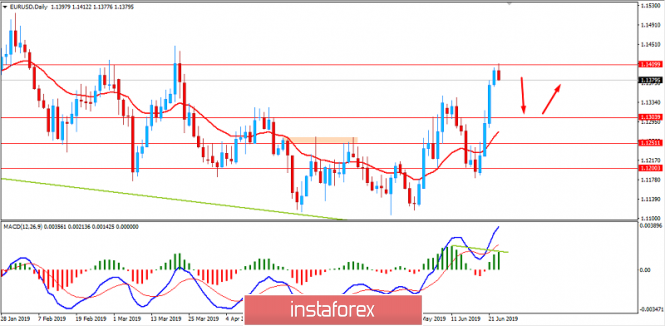
| EURUSD: USD to regain ground ahead of GDP. June 25, 2019 Posted: 25 Jun 2019 03:53 AM PDT The euro has been the dominant currency in the pair. The quotes of the pair are residing at the edge of 1.1400 area with a daily close. The US dollar is pressurized by the Fed's possible decision to cut its key rate and weak economic reports. According to ECB reports, profitability across the eurozone bank sector is low and weakening growth could further dampen the sector's prospects. Negative ECB rates are not the cause of the weakness as super-easy monetary policy has so far had a neutral effect on bank profits. The overall effects of negative rates on the banking sector need to be carefully monitored, particularly because the balance of their effects will depend on how long rates remain in negative territory. Remarkably, the European Union will allow Italy to increase its deficit if it helped the country's economy. Moreover, US Final GDP report is going to be published. The reading is expected to be unchanged at 3.1%. The greenback is likely to gain momentum over the euro. Additionally, Fed policymakers are discovering they likely need to shift into an even lower gear than in recent history if they are to speed up the US economy. The main reasons listed for the lower neutral rate includes ongoing fallout from the financial crisis, weaker productivity, continued slackness in the labor market, and an aging population. Today, US CB consumer confidence report is going to be published. The figure is expected to decrease to 132.0 from 134.1, Richmond Manufacturing Index to increase to 7 from 5, and New Home Sale to rise to 686k from 673k. Fed Chairman Jerome Powell is going to speak today about the economic outlook and monetary policy at the Foreign Relations Council. To sum up, ahead of the G20 meeting, the US dollar is expected to regain momentum over the euro. The greenback may catch bullish momentum if economic data is upbeat. Now let us look at the technical view. The price is currently pushing lower quite impulsively after rejecting off the 1.1400 area with strong bearish pressure. The price is residing quite away from the Mean, which is expected to revert lower before showing any further bullish momentum. As the price remains below 1.1400 area with a daily close, the probability of certain bearish throwback is quite high. |
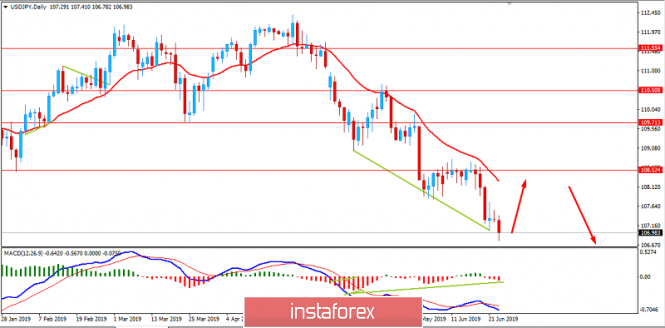
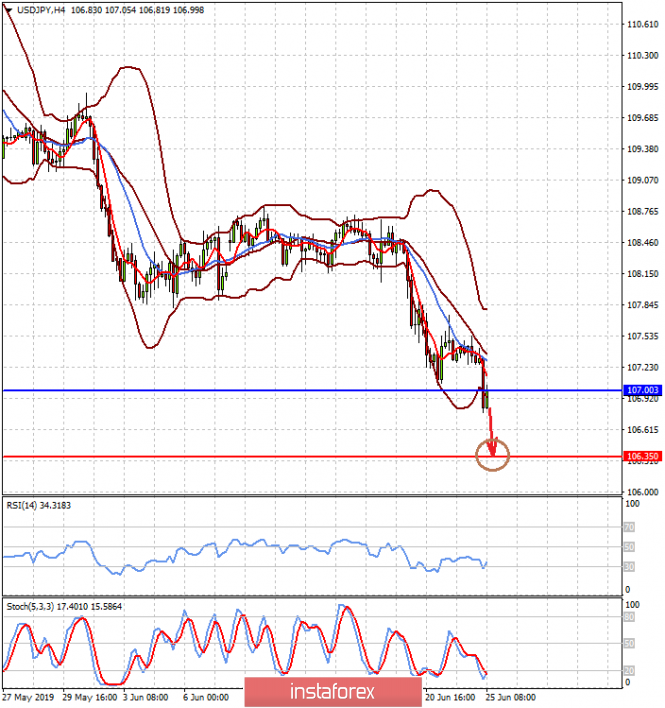
| USD/JPY: USD to pullback against dominant JPY? June 25, 2019 Posted: 25 Jun 2019 03:47 AM PDT As expected, JPY has been gaining ground over USD which is expected to strengthen further after a series of pullbacks and corrections along the way. The US is due to release revised GDP report for Q1 which is likely to remain flat at 3.1%. The report can help USD to regain grounds against JPY but how long it is going to help the currency to climb higher is still an open question. The Federal Reserve policy makers made a conclusion that they need to soften rhetoric on monetary policy if they are to speed up the US economy. The main reasons listed for the lower neutral rate includes ongoing fallout from the financial crisis, weaker productivity, low employment in the labor market, and an aging population, which when combined leave the economy structurally weaker. Today, FED Chairman Jerome Powell is going to speak about the economic outlook and monetary policy at the Foreign Relations Council, New York. Today US CB Consumer Confidence report is going to be published which is expected to decrease to 132.0 from the previous figure of 134.1, Richmond Manufacturing Index is likely to grow to 7 from from the previous figure of 5, and New Home Sales is also expected to increase to 686k from the previous figure of 673k. On the JPY side, Japan's big manufacturers' business confidence is expected to worsen to nearly three-year lows in the June quarter as the US-China trade war and sluggish global demand hurt the export-reliant economy. A deterioration in corporate sentiment will add to the Bank of Japan's concerns about slowing economic growth after its governor signalled readiness to ramp up stimulus as global risks cloud the outlook. Additionally, an escalation in the US-China trade conflict dents exports, so the yen's appreciation damaged the corporate earnings environment. Japan's government recently signaled its readiness to pursue flexible fiscal spending to offset risks to economic growth. Tokyo's plan to raise the sales tax to 10% from 8% in October could darken the outlook for consumer spending which makes up roughly 60% of Japan's gross domestic product (GDP), at a time of slower demand from overseas. Moreover, Japan and the United States confirmed their understanding of each other's viewpoints on trade during talks held over the past week. Today Japanese SPPI report was published with a decrease to 0.8% from the previous value of 1.0% which was expected to rise to 1.1% and BOJ Core CPI was published unchanged at 0.7% which was expected to decrease to 0.6%. To sum it up, amid mixed economic reports JPY is struggling to sustain the impulsive bearish momentum over USD. Despite broad-based weakness, USD is expected to rebound in the coming days if the upcoming GDP report comes positive and better than expected without any further dovish tone from the Fed. Now let us look at the technical view. The price is currently trading below 107.00 under strong bearish momentum. The price is expected to pullback towards 108.50. The price formed Bullish Divergence along the way which also indicates further upward pressure. As the price is trading far away from the Mean i.e. dynamic level of 20 EMA, there is a higher probability of price pushing higher towards 108.50 before continuing with the bearish trend in the future.
|
| Swing oil prices reduce inventory Posted: 25 Jun 2019 02:43 AM PDT
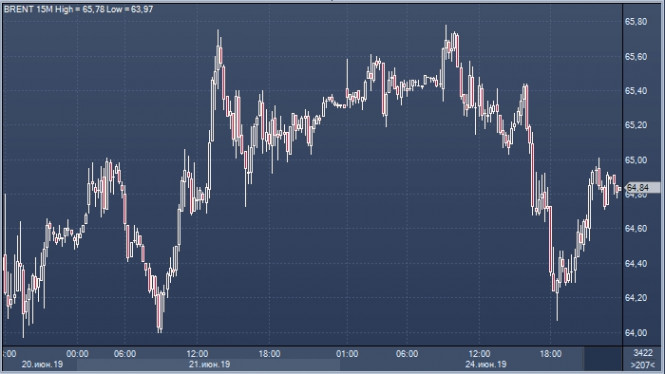
According to analysts, multidirectional dynamics of oil prices in the world market can lead to a reduction in black gold reserves. The reduction may be 2.8 million barrels, according to the US Department of Energy. A week earlier, another department, the American Petroleum Institute (API), published statistics, according to which the reduction in oil reserves amounted to 0.8 million barrels. Fluctuations in oil prices, recorded on Monday evening, June 24, led first to an increase in the value of black gold, and then to its fall. On the whole, Monday ended with a minor correction for Brent oil. Bidding of the new week began near the $ 64.7 mark. In the Asian session, there was a slight rise to $ 65, which was replaced by a correction. As a result, the price of Brent dropped to $ 63.3, but by the end of the trading session, it had recovered to $ 64.1. At US trading on Monday, the price of Brent crude fell by 0.54% to $ 64.85 a barrel, but at the moment, it is trying to maintain current levels. As for the light oil WTI, its value increased by 0.68%, to $ 57.82 per barrel. On Tuesday morning, June 25, the price of Brent was again under pressure. Black gold after the decline to $ 63.4 was trading near the mark of $ 63.8. According to experts, the probable trading range for Brent today is $ 63.1– $ 64.4 per barrel. At the same time, the medium-term price range, which is determined by the nearest significant support and resistance levels, decreased to $ 59.5– $ 65.1, analysts summarized.
|
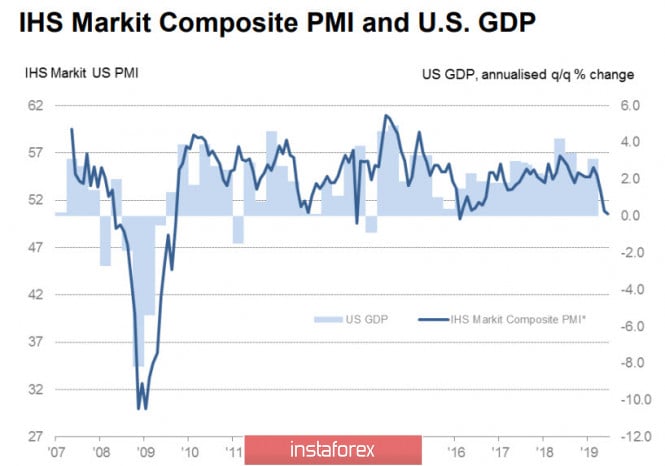
| Waiting for G20: AUD and NZD are preparing to resume the fall Posted: 25 Jun 2019 02:25 AM PDT Markets are stable in anticipation of the G20, however, the rapid growth of gold is a prerequisite for the upcoming shocks. The US economy is losing momentum. Changes are becoming visible primarily at the regional level. While the model of GDP from the Federal Reserve Bank of Atlanta suggests a steady growth in GDP in Q2. At the level of 2%, reports on the business activity of the regional offices of the Fed become suspicious of the same type. Thus, the business index of the New York Federal Reserve Bank in June fell from + 17.8n to immediately -8.6p, followed by Philadelphia's announced fall from 16.6n to 0.2n. The Dallas FRB reported last, its decline from -5.3n to -12.1n. In all districts, statistics are at the level of 3-year lows, that is, worse than before the presidential elections. Accordingly, preliminary data from Markit for PMI in June is slightly above 50p. The decline in business activity becomes noticeable, but is still not noticed by markets that prefer to hope for the best.
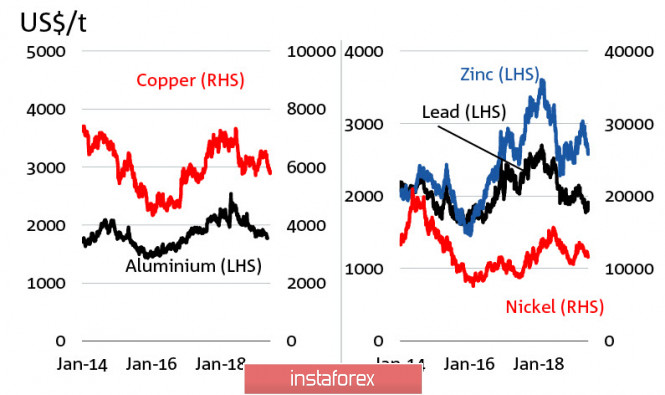
The main reason is the decline in demand for consumer and capital goods as a result of rising tariffs, and NAB Bank assumes that prices will continue to decline both this year and next year, even without worsening trade tensions. Lower prices will lead to a slowdown in inflation and pressure on the services market, since there are no objective reasons for its growth. In the previous review, we assumed that the Aussie would go to 0.6844 and further to 0.6801 / 11. The first of these goals was worked out, but then the Fed unfolded expectations for the dollar in the direction of a sharp decline, thanks to which AUDUSD rolled back up. Nevertheless, the trend remains bearish. The previous maximum of 0.7021 is not updated, and if the Trump-C meeting does not bring a breakthrough. The AUD will turn down with the intention to test the recent maximum of 0.6831. Investors are in anticipation of meeting Trump and SI at the G20 summit, which, if not, will lead to a full-scale trade agreement between the US and China, then at least can significantly reduce tensions. Markets are still in a state of cautious optimism, which, has combined expectations for lowering the Fed rates, giving the Bulls a good chance of continued growth. Gold prices went to a 6-year high, partly because of rising geopolitical tensions, partly because of expectations for a further weakening of the dollar. NZDUSD Today, RBNZ will hold a regular monetary policy meeting. Markets expect the regulator to take a pause in the rate reduction cycle, so if the RBNZ does not disappoint expectations, the kiwi may respond to the growth of the meeting and gain a foothold above the June maximum of 0.6680. The ANZ Bank expects that the rate will still be brought to the level of 1% by two consecutive reductions in November and March. In addition, today's commentary of the RBNZ is able to provide insight into whether the regulator will use any more soft monetary policy methods, such as quantitative easing, liquidity provision (similar to the European TLTRO program), and the purchase of foreign currency assets to reduce TWI. Answers to these questions will provide insight into the future direction of the NZD. Earlier, we assumed that Kiwi would try to update support for 0.6480. This goal remains relevant, however, a downward reversal will occur only if the RBNZ gives for that reason tonight. There are no fundamental reasons for leaving the range, so the further dynamics will be fully determined by the outcome of the RBNZ meeting. AUDUSD A detailed analysis of the latest ABS report on the labor market showed that serious systemic problems are accumulating in the Australian economy. In all sectors, the growth in employment for the year until May 2019 was the most significant in the field of public administration and professional services, while the greatest loss of jobs for the year was in construction and manufacturing. At the same time, casual work accounts for 20.9% of the total workforce, which generally indicates that the Australian economy is gradually losing its fundamental stability. Metal prices fall after the deterioration of trade relations between the United States and China.
|
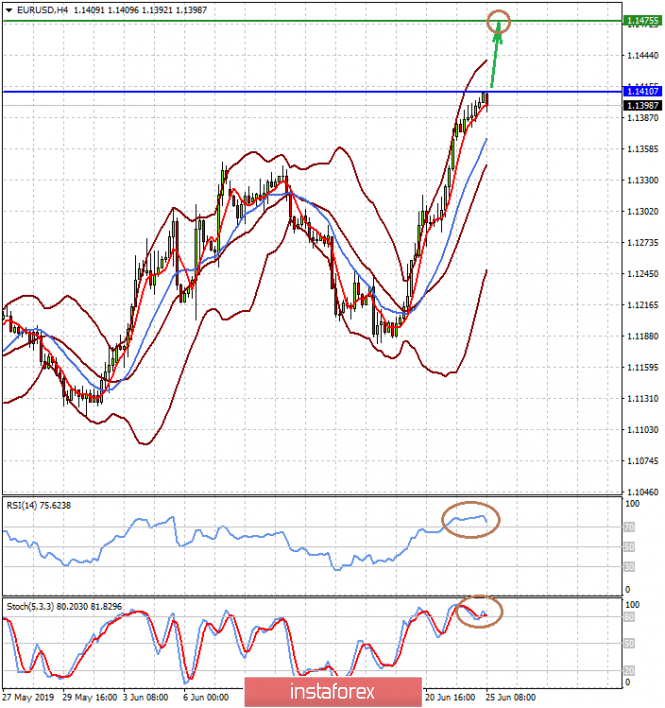
| Posted: 25 Jun 2019 02:23 AM PDT The US dollar remains under pressure despite the escalation of political confrontation between the States and Iran, which could escalate into a military one. Usually, earlier in such periods when military conflicts are brewing, the US dollar has always been in demand as a safe-haven currency. However, the last crisis of 2008–09 seems to have changed this picture and possibly forever. The situation shows when America itself is drawn into a probable military conflict forces investors to take noticeable caution and place their capital not only on the traditionally reliable market of government bonds of the US Treasury but also on other capital markets of economically developed countries. At the same time, it aims to look for higher returns on bond markets emerging economies (EM). The pressure on the dollar is exerted not only by the current picture but also by the expectation that the Fed will have to lower interest rates, primarily against the background of signals of the American economy, which negatively affects the yield of treasuries and boomerang at the rate of the American currency. Earlier last week, after the Central Bank's monetary policy meeting, some members of the Federal Reserve made it very clear that they were inclined to reduce the cost of borrowing. This again became the basis for the weakening of the dollar. Today, the head of the American regulator Jerome Powell will speak, who if he allows himself to confirm the opinions of his colleagues regarding the prospects for the bank's monetary policy, will undoubtedly lead to a new wave of dollar sales. However, despite such an obvious possible reaction, we believe that it can be restrained because of the expectation by the markets of the planned meeting of Donald Trump and Xi Jinping in the sidelines of the G-20 in Osaka, Japan. Investors are still hoping for a breakthrough in the trade war between Washington and Beijing and for the conclusion of a new trade agreement. These hopes continue to be supported by considerations of common sense, however, it still leaves America often as shown in recent events. Forecast of the day: The EUR/USD pair is below the level of 1.1410. It has every chance to continue rising towards 1.1475 if Powell does not deny the possibility of the Fed lowering interest rates this year. The USD/JPY pair is trading at 107.00. The weakness of the dollar, as well as lingering concerns about the conflict between the US and Iran in the Middle East, puts a lot of pressure on the pair. We expect its fall to continue to 106.35. |
| You are subscribed to email updates from Forex analysis review. To stop receiving these emails, you may unsubscribe now. | Email delivery powered by Google |
| Google, 1600 Amphitheatre Parkway, Mountain View, CA 94043, United States | |




 Description of indicators


No comments:
Post a Comment