Forex analysis review |
- How will Trump's plan "B" affect the dollar?
- EUR / USD: rumors of the G20, German inflation and US GDP
- EUR / USD. June 27th. Results of the day. US GDP in the first quarter was + 3.1%
- June 27, 2019 : GBP/JPY Intraday technical analysis and trade recommendations.
- June 27, 2019 : GBP/USD demonstrating a short-term bearish reversal pattern.
- BTC 06.27.2019 - Strong flag down and order flow change
- EURUSD holding above 1.1330-1.1350 support
- Gold 06.27.2019 - Change in order flow from bullish to bearish
- Gold price above short-term support, risk for a move towards $1,370-75
- GBP/USD 06.27.2019 - Broken bear flag on 4H time frame
- EURUSD: The final stage of the discussion of the US-China trade agreement will take place on Saturday. Iran has not yet violated
- Wave analysis of EUR/USD and GBP/USD. Overall picture
- Technical analysis of USD/CAD for June 27, 2019
- Technical analysis of GBP/USD for June 27, 2019
- GBP/USD: plan for the US session on June 27. Buyers of the pound are trying to keep the market balance
- EUR/USD: plan for the US session on June 27. Euro buyers are trying to return to the market by holding the level of 1.1348
- Rally in full swing: Bitcoin conquers new heights
- Australian dollar is preparing to reduce the rate to 0.75%
- Gold. June 27th. Trading system "Regression Channels". The US dollar is adjusted, gold - after
- Why BITCOIN sinks having touched $14,000? June 27, 2019
- Safe haven gold to lose momentum? June 27, 2019
- Technical analysis of EUR/USD for June 27, 2019
- Technical analysis of NZD/USD for May 27, 2019
- The dollar is rising against the yen, the fate of the Fed rates will be determined in the G20 summit
- Only weak US statistics will put pressure on the dollar
| How will Trump's plan "B" affect the dollar? Posted: 27 Jun 2019 04:57 PM PDT
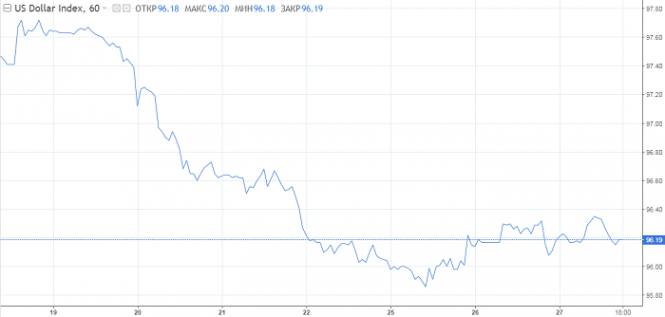
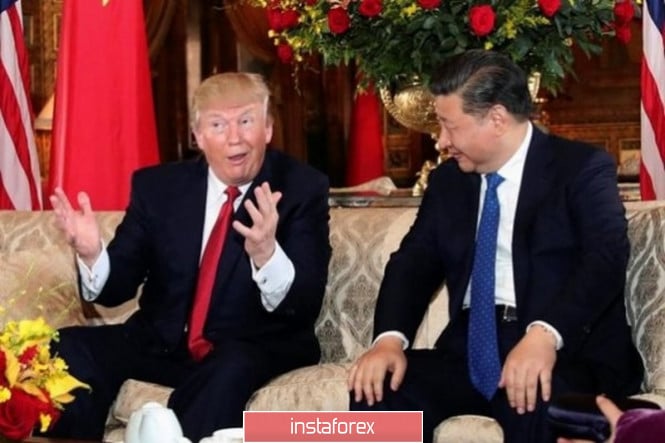
A few hours remain before the start of the G20 summit in Osaka, Japan. The closer the meeting between Donald Trump and Xi Jinping, the stronger the unrest in the market, which is still weak in currency quotes, but it is a matter of time. After stagnation, the market usually explodes. Now, traders have taken a wait-and-see position. Despite the fact that it is extremely difficult to predict how the meeting of the leaders of the two largest economies in the world will end, the market for the most part hopes for a positive outcome. At a minimum, investors expect the US and China to resume trade negotiations. The outcome of the summit will be of great importance for the currency markets, as well as for the Fed. In the case of a trade agreement, which is unlikely, the American Central Bank will no longer need to reduce the rate. It took a little more than half a year when the financial markets were agitated by the announcement of a truce in the US-China trade war. This happened on the sidelines of the G20 summit in Buenos Aires. This is partly why investors have high hopes for the summit in Japan. Trump's backup plan On the eve of White House officials in private conversation with Reuters, it was reported that the official Washington does not plan to put any conditions on the issue of tariff expansion. However, Donald Trump, apparently, has his own point of view and his plan "B". The American president speaks positively about his future meeting with his Chinese counterpart, while not excluding the introduction of duties. If he does not like something, then all imports of China will be subject to tariffs. This is reminiscent of the negotiations at gunpoint, in which China had previously refused to participate. Trump, as a good chess player, thinks a few moves ahead, and a new portion of criticism of Powell suggests that he is beginning to worry about relations with Europe. The US President believes that the place of the head of the Fed should be occupied by Mario Draghi, who initiated the currency war. Powell was unable to recognize the actions of the enemy, which, according to Trump, is a sign of a weak mind and naivety. In fact, the "soft" rhetoric of the ECB is primarily associated with the weakness of the eurozone economy. In September, the regulator may reduce the deposit rate from -0.4% to -0.5%, and in July, it will adjust the wording on finding rates staying at the same level, at least until the first half of 2020. The ECB will resume QE and will buy assets of 30 billion euros per month over five quarters. This opinion is shared by 42% of respondents. However, when both regulators are on the threshold of easing, the dynamics of the EUR / USD pair is determined by its depth. Thus, most European are betting on the weakening of the dollar. Opinion of funds against the dollar The largest of them, Amundi, is confident that the dollar will inevitably adjust as the US Central Bank shifts towards a more "dovish" policy. In Aberdeen Standard, we saw that the "passing winds" of the dollar in the form of high yield treasuries and strong economic growth in the United States are transforming into calm. According to UBS Global Wealth Management forecasts, the "American" may continue its downward trend if the upcoming summit in Japan this weekend fails to ease tensions in world trade.
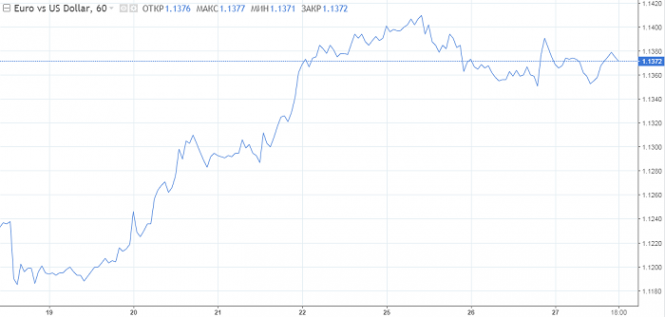
Note that the dollar strength indicator fell by 1.5% this month. The longest rally in the US currency over the past four years has been interrupted due to the fact that the Fed has signaled a quick policy easing. Last week, the level of yield of state bonds reached a minimum value since 2016, narrowing the premium to similar securities of Germany and Japan. "We expect the dollar to lose a little more of its recent strength and further worsen its position. The market has become very one-sided, pro-dollar, in terms of sentiment and positioning. The dollar "bullish" cycle seems very mature, and with an abundance of long speculative positions on the dollar, further correction seems very likely, " "- comment on the situation in Amundi. Taking into account the fact that Goldman Sachs and JP Morgan simultaneously reduced their 10-year Treasury rates forecast for the end of the year from 2.8% to 1.75%, Euromedical is not to be envied. Although the G20 summit can change a lot, the EUR / USD still does not want to go beyond the range of $ 1.13-1.14 for now.
|
| EUR / USD: rumors of the G20, German inflation and US GDP Posted: 27 Jun 2019 04:57 PM PDT On the eve of the G-20 summit, traders are noticeably nervous when responding to conflicting rumors. The stakes are really high - according to the results of the G20, the trade war will either break out with a new force, or end with the signing of a large-scale transaction. In the first case, the superpowers will provoke a "domino effect" by launching a mechanism for mitigating the parameters of monetary policy by the leading central banks of the world. First of all, we are talking about the Fed and (possibly) the ECB. And if the probability of a rate cut is estimated at 100% (especially with the negative outcome of the negotiations between Trump and Xi Jinping), then the situation with the European regulator is not that clear. Therefore, any rumors about the continuing differences between Beijing and Washington are playing against the dollar and vice versa. The positive news in this context provides quite strong support for the US currency.
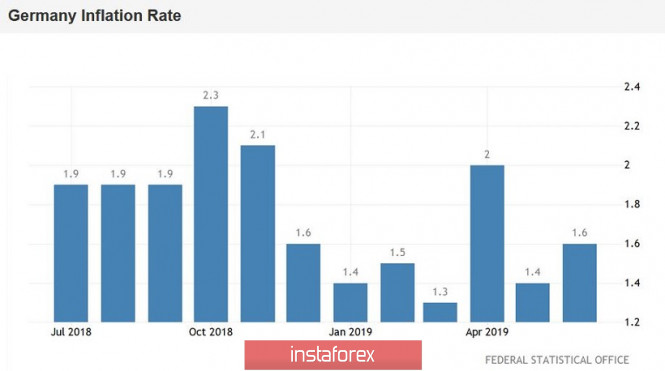
Today's price fluctuations of EUR/USD eloquently confirmed this pattern. During the Asian session on Thursday, the price dropped to the middle of the 13th figure amid rumors that the United States and China reached a "preliminary truce" in the trade war ahead of the summit and the meeting of the leaders of these countries. This information made it possible to revise forecasts for the future actions of the Fed, at least about the extent of monetary policy easing. The dollar index shot upwards, changing the configuration in the major dollar pairs. However, at the start of the European session, an official comment appeared from the spokesperson for the Ministry of Foreign Affairs of China. He stated that the Chinese government "does not know anything" about any trade truce allegedly concluded by the United States and the People's Republic of China. This remark became a "cold shower" for dollar bulls, which made the bulls of EUR/USD to went in the direction of the 14th figure. In general, despite such fluctuations, the pair is within the price range limited by 1.1290 marks (Tenkan-sen line on the daily chart) and 1.1420 (the upper line of the BB indicator on the same time frame). Traders are unlikely to allow themselves to go beyond this price range before the announcement of the outcome of the G20 summit, or to be more precise, before the announcement of the outcome of the negotiations between the leaders of the United States and China. However, according to a number of currency strategists, the dollar will still remain under pressure in the medium term, regardless of the preliminary agreements between Trump and Jinping. For two years, the US currency has consistently strengthened, retaining its position thanks to two pillars: first, this is Trump's fiscal stimulus policy, and second, the Fed's tight monetary policy. At the moment, the positive effect of fiscal incentives has almost dried up, after which inflation indicators began to slowly but surely slide down. On the other hand, the negative consequences of the trade war with China have become more clearly manifested recently. According to Moody's, the US GDP will only grow to 2.3% (the previous forecast is 2.5%) this year, whereas in 2020, it is expected to grow to 1.7%. In general, if the States impose 25 percent duties on the remaining Chinese products worth $ 300 billion (and Beijing responds with mirror measures), then global GDP growth will drop to 2.7% and, accordingly, slacken the US economy. That is why the dollar is so sensitive to preliminary rumors about the prospects for US-China relations. The European currency, in turn, received support from macroeconomic statistics today. German inflation surprised by quite strong figures, which became a precursor to the growth of European inflation (release is scheduled for tomorrow). Thus, in monthly terms, the indicator moved away from the lows of the year and rose to 0.3% (forecast - 0.2%). On an annualized basis, a positive trend was also recorded: the index reached 1.6%, while the growth forecast was up to 1.4%. The regional reports of the German CPI reflected a general improvement in inflation rates in annual terms.
This result is a positive signal for the ECB, since the inflation forecast remains unchanged as of today - at least for the "locomotive of the European economy" - Germany. The market reacted quite restrained to this release: the approaching summit does not allow traders to focus on other fundamental factors. Another release that was already published in the USA was also ignored. This is a final assessment of the growth of the American economy in the first quarter of this year. The price component of GDP was slightly revised upwards (from 0.8% to 0.9%), but this fact was ignored by traders. Firstly, even with the revision of this indicator, it still remains at fairly low values (the weakest growth rate since the first quarter of 2016), and secondly, other inflation indicators also leave much to be desired. Therefore, the minimal improvement in the GDP Price Index did not change the general mood of the market. Thus, the market froze in anticipation of the main event of the month, and maybe a year. All other fundamental factors play a secondary role. Judging by the reaction of the market to preliminary rumors about the "peace" of China and the United States, we will expect quite strong volatility in the coming days. The movement vector of the pair EUR/USD will depend on the outcome of the negotiations of the leaders of the superpowers. If the parties can make a deal (or issue a kind of "protocol of intent"), then the dollar will receive strong support and, possibly, resume rally across the market. Otherwise, the pair will finally consolidates in the area of the 14th figure, occupying a new price niche. The material has been provided by InstaForex Company - www.instaforex.com |
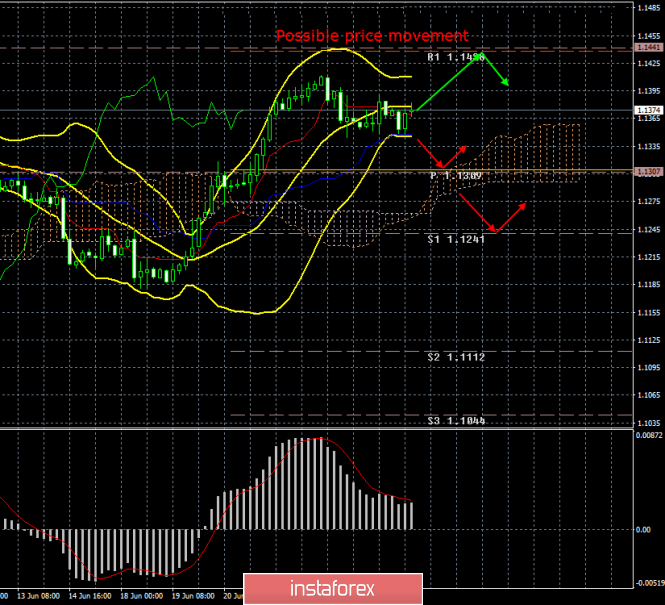
| EUR / USD. June 27th. Results of the day. US GDP in the first quarter was + 3.1% Posted: 27 Jun 2019 04:57 PM PDT 4-hour time frame The amplitude of the last 5 days (high-low): 92p - 95p - 37p - 68p - 43p. Average amplitude for the last 5 days: 67p (72p). On Thursday, June 27, most traders expected that US GDP would be lower than expected in the first quarter. The reason for these expectations was the whole package of failed macroeconomic statistics in recent weeks. However, the real value of GDP was + 3.1%, which is fully consistent with experts' forecasts. Since there were no discrepancies between real and predicted values, the reaction of the Forex market to this most important report did not follow. As a result, we have more than a quiet end of the week and month, which was extremely saturated with fundamental events, meetings of central banks, speeches of their heads, as well as publications of macroeconomic reports. In the last two trading days of June, another very important event will take place - the G20 Summit, which is not so much interesting, as much as the venue for a meeting between Donald Trump and Xi Jinping. Many believe that the results of negotiations between the leaders of China and the United States can shed light on the topic of concluding a trade agreement between these countries. Thus, the result of this meeting may be either the introduction of new trade duties by Trump against Chinese imports, or significant progress in the negotiations, which both sides will definitely mark, since it makes no sense to hide such information. Also, the outcome of this meeting will depend on the Fed's decision on interest rates and stimulating the economy. Jerome Powell has repeatedly noted the high degree of risk associated specifically with trade wars. It is reasonable to assume that if one of them is completed, then there will be no point in easing monetary policy. Trading recommendations: The EUR / USD pair continues to adjust. Thus, long positions remain relevant for the euro / dollar pair with the target of 1.1438, and MACD reversal upwards or rebound from the Kijun-Sen line will indicate the completion of the downward correction. It is possible to sell a pair of euro / dollar in small lots, if the bears will be able to gain a foothold below the critical line, with targets 1,1296 and 1,1241. In this case, the initiative for the pair EUR / USD may return to the hands of bears. In addition to the technical picture, we should also take into account the fundamental data and the time of their release. Explanation of the illustration: Ichimoku indicator: Tenkan-sen - the red line. Kijun-sen - the blue line. Senkou Span A - light brown dotted line. Senkou Span B - light purple dotted line. Chikou Span - green line. Bollinger Bands indicator: 3 yellow lines. MACD Indicator: Red line and histogram with white bars in the indicator window. The material has been provided by InstaForex Company - www.instaforex.com |
| June 27, 2019 : GBP/JPY Intraday technical analysis and trade recommendations. Posted: 27 Jun 2019 09:29 AM PDT
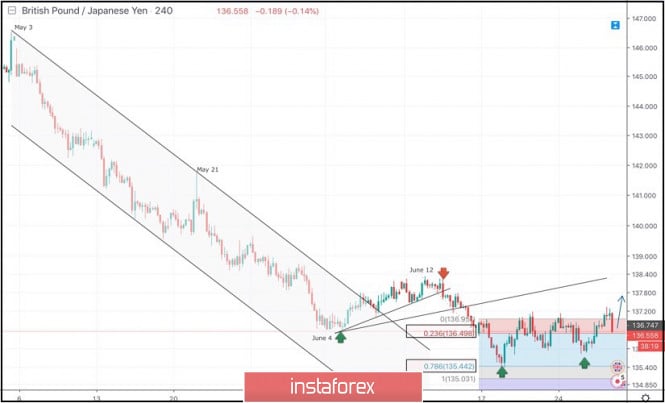
On May 3rd, the GBPJPY pair initiated the depicted bearish movement channel around 146.45 On March 21st, another visit towards the upper limit of the same channel (141.70) was demonstrated. Since then, the depicted downtrend/channel has been intact until June 4 when the pair failed to achieve a new low below 136.50. This was followed by a bullish breakout off the depicted bearish channel. Moreover, a short-term uptrend line was established around the same Price levels (136.50) until June 12 when the latest bearish pullback was initiated towards 136.50 (23.6% Fibonacci Expansion) then 135.44 (78.6% Fibonacci Expansion). Recently, obvious bullish recovery has been manifested. Bullish persistence above 136.50 is currently being demonstrated on the H4 chart. Bullish persistence above 136.95 is mandatory to enhance the bullish side of the market. Otherwise, the GBPJPY remains trapped within the current consolidation range (136.50 -136.95). Technically, a quick bullish advancement should be expected towards 138.00 initially where the backside of the broken uptrend is currently located. On the other hand, H4 re-closure below 136.50 enhances the bearish side of the market towards 135.44 and probably 135.03 for further retesting. Trade Recommendations: Short-term outlook remains bullish as long as bullish persistence above 136.50 is maintained on the H4 chart. Conservative traders can wait for bullish breakout above 136.95 for further confirmation. Initial Target levels should be located around 137.80 and 138.50. Any bearish breakdown below 136.00 invalidates the mentioned bullish scenario. The material has been provided by InstaForex Company - www.instaforex.com |
| June 27, 2019 : GBP/USD demonstrating a short-term bearish reversal pattern. Posted: 27 Jun 2019 09:10 AM PDT
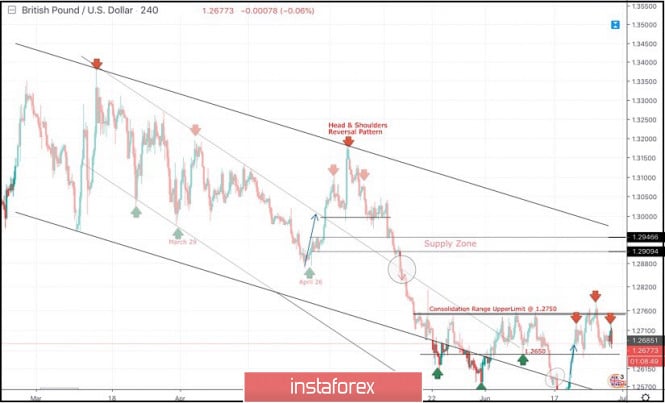
On June 4, temporary bullish breakout above 1.2650 was demonstrated for a few trading sessions. This enhanced the bullish side of the market towards 1.2750 (consolidation range upper limit) which has been preventing further bullish advancement up till now. On June 14, recent temporary bearish decline was demonstrated below 1.2600 hindering the mentioned bullish scenario for some time before bullish breakout could be re-achieved last week. For the bullish side of the market to remain dominant, bullish persistence above 1.2750 (consolidation range upper limit ) should be achieved by the bulls. Bullish breakout above 1.2750 is mandatory to bring further bullish advancement towards 1.2840 and 1.2900. Recently, the GBP/USD failed to establish a successful bullish breakout above 1.2750. Instead, early signs of bearish rejection have been manifested (Head & Shoulders reversal pattern with neckline located around 1.2650). A quick bearish pullback towards 1.2650 was expected shortly. Bearish breakdown below 1.2650 (reversal pattern neckline) confirms the reversal pattern with bearish projection target located at 1.2510. For conservative traders, SELL positions shouldn't be considered around the current price levels unless bearish breakout below 1.2570 becomes confirmed on higher timeframes (which is low probability). On the other hand, a bullish position is preferred around the current price levels. Bullish breakout above 1.2750 is mandatory as a valid BUY signal. Trade Recommendations: Intraday traders can have a valid BUY Entry upon bullish breakout above 1.2750. T/P levels to be located around 1.2840, 1.2900 and 1.2940. S/L should be placed below 1.2680. The material has been provided by InstaForex Company - www.instaforex.com |
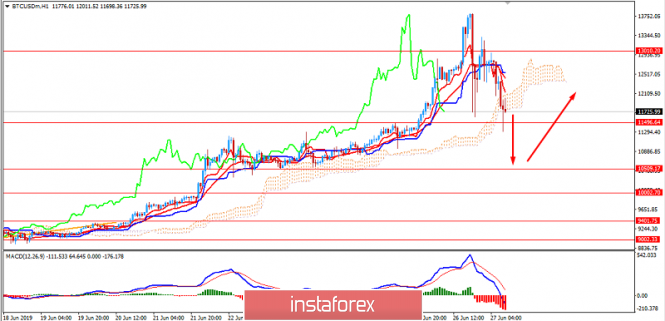
| BTC 06.27.2019 - Strong flag down and order flow change Posted: 27 Jun 2019 08:35 AM PDT Crypto Industry news: As world leaders start arriving for the G20 summit in Osaka, Japan, policymakers and crypto industry representatives are convening at another summit to discuss the implications of proposed global standards for crypto assets and service providers, as well as solutions that will minimize unintended consequences of implementing these standards. It will be very interesting to see what result of the meeting will be and what implication will have on BTC. Trading recommendation:
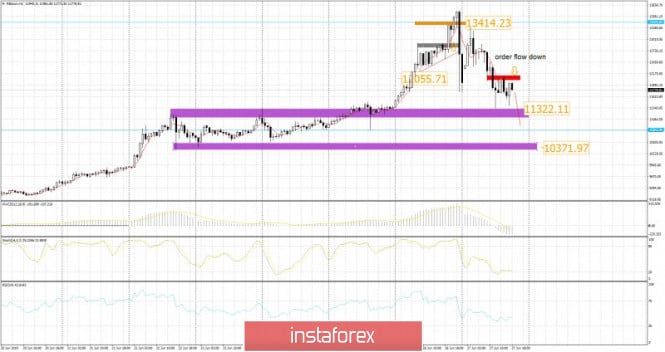
BTC did parabolic up move and it met my yesterdays up target at $13.400. Anyway, after filing my objective I found strong flash down into the area at $11.350. Longs got trapped. The order flow is for the downside and you should watch for selling opportunities. Red rectangle – Important resistance ($12.067) Purple rectangle- Support 1 ($11.332) Purple rectangle – Support 2 ($10.370) I found that there is the change in the order flow from bullish to bearish and that is sign that you should be careful with buying and watch for selling opportunities. MACD oscillator has turned into negative territory, which is sign that buyers became exhausted. Short-term resistance is seen at the price of $12.067 and as long as the Gold is trading below this level, I would watch for selling opportunities on the rallies. From the other side, support levels are seen at the price of $11.322 and at the price of $10.370. Watch for selling opportunities. The material has been provided by InstaForex Company - www.instaforex.com |
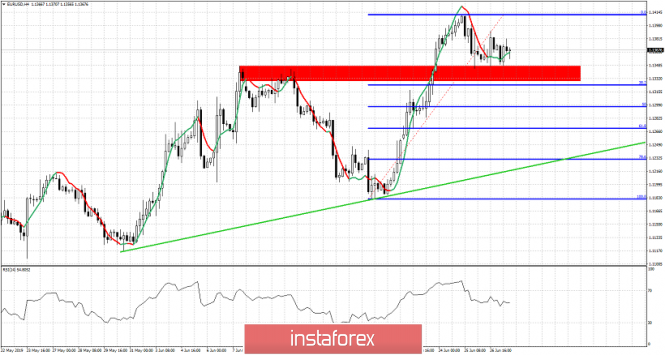
| EURUSD holding above 1.1330-1.1350 support Posted: 27 Jun 2019 08:01 AM PDT EURUSD has pulled back towards our short-term target area of 1.1325-1.1350. Price is mostly moving sideways as the RSI is falling from overbought levels. EURUSD has the potential for another drop lower towards 1.13-1.1280 before resuming its up trend.
Green line - trend line support EURUSD is trading above 1.1350. The break out area of 1.1330-1.1350 has been so far successfully back tested. A new upward move could start from current levels towards 1.17. If however support at 1.1330 fails to hold, we should expect EURUSD to fall towards 1.13-1.1280 area. Holding above the upward sloping green trend line is important for medium-term bullish trend. Until then trend remains bullish. The material has been provided by InstaForex Company - www.instaforex.com |
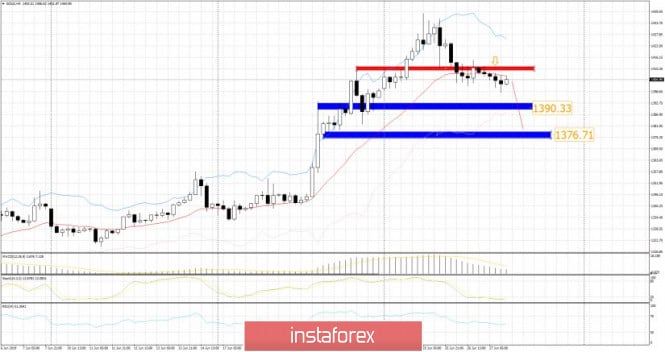
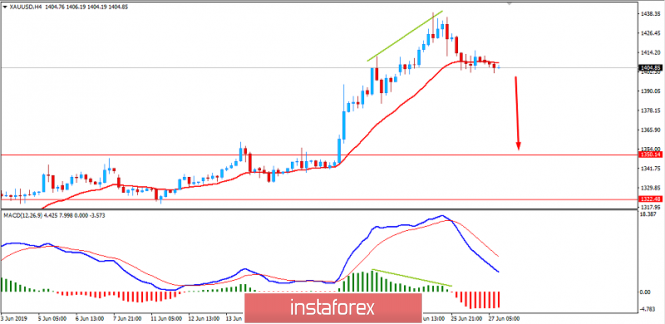
| Gold 06.27.2019 - Change in order flow from bullish to bearish Posted: 27 Jun 2019 08:01 AM PDT Gold has been trading sideways at the price of $1.404. Anyway, I found that there is potential for the more downside on the Gold due to the change in the order flow from bullish to bearish. Watch for selling opportunities.
Red rectangle – Important resistance Blue rectangle- Support 1 Blue rectangle – Support 2 I found that there is the change in the order flow from bullish to bearish and that is sign that you should be careful with buying and watch for selling opportunities. MACD oscillator is decreasing on the upward momentum, which is sign that buyers became exhausted. Key resistance is seen at the price of $1.414 and as long as the Gold is trading below this level, I would watch for selling opportunities on the rallies. From the other side, support levels are seen at the price of $1.390 and at the price of $1.376. Watch for selling opportunities. The material has been provided by InstaForex Company - www.instaforex.com |
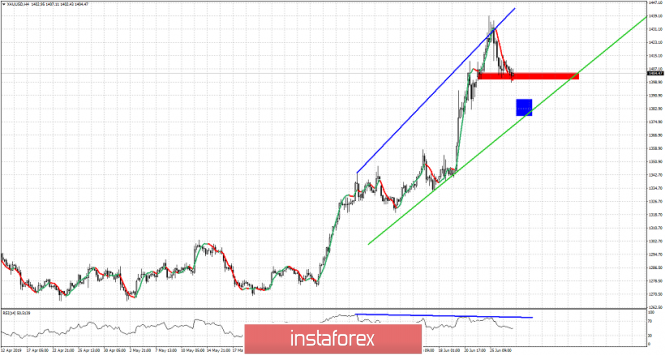
| Gold price above short-term support, risk for a move towards $1,370-75 Posted: 27 Jun 2019 07:56 AM PDT Gold price has reached our short-term pull back target of $1,400. Price is testing short-term support at $1,400 and we could see another leg lower towards $1,370-80 if we break below $1,400. Medium-term trend remains bullish.
Green line - support trend line Red rectangle - short-term horizontal support Blue rectangle -target if red support fails to hold Gold price continues to make higher highs and higher lows. Now we are at a phase where bulls expect a higher low to be formed. Most probably this low will be close to the break out area of $1,350-60 but not necessarily that low. Most probably price could touch and test the green trend line support before continuing higher. The target area is at $1,370-80 if price breaks below $1,400. Resistance is at $1,416. The material has been provided by InstaForex Company - www.instaforex.com |
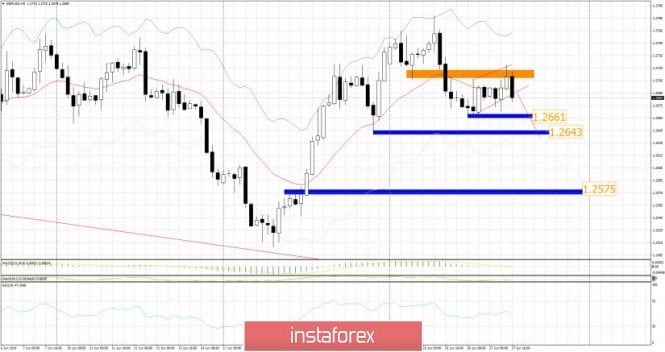
| GBP/USD 06.27.2019 - Broken bear flag on 4H time frame Posted: 27 Jun 2019 07:42 AM PDT GBPUSD has been trading downwards in past 4hours and I see potential more downside to come. GBP found that level of resistance at 1.2722, which is critical for the GBP at this stage. The order flow is on the downside. Watch for selling opportunities
Orange rectangle – Important resistance Blue rectangle- Support 1 Blue rectangle – Support 2 Blue rectangle – Support 3 I found strong rejection of the critical resistance at the price of 1.2722, which is for me strong sign of the weakness and lack of buying interest on the GBP. The RSI oscillator is showing the flip down, which is another confirmation factor for downside. Additionally, I found that bear flag completion pattern, which adds more weakness on the GBP. Support levels are seen at the price of 1.266, 1.2643 and 1.2575. Watch for selling opportunities. The material has been provided by InstaForex Company - www.instaforex.com |
| Posted: 27 Jun 2019 07:29 AM PDT The euro is gradually strengthening, despite the weak data on sentiment in the eurozone economy. Support for risky assets provides news on the trade agreement between the US and China. I have already said that yesterday the US Treasury Secretary stated 90% of the readiness of the agreement between the United States and China. Today, official sources in China noted that the Chinese leader will provide Trump with the terms of the settlement of the trade conflict, and one of the conditions is the lifting of the ban on the sale of Huawei's technology. Also, the Chinese authorities want the US to abolish fines. All this will be discussed by Xi and Trump at lunch, which will be held this Saturday. It is likely that the outcome will be an indication of the possibility of reaching an agreement or worsening trade relations.
As noted above, the sentiment of eurozone companies declined due to the manufacturing sector, which continues to show a slowdown against the backdrop of trade conflicts and weak global growth. Also, problems remain with the issue of the Brexit transaction, which hinders exports. All this seriously affects the trust of companies that look to the future with pessimism. According to the European Commission, the sentiment indicator in the eurozone economy fell in June 2019 to 103.3 points from 105.5 points in May. The confidence of the companies dropped to -5.6 points from -2.9 points in May. All this will necessarily affect the growth of the economy, as it will slow down investment, and also slow down the creation of jobs and the hiring of new workers. As for the technical picture of the pair EURUSD, it remains unchanged compared with the morning forecast. The bulls are still clearly resisted, and further short-term downward correction will be the envy of a major support level of 1.1350. Only then can we expect the demolition of a number of stop orders and a more rapid decline in the trading instrument in the area of 1.1317 and 1.1280. However, it should be understood that if the level of 1.1350 will continue to hold by all means, then the emerging technical model may lead to a new, larger growth of risky assets, and a breakthrough of the resistance of 1.1410 will be a signal to open long positions in the expectation of updating the highs in the area of 1.1490 and 1.1570.
Today, there is also news that, despite significant political and economic disagreements between Iran and the United States, which could lead to a military conflict, Tehran has not yet violated one of the key limits set in the 2015 nuclear agreement. This was announced today by European diplomats, which leaves a chance to prevent the collapse of the deal, from which only the United States has come out. Let me remind you that last week, Iran declared that by June 27, it would exceed the limit on the volume of enriched uranium, amounting to 300 kg, but Tehran is still close to the limit but did not go beyond it. If in the near future, the EU does not receive news on the new mechanism of financial conditions for cooperation with Iran, bypassing US sanctions, which was announced earlier this week, the limit is likely to be broken and the situation will seriously deteriorate. The material has been provided by InstaForex Company - www.instaforex.com |
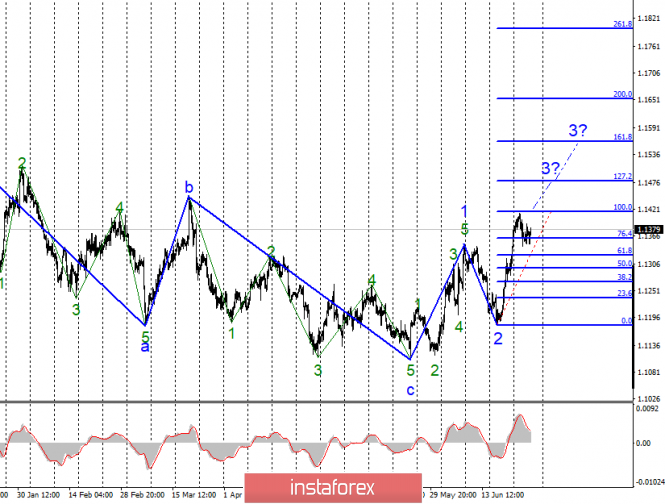
| Wave analysis of EUR/USD and GBP/USD. Overall picture Posted: 27 Jun 2019 07:28 AM PDT EUR/USD
The overall wave counting of the EUR/USD pair is not completely unambiguous, but still quite rational and looks convincing. A minimum of May 23 is now considered as the end of the downward section of the trend. However, the main questions are not connected with this, whether we will see a full 5-wave upward section of the trend or it will end with three waves up and a new impulse down? So far, the wave pattern after May 23 also looks quite convincing and implies the further construction of wave 3, which can turn out to be very long, which fits perfectly into the hypothesis of 5 waves up. From my point of view, the only thing that can prevent this is the news background. In June, it was definitely on the side of the euro, but what will happen in July? If the Fed does reduce the key rate, as the markets expect, it will be a weighty argument for the bulls on the euro/dollar instrument. And thanks to such actions of the Fed, the increase in the instrument can be continued. As a confirmation of the further increase, we are waiting for the MACD up signal or a successful attempt to break through the Fibonacci level of 100.0%. GBP/USD
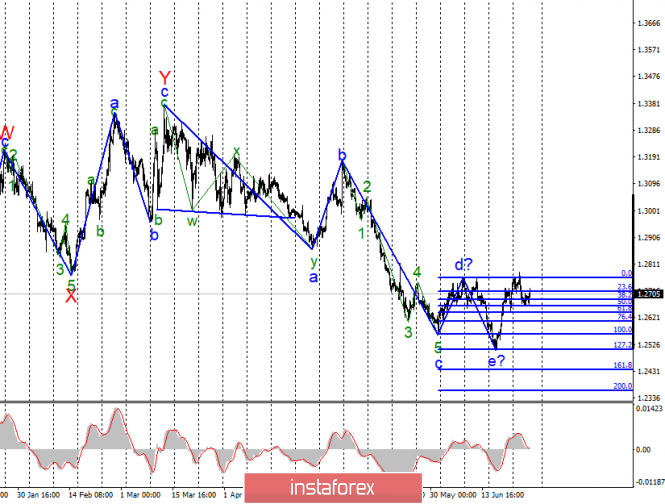
The GBP/USD pair is expected to complete the downward part of the trend, which starts on March 14. However, an unsuccessful attempt to break the maximum of the expected wave d makes us think about the readiness of the instrument to build a new upward trend segment. If the growth of the euro can prevent a positive news background from the United States, the growth of the pound can prevent a whole group of factors, in addition to economic news from the United States. Here, it is worth remembering the Brexit, which has lasted for three years, as well as the election of a new leader of the Conservative Party instead of the retired Theresa May and, accordingly, the new Prime Minister. It is clear that such serious political changes can affect the foreign economic policy of the UK and, of course, Brexit. Thus, on this topic over time, new information may come, which are contrary to the wave pattern, suggesting an upward trend. The material has been provided by InstaForex Company - www.instaforex.com |
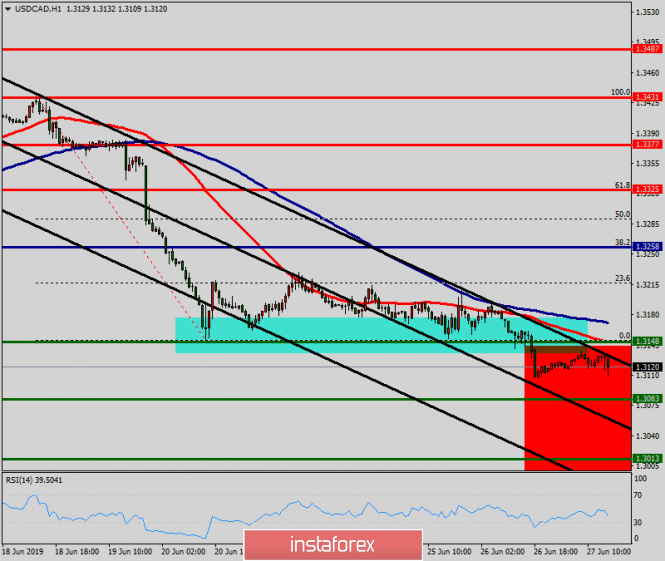
| Technical analysis of USD/CAD for June 27, 2019 Posted: 27 Jun 2019 06:58 AM PDT Overview: The USD/CAD pair continues to move downwards from the level of 1.3258. Last week, the pair dropped from the level of 1.3258 (this level of 0.9965 coincides with the double top) to the bottom around 1.3148. Today, the first resistance level is seen at 1.3258 followed by 1.3325, while daily support 1 is found at 1.3148. Also, the level of 1.3258 represents a weekly pivot point for that it is acting as major resistance/support this week. Amid the previous events, the pair is still in a downtrend, because the USD/CAD pair is trading in a bearish trend from the new resistance line of 1.3258 towards the first support level at 1.3038 in order to test it. If the pair succeeds to pass through the level of 1.3038, the market will indicate a bearish opportunity below the level of 1.3038 in order to continue towards the point of 1.3013. However, if a breakout happens at the resistance level of 1.3325, then this scenario may be invalidated. The material has been provided by InstaForex Company - www.instaforex.com |
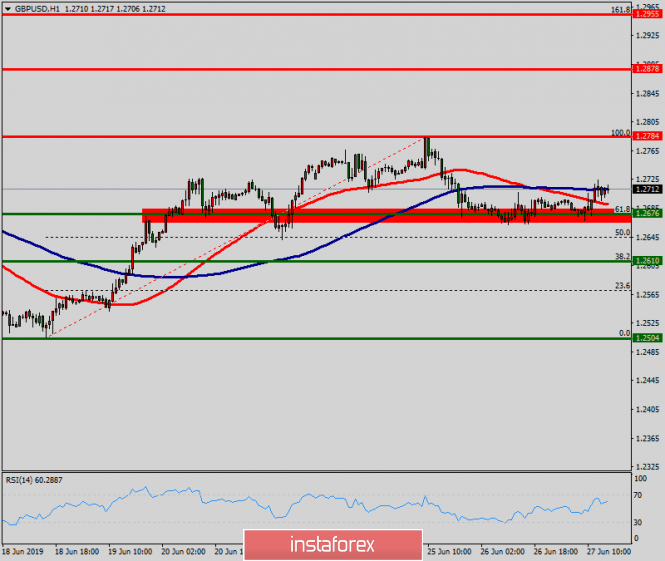
| Technical analysis of GBP/USD for June 27, 2019 Posted: 27 Jun 2019 06:25 AM PDT The GBP/USD pair will continue to rise from the level of 1.2676. The support is found at the level of 1.2676, which represents the 61.8% Fibonacci retracement level in the H1 time frame. The price is likely to form a double bottom. Today, the major support is seen at 1.2676, while immediate resistance is seen at 1.2784. Accordingly, the GBP/USD pair is showing signs of strength following a breakout of a high at 1.2784. So, buy above the level of 1.2784 with the first target at 1.2878 in order to test the daily resistance 1 and move further to 1.2955. Also, the level of 1.2955 is a good place to take profit because it will form the last bullish wave. Amid the previous events, the pair is still in an uptrend; for that we expect the GBP/USD pair to climb from 1.2700 to 1.2955 in coming hours. At the same time, in case a reversal takes place and the GBP/USD pair breaks through the support level of 1.2676, a further decline to 1.2610 can occur, which would indicate a bearish market. The material has been provided by InstaForex Company - www.instaforex.com |
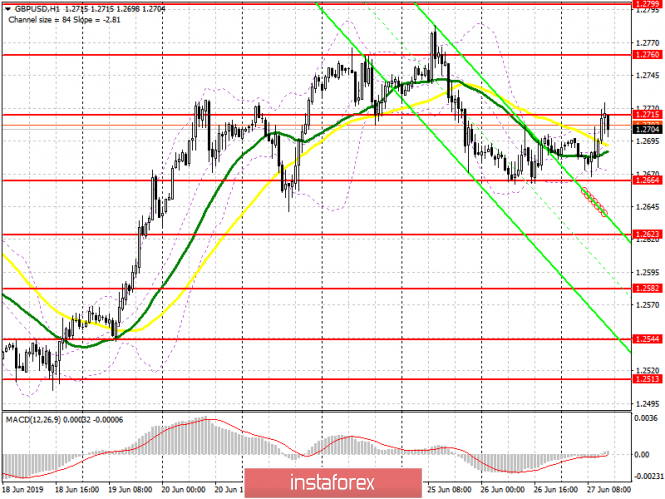
| Posted: 27 Jun 2019 06:13 AM PDT To open long positions on GBP/USD, you need: In the first half of the day, buyers of the pound managed to push off the support of 1.2665 and are now trying to break above the middle of the wide side channel 1.2715. If they manage to do this against the background of weak fundamental data on the US, further growth of GBP/USD will lead to an update of the upper limit of the channel in the area of 1.2760, where I recommend taking the profit. In the scenario of the pound decline, the same good level of support will be the area of 1.2664, from which it is possible to open long positions if a false breakout is formed. It is best to buy a pound for a rebound from a new low of 1.2623. To open short positions on GBP/USD, you need: Bears will count on a good report on US GDP and on keeping the pair below the resistance of 1.2715. While trading under this range, the probability of continuing the downward correction will remain very high, and the bears' target for the second half of the day will be the level of 1.2664. A break in this range will result in lows of 1.2623 and 1.2582. In the GBP/USD growth scenario above the middle channel of 1.2715, it is best to return to the short positions on the rebound from the resistance of 1.2760. Indicator signals: Moving Averages Trading is conducted in the area of 30 and 50 moving averages, which indicates a market equilibrium. Bollinger Bands The breakthrough of the lower boundary of the indicator in the area of 1.2667 will increase the chance of a bearish market.
Description of indicators
|
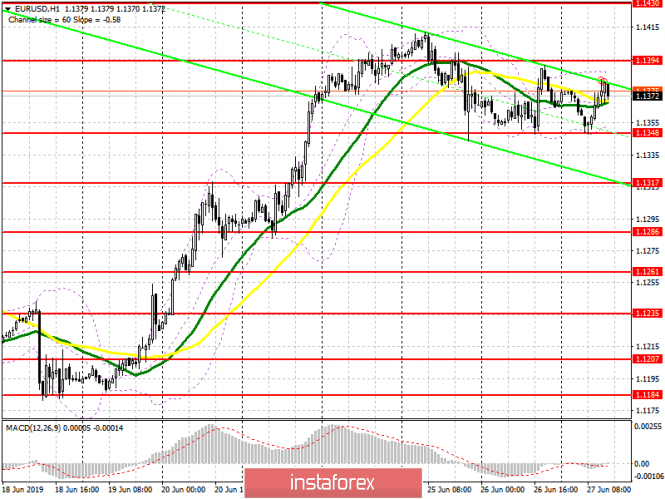
| Posted: 27 Jun 2019 06:13 AM PDT To open long positions on EURUSD, you need: Already every day, buyers of the euro keep the level of 1.1348 and try to build an upward trend. The situation has not changed compared to the morning forecast. It is best to return to long positions on a false breakout from the level of 1.1348, after updating the low of yesterday, or on a rebound from larger support of 1.1317. The main task of buyers will be the resistance test of 1.1394, where I recommend taking the profit. The break of this range will resume the upward trend and continue the growth of EUR/USD in the area of highs 1.1430 and 1.1459. To open short positions on EURUSD, you need: Data on the US economy may make changes in the market. In the case of the revision of the GDP report for the 1st quarter, the position of the US dollar will weaken again. It is better to consider short positions for a rebound from the resistance of 1.1394, but the main task of the bears will be to return to the support of 1.1348, on which the further downward correction depends. Only its breakthrough will lead to a larger decline in EUR/USD in the area of lows 1.1317 and 1.1286, where I recommend taking the profit. Indicator signals: Moving Averages Trading is conducted in the region of 30 and 50 moving averages, which indicates the balance of buyers and sellers in the short term. Bollinger Bands The breakthrough of the lower limit of the indicator in the area of 1.1348 will lead to a larger fall of the euro. Going beyond the upper limit of the indicator in the area of 1.1394 will lead to an increase in EUR/USD.
Description of indicators
|
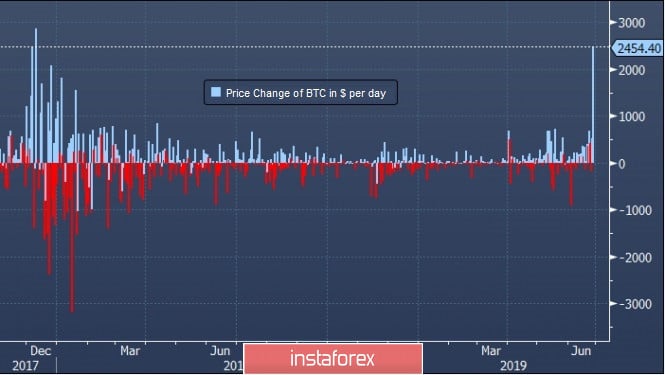
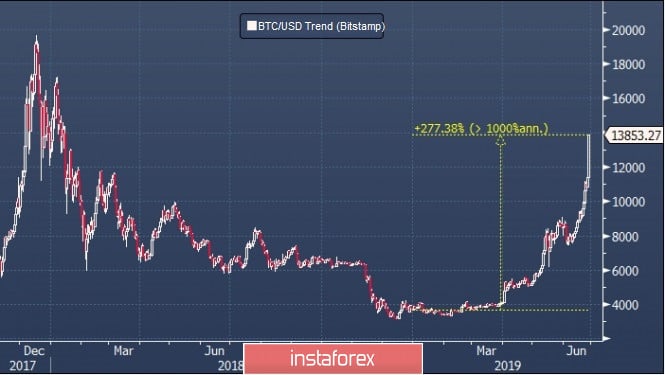
| Rally in full swing: Bitcoin conquers new heights Posted: 27 Jun 2019 06:04 AM PDT The rally of bitcoin number 1 lasted for the past eight days that led to dizzying results. The leading digital currency has risen in price by a fantastic percentage of 277% since the beginning of the current year and continues to ascend. During the trading session on Wednesday, June 26, the bitcoin rate reached an 18-month high and soared to $ 13,722 for 1 BTC. The last time this happened was in January 2018. At the moment, the digital flagship is breaking records, keeping all the virtual market players in suspense. The growth of Bitcoin for the day amounted to 21.56%, which is the maximum intraday percentage rise in prices since 2016. Note that in December 2017, when BTC set an absolute price record just below $20,000 for 1 BTC, the daily growth rates were lower than today. According to analysts, the day-Bitcoin rose by $2,454, which is the maximum increase since mid-December 2017, as experts emphasized. Experts point out that the current year for Bitcoin is very different from 2017 when BTC set its record. Two years ago, investors came into digital assets interested in holding an ICO (initial placement of coins). They were worried about investment schemes in start-up projects bypassing banks and venture companies. Startups used blockchain technology to create their own tokens and sell them to investors. BTC futures market then did not exist yet. At the moment, the situation has changed. The trading volume of bitcoin derivatives in the last few days has risen sharply. According to Michael Moreau, head of Genesis Global Trading, participants in the virtual market who have access to spot trading and futures trading buy them on the spot market and open short positions in the futures market. One of the drivers of the revitalization of the virtual assets market after a long "Cryptozyme" that began in 2018. Experts consider the statement by Facebook's largest social network to develop its own cryptocurrency Libra. According to analysts, this gave impetus to the entire digital market and caused the active interest of most investors. The Bitcoin rate went up steadily and the rally of cryptocurrency number 1 is gaining momentum, which is not going to stop. Since the beginning of 2019, Bitcoin has risen by 277% in priced and it has already formed an 8-day series of fortifications. At present, the Bitcoin rate continues its uptrend with surprising acceleration. However, experts warn against excessive euphoria, pointing to signs of BTC overbought, which sooner or later manifest itself. It can lead to another collapse of the financial "bubble" and bring down the cryptocurrency exchange rate of number 1. According to analysts, a further acceleration of price movements without a small correction is unlikely. |
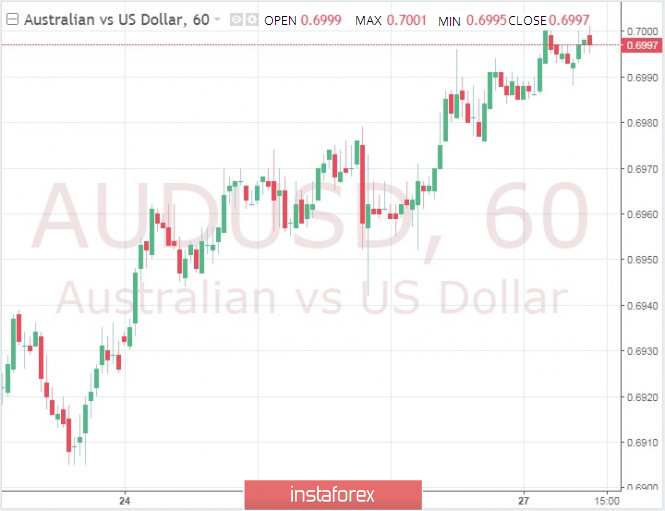
| Australian dollar is preparing to reduce the rate to 0.75% Posted: 27 Jun 2019 04:25 AM PDT It is expected that the Central Bank of Australia, stimulating growth and inflation, will reduce the base rate this year two more times to an unprecedented low of 0.75%. Almost 70% of the 40% of economists surveyed expect the Reserve Bank of Australia (RBA) to cut its cash rate to a record low of 1% at its meeting on Tuesday and implement another cut to 0.75% by the end of the year. "The key driving force of future rate cuts, apparently, is the level of unemployment, or, more precisely, the degree of spare capacity in the labor market and the economy," economist George Taren said. Employment is growing at 2.6% per year, even though annual gross domestic product growth has slowed to below 2%. But this rapid pace is still not enough to reduce unemployment. The RBA expects the economy to start putting pressure on wages only when the unemployment rate drops to at least 4.5% from the current 5.2%. In light of these expectations, economists believe that the RBA will act more actively. "Given that the domestic and global economic environment is likely to remain weak, we expect the market to continue to discuss possible further rate cuts, effective zero lower bound and possible unconventional monetary measures," Morgan Stanley economist Chris Reed said. The RBA, which has a reputation as a bank that "reluctantly reduces interest rates," reduced the rate to 1.25% for the first time in almost three years this month, joining a group of global central banks that have either weakened their policies or announced plans soon. The RBA took this step after the latest data painted a grim picture of an economy of $1.3 trillion, whose growth is slowing, where real estate prices are falling, household spending is falling, wages remain at the same level, and inflation is very low. The material has been provided by InstaForex Company - www.instaforex.com |
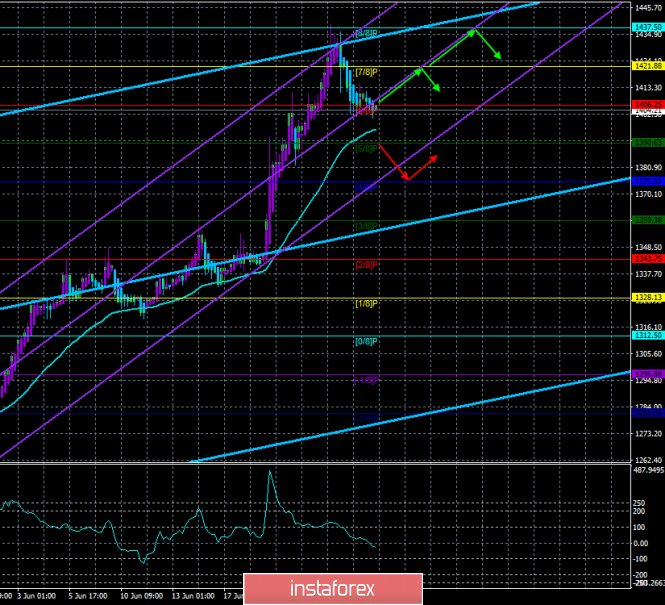
| Gold. June 27th. Trading system "Regression Channels". The US dollar is adjusted, gold - after Posted: 27 Jun 2019 04:25 AM PDT 4-hour timeframe
Technical data: The upper linear regression channel: direction – up. The lower linear regression channel:: direction – up. The moving average (20; smoothed) – up. CCI: -24.4108 Gold rose in price throughout the month of June, which forced many experts and analysts to conclude that the demand for the most famous precious metal grew against the backdrop of a possible Fed rate cut or various geopolitical risks and trade wars. We believe that gold grew only for one reason – the US dollar became cheaper due to the failed macroeconomic statistics. And since the value of gold is measured in dollars, it turned out that the price grew. This conclusion applies only to the last 4 weeks, and not to the entire upward trend in gold. Now, when in the last two days, the US dollar has grown slightly (banal and expected correction), gold also began to move down, completely repeating the dynamics of some currency pairs. Thus, we believe that in the near future, the gold rate will continue to depend on the US dollar. To this trend, you can add an analysis of technical indicators that clearly show the direction of the trend. Now, this is an upward trend, respectively, long positions are relevant, and short positions are recommended to be considered not earlier than the consolidation below the moving average. Nearest support levels: S1 – 1406.25 S2 – 1390.63 S3 – 1375.00 Nearest resistance levels: R1 – 1421.88 R2 – 1437.50 R3 – 1453.13 Trading recommendations: Gold began to adjust. Thus, it is recommended to wait for the turn of Heiken Ashi upward and trade for an increase with the targets at 1421.88 and 1437.50. Sell orders will become relevant not earlier than overcoming the moving traders with the first targets at 1375.00 and 1359.38 and small lots since both channels of linear regression are directed upward. In addition to the technical picture should also take into account the fundamental data and the time of their release. Explanation of illustrations: The upper linear regression channel – the blue line of the unidirectional movement. The lower linear regression channel – the purple line of the unidirectional movement. CCI – the blue line in the indicator window. The moving average (20; smoothed) is the blue line on the price chart. Murray levels – multi-colored horizontal stripes. Heiken Ashi is an indicator that colors bars in blue or purple. The material has been provided by InstaForex Company - www.instaforex.com |
| Why BITCOIN sinks having touched $14,000? June 27, 2019 Posted: 27 Jun 2019 04:16 AM PDT Bitcoin moved lower as expected. It is currently going back to the mean having reached $14,000 with impulsive pressure. Earlier, it managed to gain and sustain impulsive bullish momentum after breaching above $11,500 area with a daily close which came to an end after counter bearish pressure pushed the price by more than $2,000 lower with a single hourly candle. Bitcoin has found itself on a firmly established bull market over the past several months, surging from its 2018 lows of $3,400 to highs last night of $13,000, which is only a stone's throw away from Bitcoin's previously established all-time-highs of roughly $20,000. It is believed that the overall crypto market is going to follow the Bitcoin's footprints. However, it was not quite the situation at the current market formation. Bitcoin's latest move upwards signals strong bullish momentum that the cryptocurrency regained after it moved above $10,000. The firm uptrend is likely to extend significantly in the near future. Recent flash crash wiping off $2,000 and more in a single move aroused a question about the reliability of the bullish run. However, a wave retracement inside the overall bullish bias indicates further upward pressure. A daily volume hit an all-time high of $45 billion a few hours ago. So, a natural cooling off is expected. BTC market capitalization also peaked to $245 billion but $25 billion has left the digital asset since then. From the technical viewpooint, Bitcoin is at the verge of completing the 5-wave cycle. The price is currently correcting at near $11,500. Bearish pressure is strongly impulsive while breaking below the Kumo cloud support. This price action indicates further downward pressure along the way. The Chikou Span is breaking below the price line while the price broke below $12,000. This indicates the bearish correction in the play which could lead to further corrective bearish momentum along the way. As the support area lies at $10,500 and $11,500, certain correction and growing volatility may be observed along the way before the price resumes a rapid rally with a target towards $15,000 in the coming days. SUPPORT: 10,500, 11,500 RESISTANCE: 12,000, 13,000, 14,000 BIAS: BULLISH MOMENTUM: VOLATILE
|
| Safe haven gold to lose momentum? June 27, 2019 Posted: 27 Jun 2019 03:48 AM PDT Safe haven gold has been winning favor with investors amid uncertainty in the global economy. The precious metal managed to sustain and retain momentum above $1,400. However, analysts expect a retracement along the way before the price hits the $1,500 psychological level. Gold price dipped for a while for some reasons. Golg is taking advantage of the weaker US dollar. However, USD bulls have again entered the market. Federal Reserve Chairman Jerome Powell said in a speech on Tuesday that monetary policy would be accommodative to ensure sustainable growth growth of the US economy. Moreover, investors are betting on a half-point rate cut at the nearest policy meeting in July. This scenario will continue feeding the rally in gold. Another most important point to focus on is relations between US President Trump and Fed Chairman Powell. As their relation gets worse, gold may regain momentum. If the Fed opts for a smaller-than-expected rate cut, of say 25 basis points, it will probably amplify Trump's criticism of both the central bank and the Fed chairman. Donald Trump is putting pressure on the central bank for the rate cut. Besides, the President also threatened to remove Jerom Powell from his position. To sum up, gold is expected to pull back towards $1,320-50 before it resumes the bullish trend. Though the overall bias strongly bullish, the current price is far from the mean i.e. dynamic level of 20 EMA that indicates further bearish pressure. The price has formed bearish divergence supporting downward pressure. This has already increased the probability but the price needs to be carefully monitored as the bullish bias is very strong at the moment. SUPPORT: 1,290, 1,300, 1,320, 1,350 RESISTANCE: 1,400, 1,425, 1,450, 1,500 BIAS: BULLISH MOMENTUM: VOLATILE
|
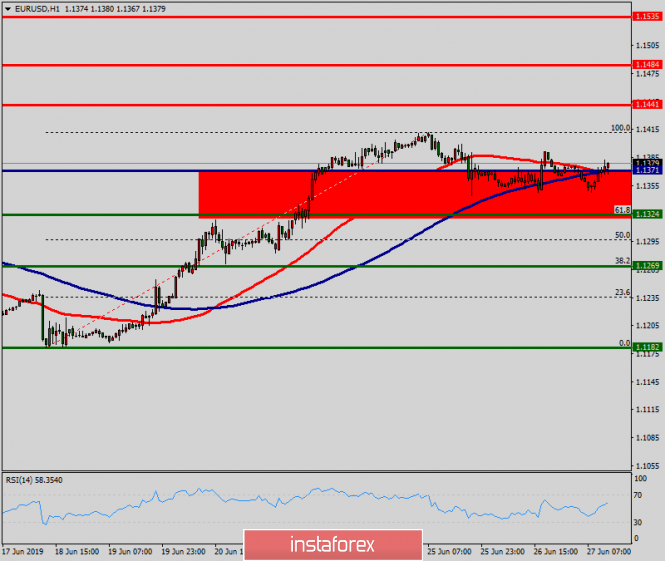
| Technical analysis of EUR/USD for June 27, 2019 Posted: 27 Jun 2019 03:47 AM PDT The EUR/USD pair continues to move upwards from the level of 1.1371. Yesterday, the pair rose from the level of 1.1324 to a top around 1.1420. Today, the first resistance level is seen at 1.1441 followed by 1.1484, while daily support 1 is seen at 1.1324 (61.8.% Fibonacci retracement). According to the previous events, the EUR/USD pair is still moving between the levels of 1.1371 and 1.1441; so we expect a range of 70 pips at least. Furthermore, if the trend is able to break out through the first resistance level at 1.1441, we should see the pair climbing towards the level of 1.1484 to test it. Therefore, buy above the level of 1.1371 with the first target at 1.1441 in order to test the daily resistance 1 and further to 1.1484. Also, it might be noted that the level of 1.1484 is a good place to take profit because it will form a new double top. On the other hand, in case a reversal takes place and the EUR/USD pair breaks through the support level of 1.1371, a further decline to 1.1324 can occur which would indicate a bearish market. The material has been provided by InstaForex Company - www.instaforex.com |
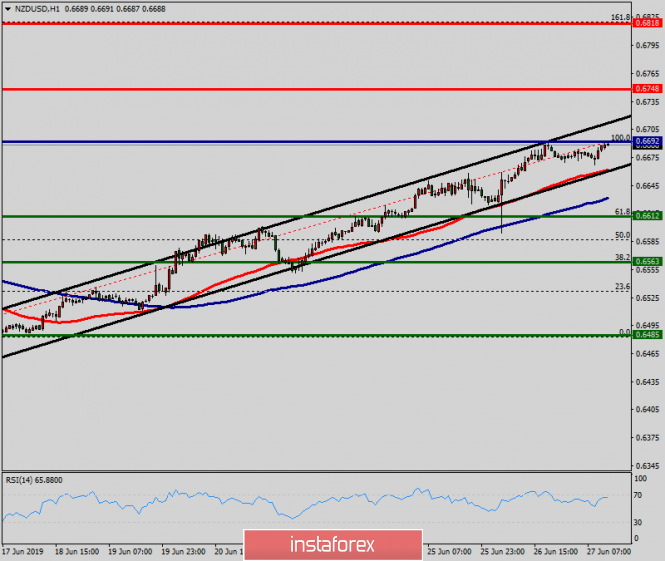
| Technical analysis of NZD/USD for May 27, 2019 Posted: 27 Jun 2019 03:43 AM PDT The NZD/USD pair broke the resistance that turned into strong support at the level of 0.6612 this week. The level of 0.9966 coincides with a golden ratio (61.8% of Fibonacci), which is expected to act as a major support on the H1 chart today. Consequently, the first support is set at the level of 0.6612. Moreover, the RSI starts signaling an upward trend, and the trend is still showing strength above the moving average (100). Hence, the market is indicating a bullish opportunity above the area of 0.6612. So, the market is likely to show signs of a bullish trend around 0.6612 - 0.6650. In other words, buy orders are recommended above the ratio of 61.8% Fibonacci (0.6612) with the first target at the level of 0.6748 in order to test last bullish wave in the same time frame. If the pair succeeds to pass through the level of 0.6748, the market will probably continue towards the next objective at 0.6818 . The daily strong support is seen at 0.6612. Thus, if a breakout happens at the support level of 0.6612/0.6600, then this scenario may be invalidated. The material has been provided by InstaForex Company - www.instaforex.com |
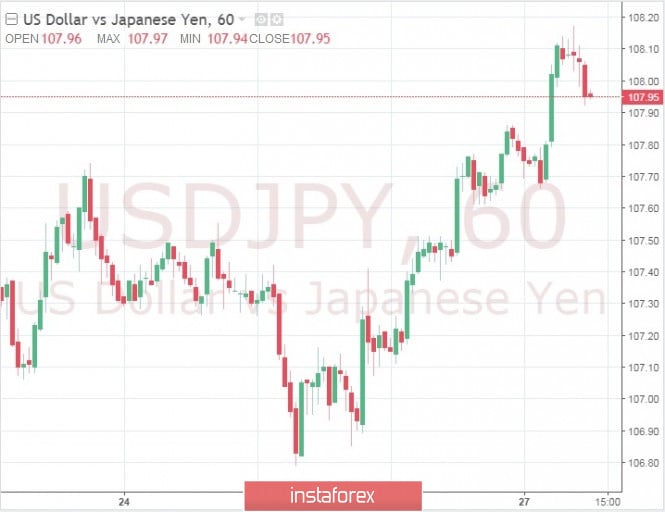
| The dollar is rising against the yen, the fate of the Fed rates will be determined in the G20 summit Posted: 27 Jun 2019 03:06 AM PDT The dollar does not intend to give in to a general panic. The American rose to a weekly high against the yen as some doubts of investors weakened before the G20 summit in Japan amid hopes for progress in resolving the trade conflict between the US and China. For example, the Hong Kong newspaper South China Morning Post cited sources reporting that the United States and China had agreed on a preliminary armistice on the eve of the meeting of the leaders from the two countries on Saturday on the sidelines of the G20 summit. Prior to this, the currency was supported by US Treasury Secretary Stephen Mnuchin, who said that the US-China trade agreement was "nearly 90% complete." Investors should also pay attention to the consequences of resolving a trade dispute between the two largest economies in the world. "While the market fluctuates depending on the news headlines about the US and China, the real attention to the G20 summit is focused on China's low economic growth and its impact on the markets. At the same time, if the relations between the US and China improve after the G20, China will most likely no longer rush to measures to model its economy," said Makoto Noji, SMBC Nikko Securities. In addition, the outcome of the summit will affect the position of the Fed, which so far opened the way to a possible easing of monetary policy in the coming months. "The potential implications of the Trump-C meeting for US monetary policy are enormous. If both parties agree not to impose additional tariffs, the Fed will no longer need to cut rates. On the contrary, if negotiations lead to the introduction of a larger number of tariffs, this may push some officials to lower interest rates", assured by Masafumi Yamamoto of Mizuho Securities. The material has been provided by InstaForex Company - www.instaforex.com |
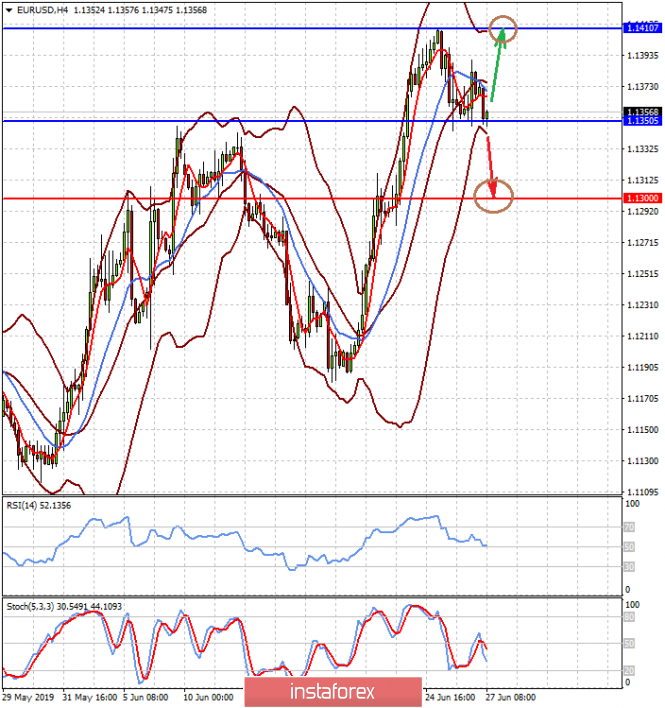
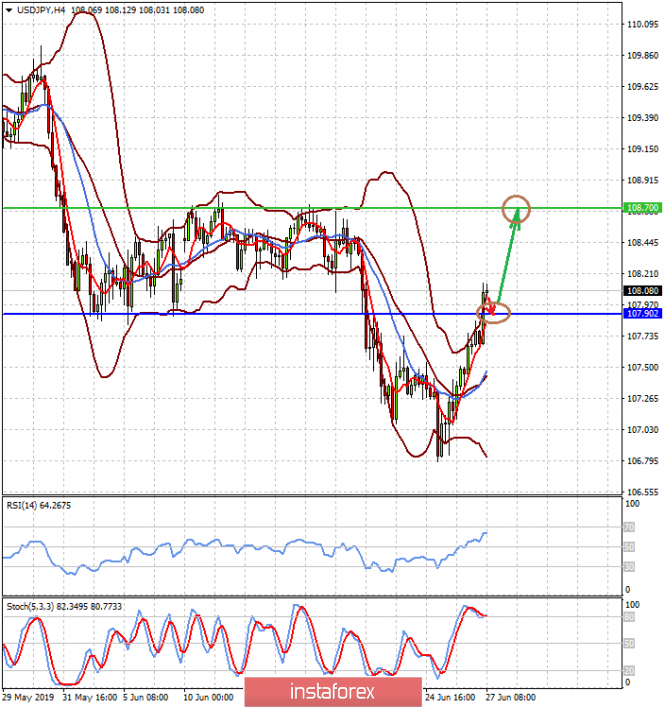
| Only weak US statistics will put pressure on the dollar Posted: 27 Jun 2019 03:02 AM PDT The weakening of the US dollar in the foreign exchange markets stopped on the wave of a slight decrease in expectations of a more aggressive reduction in interest rates by the Fed. This happened after the speech of the Central Bank head, Jerome Powell. Although, he spoke about the likelihood of the beginning of the process of lowering interest rates, but still regarded as a hypothetical event. One more negative was the statement earlier this week by the President of the Federal Reserve Bank of St. Louis James Bullard, who said that he had changed his point of view and believed that the key interest rate should not be lowered by 0.50% at once in the regulator's meeting, whereas 0.25% is enough. Earlier, investors actually tuned in on the fact that the Fed may be more aggressive in approaching the process of lowering interest rates, which put noticeable pressure on the US dollar rate. However, after the speeches of Powell, Bullard and some other representatives of the bank, these sentiments did not disappear. Although, they were somewhat corrected. Now, the markets believe that the key interest rate can be reduced by 0.25% following the results of the meeting on July 31. It is worth noting here that the keyword is "reduced". Hence, we expect that the dollar rate in the current situation will still decline, perhaps not so vigorously. Another negative for him may be the data published today by the US GDP for the first quarter if they turn out to be weaker than expectations. The indicator is expected to show a sustained growth rate of 3.1%. In addition to these data, the values of the index of pending sales in the real estate market will attract attention today. It is assumed that it will show a 1.1% growth in May against a 1.5% drop in April. If the data turns out to be weaker than expected, this will also serve as a pretext for resuming the sale of the American dollar. In fact, assessing the current market sentiment regarding the prospects for the monetary policy of the Fed, we can say that investors proceed from the principle that any signals of a slowdown in the American economy, an external negative based on the factor of the trade war between Washington and Beijing, will force the Central Bank to soften the course of monetary policy. This means that we should expect a further decline in the US dollar in the foreign exchange markets on this wave. Forecast of the day: The EUR/USD pair is above the level of 1.1350. If the economic statistics from the United States are above expectations, this may lead to a continuation of the local decline of the pair to 1.1300. At the same time, if it is weaker, this may lead to a resumption of price growth to 1.1410. The USD/JPY pair is trading above 107.90 in the wake of a slight decrease in tension around the topic of a possible military conflict between the US and Iran. Preservation of such sentiments, as well as probable positive data from America that may push the pair to further growth towards 108.70 after a possible small correction to 107.90.
|
| You are subscribed to email updates from Forex analysis review. To stop receiving these emails, you may unsubscribe now. | Email delivery powered by Google |
| Google, 1600 Amphitheatre Parkway, Mountain View, CA 94043, United States | |





No comments:
Post a Comment