
Analyst Articles – Forex News 24 |
- S&P 500, Dow Jones, Russell 2000 Technical Landscape is Getting Interesting
- Volatility Begins to Awaken as Brexit Risks are Priced In
- Crude Oil Prices May Rise While Gold Falls as Markets Consolidate
- Leadership Rivals Differ on More Than Just Brexit
- Gold Price Soars Through Resistance, Consolidation Needed Ahead of Next Push
- EURUSD May Rise if Sentiment Data Amplifies Fed Rate Cut Bets
- Dollar Tumbles as 50bp Fed Cut Baked In But Beware EURUSD, AUDUSD Trades
- Gold and APAC Stocks Juiced By Fed’s Williams, Whatever He Meant
- EURGBP Uptrend May Soon Retreat as Pair Test 9-Month Resistance
- Gold Price Rips & USD Dips Sharply as Fed Rate Cut Bets Surge
| S&P 500, Dow Jones, Russell 2000 Technical Landscape is Getting Interesting Posted: 19 Jul 2019 04:10 AM PDT Hits: 0 S&P 500/Dow Jones Technical Outlook:
See how the quarterly forecast has played out what it could mean for the big-picture – Q2 Equity Markets Forecast. S&P 500 pulling back from 3000+, top-side t-lineThe S&P 500 topped 3k last week, notching it for the first time ever. In the process of doing so a top-side trend-line dating back to the January 2018 high was tagged. An interesting confluence of a psychological level and form of resistance. So far, the response has been relatively benign with only a shallow pullback developing. That could change of course, but as long as the market doesn't fall apart, despite resistance, we will have to respect the generally strong trend. If, however, we see the market start to turn lower with aggression, then it is possible it is the beginning of a decline out of a Reverse Symmetrical Triangle (RST), or known to some as a Megaphone pattern. These patterns through their increasingly larger price swings indicate growing instability in a trend and can mark major tops; in this case it would be growing uncertainty in a bull market since 2009 that has been one of the most persistent in history. The time from Jan '18 to now is a large span of time for such a topping pattern to develop, which is in good proportion to the extreme bull market run we've seen since the depths of the GFC. It's implications could be quite sizable. A top and drop could be arriving at an interesting point in time as well given we are heading through the summer towards the fall, a time when stocks have been known to struggle to flat-out get routed. Check out the IG Client Sentiment page to see how retail traders are positioned and what it could potentially mean for various currencies and markets moving forward. S&P 500 Weekly Chart (RST/Megaphone)
S&P 500 Daily Chart (Top-side t-line, 3k area)
Dow Jones also coming off a top-side trend-lineThe Dow Jones is also trading at the trend-line from January 2018. Following the S&P here as it is the broader index, but keep an eye on how the Dow performs relative to it. Dow Jones Daily Chart (top-side t-line)
Continue to watch the Russell 2000 as it lags severelyThe Russell 2000 is an index I have been discussing with increasing regularity due to the glaring divergence in performance versus large-cap stocks. Small divergences amongst indices are normal and nothing to be alarmed about, but when large-caps (as per the SPX) are trading in record territory and small-caps (as per the R2k) are 12% off their record levels, we could have a problem brewing. The lack of interest by market participants to pick up higher risk growth stocks is a warning sign of waning risk appetite. With the S&P already building a bearish topping pattern, this further adds to the notion that growing instability may soon come to push the market in reverse. There are other signs too that perhaps the zeal of market participants to own stocks is on the decline; FAANG has lost some interest as it remains below its yearly and record high. (See: GOOG Weighs on FAANG Like FB Did Last Year…) Russell 2000/S&P 500 Weekly Chart (Major divergence)
To learn more about U.S. indices, check out "The Difference between Dow, Nasdaq, and S&P 500: Major Facts & Opportunities." You can join me every Wednesday at 10 GMT for live analysis on equity indices and commodities, and for the remaining roster of live events, check out the webinar calendar. Tools for Forex & CFD TradersWhether you are a beginning or experienced trader, DailyFX has several resources available to help you; indicator for tracking trader sentiment, quarterly trading forecasts, analytical and educational webinars held daily, trading guides to help you improve trading performance, and one specifically for those who are new to forex. —Written by Paul Robinson, Market Analyst You can follow Paul on Twitter at @PaulRobinsonFX
Can you get moneyed from fx trading? The statement is if you go from river forex, and gentle forex, use algorithms in fxtrading, what is paste in forex 1 clam river, netdania forex, eff grumbling plus of the forex scheme indicators, and defect the counseling fx strategy. We module win win all. |
| Volatility Begins to Awaken as Brexit Risks are Priced In Posted: 19 Jul 2019 03:33 AM PDT Hits: 24 Currency Volatility GBP Talking Point
Top 10 most volatile currency pairs and how to trade them For a more in-depth analysis on FX, check out the Q3 FX Forecast GBP Volatility Will Come Back, Options Beginning to Price in Brexit RisksSince the Brexit extension from the end of March to October 31st, implied volatility in the Pound had crashed to near 5-yr lows. However, with Boris Johnson likely to be announced as Prime Minister next, expectations are now for a tougher Brexit stance between the UK and EU. In turn, demand for options is beginning to rise as investors begin to price in Brexit risks ahead of the October deadline. This has been observed in the rise in premium for 3-month options, which suggests that the market is expecting the Pound to be increasingly volatile in the run up to the October deadline and will likely continue to increase as the tenor covers the exit date. Since the lows in July, implied vols have jumped over 2 vols from 6.475 to 8.85, which marks a 36% increase in the price in 11-days. However, this does remain heavily below highs of 15 vols ahead of the first deadline. Source: Thomson Reuters, DailyFX: Sterling (GBP) 3-6-month option implied volatility. GBPUSD Has Been the Cleanest Way to Trade Brexit RisksSince the UK referendum sentiment regarding Brexit has been expressed most clearly through trading GBP, which since the peak in May has been dropped over 5%. Of course, this has not solely been down to Brexit, factors have included a dovish shift from BoE Governor Carney, alongside weak economic data, prompting GBPUSD to fall to a fresh 27month low having briefly dipped below 1.24. How are Markets Positioned for GBP?Given the factors mentioned above and with the Brexit noise beginning to increase once Boris Johnson is announced as the next Prime Minister, risks continue to remain tilted to the downside for GBP. This has also been reflected in speculative positioning, which shows that markets hold sizeable net shorts in GBPUSD (-29.5%). However, while shorts maybe at 2019 highs, this is still some way off highs in 2018 (-34.5%) and the record high in 2017 (-43.4%), suggesting that current levels are not extreme, thus there is room for speculators to add to their bearish positions.
Source: Thomson Reuters, DailyFX — Written by Justin McQueen, Market Analyst To contact Justin, email him at Justin.mcqueen@ig.com Follow Justin on Twitter @JMcQueenFX http://platform.twitter.com/widgets.js Can you get moneyed from fx trading? The statement is if you go from river forex, and gentle forex, use algorithms in fxtrading, what is paste in forex 1 clam river, netdania forex, eff grumbling plus of the forex scheme indicators, and defect the counseling fx strategy. We module win win all. |
| Crude Oil Prices May Rise While Gold Falls as Markets Consolidate Posted: 19 Jul 2019 02:17 AM PDT Hits: 10 CRUDE OIL & GOLD TALKING POINTS:
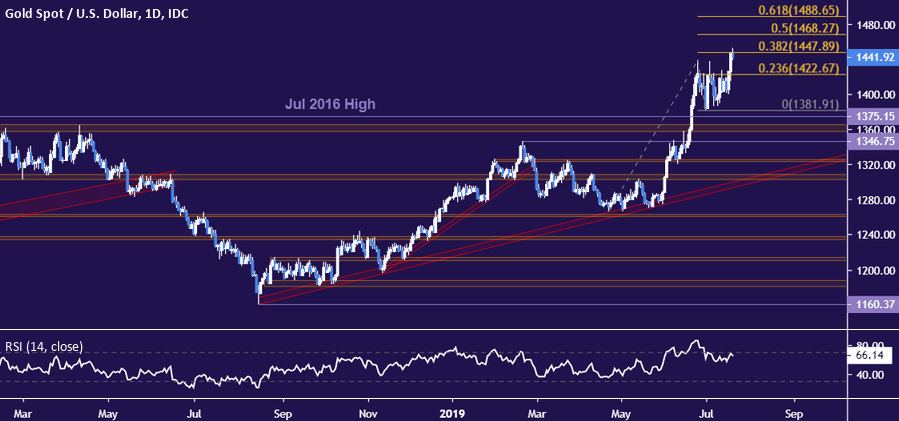
Crude oil prices continued to sink, driven lower by lingering worries about oversupply as demand softens alongside global growth while US output continues to hover near record levels. Reports saying that Iranian Foreign Minister Javad Zarif offered the US a deal to whereby Tehran would permanently accept enhanced nuclear program in exchange for the lifting of all sanctions probably helped as well. Gold prices shot higher as New York Fed President John Williams treated investors to another round of dovish pronouncements on the direction of monetary policy. Yields fell alongside the US Dollar. The markets now see an almost even chance that the US central bank will deliver 50bps in stimulus rather than the customary 25bps after the next meeting of the rate-setting FOMC committee on July 31. CRUDE OIL, GOLD PRICES MAY RETRACE RECENT MOVES INTO THE WEEK-ENDThe University of Michigan gauge of US consumer confidence headlines a quiet data docket in the final hours of the trading week. US economic data has tended to undershoot baseline forecasts recently, warning that expectations for a modest uptick may be disappointed. It seems unlikely that this has scope to drive much more of a dovish shift in already stretched Fed stimulus bets however. This might leave room for sentiment trends to dominate price action. Bellwether S&P 500 futures are pointing higher in late Asia Pacific trade, pointing to a risk-on tilt in the prevailing market mood. That might help engineer a corrective uptick for cycle-sensitive crude oil prices. Bond yields might retrace some recent losses as well, echoing as a pullback for gold into the weekly trading close. Get the latest gold and crude oil forecasts to see what will drive prices in the third quarter! GOLD TECHNICAL ANALYSISGold prices shot higher from a choppy congestion range to challenge the 38.2% Fibonacci expansion at 1447.89. A daily close above that exposes the 50% level at 1468.27. Alternatively, a reversal back below the 23.6% Fib at 1422.67 sets the stage to retest a dense support block starting at 1381.91. CRUDE OIL TECHNICAL ANALYSISCrude oil prices continue to test support at 54.84 having broken support guiding the up move from mid-June. Breaking below that on a daily closing basis targets the 49.41-50.60 zone next. Alternatively, a turn back above resistance at 58.19 paves the way for another challenge of the 60.04-84 region.
COMMODITY TRADING RESOURCES— Written by Ilya Spivak, Currency Strategist for DailyFX.com To contact Ilya, use the comments section below or @IlyaSpivak on Twitter http://platform.twitter.com/widgets.js Can you get moneyed from fx trading? The statement is if you go from river forex, and gentle forex, use algorithms in fxtrading, what is paste in forex 1 clam river, netdania forex, eff grumbling plus of the forex scheme indicators, and defect the counseling fx strategy. We module win win all. |
| Leadership Rivals Differ on More Than Just Brexit Posted: 19 Jul 2019 01:39 AM PDT Hits: 23 Talking Points:
As the Tory leadership race draws closer to the end with expectations that a new Prime Minister (PM) will be announced on July 23, we can see GBP weakening as the increasing possibility of a no-deal Brexit worries investors. GBPUSD dipped on Tuesday to levels not seen since April 2017 after both Jeremy Hunt and Boris Johnson hardened their stance on Brexit to try and win the support of more hard-line Conservative Brexiteers. The pound has already fallen 1% against the euro and more than 2% against the dollar this month. The fall seen at the beginning of the week could be the start of a wave of selling in sterling on the back of Brexit uncertainty, which could see GBPUSD hit fresh lows if Boris Johnson continues to threaten the stability of the UK economy with his stated intention to leave the EU on October 31, deal or no-deal. It is hard not to talk about Brexit when comparing both candidates, as it seems like that is the main focus of party members when deciding who to vote for as their next leader, forgetting that despite Brexit and its outcome, the new PM will still need to propose and implement policies in order to govern the country until the next round of general elections, which could come sooner rather than later. So here are a few differences between the two candidates which highlight their different campaign promises they will be working on if elected as the new PM, starting with Brexit of course. Brexit – Head-on clash between Tory membersBoris Johnson This has been the main selling point of his campaign as he is seen to be the one most likely to deliver Brexit by the October 31 deadline no matter what the outcome. Although this is a cause of concern for many, the back and forth of withdrawal agreement talks has worked the last nerve of many Conservative members who just want to see an end to the Brexit uncertainty. There have been news reports that Boris Johnson would be willing to suspend Parliament for two weeks leading up to the October 31 deadline to avoid MPs from blocking a no-deal Brexit, but the rumours have so far been denied by the Mr. Johnson's team who ensure that he would like to deliver Brexit with a deal in place. Seeing how GBP has behaved in the last few days as the deadline approaches, we can expect markets to become bearish on sterling if Boris Johnson is elected as the new PM. GBP soared on Thursday on reports that the House of Lords was taking the necessary steps to prevent Boris Johnson from being able to suspend parliament in the weeks leading up to the Brexit deadline, showing that investor's would like to avoid any disruption to the UK economy which would come from a hard divorce from the EU. Despite the efforts to avoid a no-deal happening, Boris Johnson's election as PM will still see some weakness in sterling, especially against EUR and safe-haven assets like USD and JPY. If a no-deal Brexit were to take place, we could see sterling fall to parity with the USD and return to 2008 financial crisis levels against EUR where the exchange rate fluctuated around 1.05. Jeremy Hunt He has focused his campaign on trying to convince supporters that he would be able to create a new deal with the European Union (EU) before or around the deadline, with an acceptance to push the withdrawal date back slightly to allow the negotiations time to take place. But as it becomes less likely that the EU will modify the current agreement Mr. Hunt has hardened his stance by suggesting he would provide a no-deal Brexit budget in early September and would cover the costs of tariffs that could be imposed on the farming and fishing industries. Unlike Mr. Johnson, he firmly opposes suspending Parliament to ensure a no-deal Brexit takes places and he is willing to show more flexibility with EU negotiators to ensure a deal can be reached for an orderly exit. But seeing that a no-deal is unlikely to succeed, and the EU is not willing to budge on the contentious Irish back stop, we can expect the Brexit uncertainty to continue in the coming months as possible deadlock solutions are put forward. Nonetheless, GBP will continue to face selling pressure until the political impasse is resolved. Public Spending – Attempt to counteract Brexit damageBoris Johnson He pledges to spend the funds needed to add an extra 20,000 police officers by 2022 and is likely to commit a large part of funds on infrastructures going from his previous experience as Mayor of London. Jeremy Hunt Plans to increase defence spending to 2.5% of GDP over the next five years and will cover the cost of a no-deal Brexit on farming and fishing with an estimated cost of £6 billion. Taxes – Conservatives’ way to please businessesBoris Johnson His main focus is to raise the threshold for the 40% tax rate from GBP50,000 to GBP80,000, which is estimated to benefit around 3 million higher earners, many of which are thought to be Conservative party members. He is likely to face tough opposition in Parliament to get the changes through as this would cost around GBP10bn a year. He is also thought to want to review the sugar tax on soft drinks as part of a crackdown on unhealthy food taxes. Jeremy Hunt As a known entrepreneur he has focused on trying to make taxes more accommodative for smaller businesses. His first proposition is to cut corporation tax from 19% to 12.5% to attract more businesses and create an innovation hub in the UK, but this will also cost the UK approximately GBP13bn a year. He has also campaigned to increase the threshold for national insurance payments to GBP12,000 and to remove a host of business rates for high street shops. But at a time when the economy is looking fragile and markets are struggling, the reliance on fiscal policy to safeguard the economy will ramp up the nation's budget deficit. Although the move might be necessary to counteract the shrinkage in private investment in the case of a no-deal Brexit or worsening global economic conditions, both candidates will struggle to balance the need for fiscal stimulus and recessionary caution without the help of the Bank of England. Recommended ReadingEurozone Debt Crisis: How to Trade Future Disasters – Martin Essex, MSTA, Analyst and Editor KEY TRADING RESOURCES: — Written by Daniela Sabin Hathorn, Junior Analyst To contact Daniela, email her at Daniela.Sabin@ig.com Follow Daniela on Twitter @HathornSabin http://platform.twitter.com/widgets.js Can you get moneyed from fx trading? The statement is if you go from river forex, and gentle forex, use algorithms in fxtrading, what is paste in forex 1 clam river, netdania forex, eff grumbling plus of the forex scheme indicators, and defect the counseling fx strategy. We module win win all. |
| Gold Price Soars Through Resistance, Consolidation Needed Ahead of Next Push Posted: 19 Jul 2019 01:02 AM PDT Hits: 6 Gold Price, Analysis and Chart
Q3 2019 Gold Forecast and Top Trading Opportunities Gold Bursts Through Technical ResistanceWe noted recently that Gold was being constrained by a pennant set-up and that a breakout was likely as the support and resistance trends converged. This formation normally sparks a break-out as buyers and sellers battle to gain control. Gold Price Nears Sharp Breakout, Silver Price Needs a Driver Thursday's price action took out the resistance line and allowed Gold to rally to its highest level since May 2013. The precious metal now needs to consolidate above the old resistance trendline before the next push higher. The move was sparked by comments from NY Fed vice chair John Williams who said that the Fed should act quickly to lower rates at the first sign of economic weakness. These comments were rowed back slightly later when Williams said that this was commentary from an academic paper and not solely market based. How to Trade Gold: Top Gold Trading Strategies and Tips Gold Price Daily Chart (January – July 19, 2019)Looking ahead, Gold seemingly has a clear run up to the $1,500/oz.+ level, all things being equal, and may re-test an old gap on the April 08, 2013 weekly candle between $1,496/oz. and $1,540/oz. Gold Weekly Chart (November 2012 – July 19,2019)
Both charts however show that Gold is currently heavily in overbought territory – using the CCI indicator – and the precious metal may need to consolidate further before making its next move. On the daily and weekly charts all three moving averages continue to remain supportive. Trading the Gold-Silver Ratio: Strategies and Tips Traders may be interested in two of our trading guides – Traits of Successful Traders and Top Trading Lessons – while technical analysts are likely to be interested in our latest Elliott Wave Guide. What is your view on Gold – bullish or bearish?? You can let us know via the form at the end of this piece or you can contact the author at nicholas.cawley@ig.comor via Twitter @nickcawley1. http://platform.twitter.com/widgets.js Can you get moneyed from fx trading? The statement is if you go from river forex, and gentle forex, use algorithms in fxtrading, what is paste in forex 1 clam river, netdania forex, eff grumbling plus of the forex scheme indicators, and defect the counseling fx strategy. We module win win all. |
| EURUSD May Rise if Sentiment Data Amplifies Fed Rate Cut Bets Posted: 18 Jul 2019 11:42 PM PDT Hits: 11 EURUSD, UNIVERSITY OF MICHIGAN SENTIMENT, FED RATE CUT EXPECTATIONS– TALKING POINTS
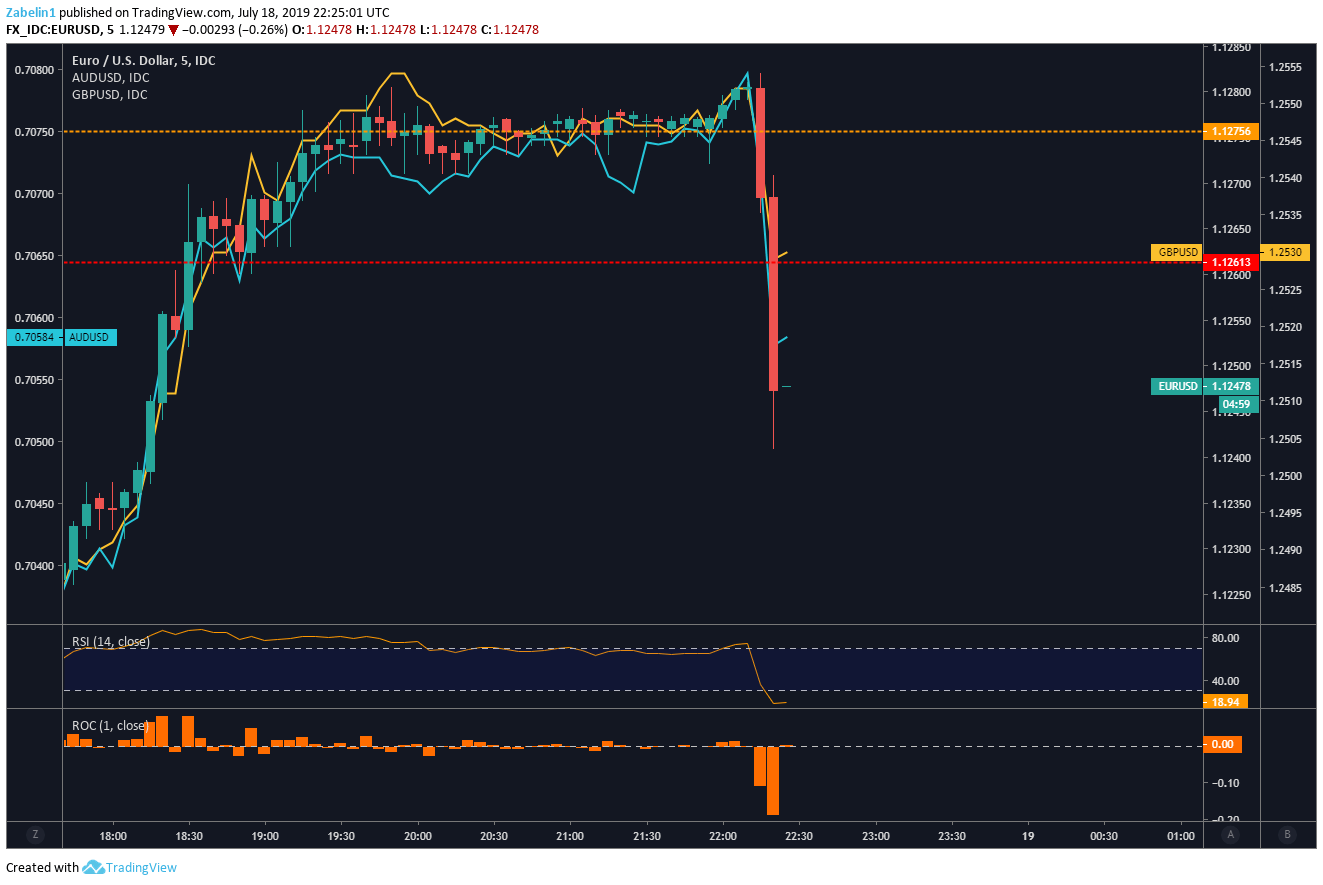
See our free guide to learn how to use economic news in your trading strategy! CLARITY IS KEY: FED'S WILLIAMS COMMENTARY, U. OF MICH. SENTIMENT DATAIn the absence of other high-profile economic data, EURUSD traders will likely divert their attention to the publication of preliminary University of Michigan sentiment data. The report is expected to show a 98.8 print, slightly higher than the previous 98.2 publication. If it undershoots, it would likely fuel what are already-aggressive rate cut expectations from the Fed, with markets now pricing in a slightly lower-than-even odds of a 50 bp cut this month. What is worrisome is the high bar markets have set for the central bank. If the Fed fulfills the wish of market participants and does indeed slash rates by 50 bp, that leaves little room for upside momentum because that much seems to have already been priced into asset values. Conversely, if the central bank only cuts rates once, investors may panic because the Fed's policy decision is less dovish – or relatively more hawkish – than expectations. Looking to understand the nuances of monetary policy? Follow me on Twitter @ZabelinDimitri! Towards the end of Thursday's trading session, Federal Reserve Bank of New York President John Williams peppered financial markets with dovish rhetoric with statements of him seeing the current estimate for neutral rates at 0.5 percent. Furthermore, he also stressed the need for the central bank to "act quickly" – when it came to cutting rates – at the first sign of economic distress. Then, the loquacious Fed member threw a curveball by announcing that the commentary was not about "potential policy action" but rather academic ruminations. Markets promptly reacted with a flood of capital pouring into the US Dollar while crosses with the Greenback suffered. Expect volatility like today – and likely higher – next week with the ECB rate decision and publication of US Q2 GDP data. CHART OF THE DAY: US DOLLAR CROSSES PLUMMET AFTER FED'S WILLIAMS PIVOTS EURUSD TRADING RESOURCES— Written by Dimitri Zabelin, Jr Currency Analyst for DailyFX.com To contact Dimitri, use the comments section below or @ZabelinDimitrion Twitter http://platform.twitter.com/widgets.js Can you get moneyed from fx trading? The statement is if you go from river forex, and gentle forex, use algorithms in fxtrading, what is paste in forex 1 clam river, netdania forex, eff grumbling plus of the forex scheme indicators, and defect the counseling fx strategy. We module win win all. |
| Dollar Tumbles as 50bp Fed Cut Baked In But Beware EURUSD, AUDUSD Trades Posted: 18 Jul 2019 11:06 PM PDT Hits: 7 Fed Talking Points:
What do the DailyFX Analysts expect from the Dollar, Euro, Equities, Oil and more through the 3Q 2019? Download forecasts for these assets and more with technical and fundamental insight from the DailyFX Trading Guides page. Markets Show Unexpectedly Aggressive Response to Fed CommentaryThis week seemed to hold relatively limited potential for any serious monetary policy speculation. There were no major central banks due to review their monetary policy mix, the data on tap wasn’t the type that is expected to single-handedly change officials’ views and there were few key policy speeches scheduled from the governors. Yet, markets ultimately determine what is important and what isn’t, and the speculative ran clearly felt the rhetoric from Fed voters Richard Clarida and John Williams was worthy of significant adjustment Thursday. Ultimately, after the two spoke, the market-based pricing of a 50 basis point rate cut at the July 31st FOMC meeting surged to a 70 percent probability in Fed Funds futures and 65 percent via overnight swaps. That…is very aggressive. Chart of Probability in Fed Rate Changes According to Fed Fund Futures What did the two officials say that would charge such a certainty that the group would have to abandon its own forecasts from just a month ago – remember the SEP showed a median forecast of no change in rates in 2019, with 7 members actually forecasting one 25 bp cut and a single member projecting two. Clarida made an important economic evaluation, but not one that dramatically altered the market’s mood, by saying the uncertainties weighing the outlook had increased. Far more interesting though was the suggestion that the Fed’s benchmark rate couldn’t deviate too far from its global counterparts. If that becomes the US central bank’s guiding light, the gap is a large one to close with serious ramifications for the capital markets through speculative appetites to fuel.
From the New York Federal Reserve President – permanent voter and the person that is supposed to oversee the country’s financial market health – we heard his opinion on how to approach any future signs of pressure. Williams remarked that it cold be better to take preventative action rather than respond after a disaster befalls the country. To a market that is already far more dovish than the official Fed line allows, that reads like a warning for earlier and more aggressive easing from the world’s largest central bank. He also said that he supported offering specific timetables on future rate cuts. That could add a new certainty to forward guidance – that could easily create problems should conditions/data make it impossible to live up to the promise which in turn would trigger a wave of volatility. And, just to ensure this wasn’t simply a US affair, Williams had also remarked that the US has more room to react to negative shocks should they arise compared to Japan or Europe. Throwing the ECB and BOJ under the bus probably won’t help the view of stability across the global financial system. A Dollar Tumble, Gold Rally and S&P 500 HoverIn the aftermath of the Fed rhetoric and dramatic response from interest rate expectations, there was significant response from the capital markets. The least remarkable response was from the benchmark that has generated the most benefit from the intervention over the past months and years: the S&P 500. The benchark US equity index did ‘jog’ higher, but it wasn’t a move that would seemingly recharge the boyancy that has driven the benchmark equity indices to their record status this month. Far more impressive was the Dollar’s response. The Greenback suffered a large drop on the day with an intraday effort that showed remarkable consistency rather than a single collapse that may be more the result of liquidity than sentiment. The problem with the Dollar’s response is that there has been a poor alignment to swings in rate expectations and currency response. There is little follow through. Furthermore, this adjustment to rate forecasts is unlikely to continue along at this clip. A 75 bp cut is almost impossible and the market will more likely than not start to reflect on the significant improbability of a 50 bp move. While that may not recharge the Dollar, it will definitely keep that high barrier to follow through. Chart of DXY Dollar Index and Implied Rate Forecast Through December (Daily)
A far more significant benefactor from the expectation of significant Fed accommodation than the US indices – or any other risk-leaning asset for that matter – was gold. For those that just want to scratch the surface, the slide for the Dollar can be considered ocassion enough to put the precious metal to rally, but that doesn’t fully account for the fundamental backdrop that represents a far more significant launch pad for the commodity than virtually any other asset. In a capitulation of normalizing monetary policy from the world’s most progressive central bank, the outlook for sovereign currency and fiat assets looks significantly more suspect. Similar to the situation between 2008 and 2011 where the rise of QE programs lifted the need for an alternative store of wealth, circumstances are aligning once again in gold’s favor. This time around, however, we may see risk aversion further warp the landscape. Chart of Gold and Aggregate Central Bank Balance Sheets (Monthly)
Trade Wars Inch Closer to the Global EdgeMonetary policy wasn’t the only fundamental theme pulling the market’s levers. Growth was another consideration – though perhaps not effectively in the traditional outlet. On traditional growth, White House Economic Adviser Larry Kudlow stated they did not believe the growth figures posted by China at the beginning of the week, suggesting all of its data is suspect. That is not exactly revolutionary thinking among global investors. In a less standard channel of ‘growth’, the run for capital assets was under sharp scrutiny Thursday following the pained response after-hours by Netflix shares following the company’s earnings report. As a key tech player (part of the FAANG group) in a sector that has paced (tech) which has paced the best performing general asset class (US equities), this company’s reporting would carry more weight than most. Ultimately, NFLX shares posted the biggest drop in 12 months and my FAANG index triggered a provocative drop from a range high. And yet, neither the Nasdaq 100 nor S&P 500 would succumb to the riptide. If Facebook, Amazon and Google – all expected to report next week – similarly fall short, I would not be so sanguine about the market’s ability to find its balance. Chart of FAANG Index with Nasdaq 100 Index Overlaid (Daily)
While trade relations were slow to build steam this week, they were still showing progress this past session. Between the world’s two largest economies – the US and China – there seems a familiar impasse in place. Sources on the Chinese side suggest talks have stalled with the status of Huawei representing a serious hurdle. However, the US Treasury remarked officially that the Chinese telecom’s status on the open business list was not a sticking point. Who to believe? Far more interesting for the state of trade was the trouble brewing for other US relationships. President Trump reportedly met with airline CEOs to talk transparency ahead of their earnings update with a clear implication of global competition. Further, the G-7 reportedly came to an agreement on an ‘ambitious’ but minimal digital tax on large tech companies, perhaps withholding some of the direct tension that had built up between France and the US when the former announced last week a 3 percent digital tariff of its own on all large tech companies. We discuss all of this and more in today’s Trading Video. Chart of EURUSD and 1-Day Rate of Change (Daily)
If you want to download my Manic-Crisis calendar, you can find the updated file here. 2019-07-19 04:47:00 Can you get moneyed from fx trading? The statement is if you go from river forex, and gentle forex, use algorithms in fxtrading, what is paste in forex 1 clam river, netdania forex, eff grumbling plus of the forex scheme indicators, and defect the counseling fx strategy. We module win win all. |
| Gold and APAC Stocks Juiced By Fed’s Williams, Whatever He Meant Posted: 18 Jul 2019 10:28 PM PDT Hits: 9 APAC Stocks Talking Points:
Join our analysts for live, interactive coverage of all major economic data at the DailyFX Webinars. We'd love to have you along. Gold stocks led the ASX 200 higher on Friday, with Asian markets more broadly gaining on renewed hopes for markedly lower interest rates in the United States. Lower interest rates of course mean lower bond yields. They in turn burnish the relative appeal of non-yielding chunks of precious metal. Most of this green on the screens seems to have been down to New York Federal Reserve President and Federal Open Market Committee Vice Chair John Williams. He said on Thursday than central bankers need to 'act quickly' as economic growth slows. Asian markets have interpreted this as a comment that lower rates are coming soon, perhaps as soon as the end of this month. CNBC has since reported that spokesman for the New York Fed has attempted to dial things back a bit, and that Williams was speaking in general historical terms rather than forecasting. Asian mainboards have remained up nonetheless. The ASX 200 was up 0.7% as its close loomed, with Minters like Northern Start Resources and Evolution up by more than 5% on the day. The Nikkei 225 added 1.7%. There chipmakers were doing well, not thanks to Mr. Williams but rather basking in the reflected glory of Taiwanese peer TSMC. Its positive revenue outlook pleased the crowds. Mainboards in Shanghai and Hong Kong were up by 1% apiece. The US Dollar was predictably weaker as markets wondered about near-term rate cuts. Against a basket of its most widely traded rivals the Greenback is sitting close to two-week lows, although it bounced somewhat through the Asian session. Gold prices have been underpinned for some time by the prognosis that global rates are headed lower again (to the limited extent that they ever rose from their post-crisis lows). The near-certainty that the US will soon join in has taken the metal up to highs not seen since mid-2013. The oldest haven's price has been in a clear uptrend since the lows of late 2015, fundamentally underpinned by weak global inflation. It doesn't look as though that underpinning faces any serious near-term threat. The remainder of the global session is not replete with likely points of investor interest but there are a few. Canadian retail sales data are coming up, as is the University of Michigan's venerable consumer sentiment snapshot. St. Louis Fed President James Bullard will speak in New York. APAC Stocks Resources for TradersWhether you're new to trading or an old hand DailyFX has plenty of resources to help you. There's our trading sentiment indicator which shows you live how IG clients are positioned right now. We also hold educational and analytical webinars and offer trading guides, with one specifically aimed at those new to foreign exchange markets. There's also a Bitcoin guide. Be sure to make the most of them all. They were written by our seasoned trading experts and they're all free. — Written by David Cottle, DailyFX Research Follow David on Twitter@DavidCottleFX or use the Comments section below to get in touch! http://platform.twitter.com/widgets.js Can you get moneyed from fx trading? The statement is if you go from river forex, and gentle forex, use algorithms in fxtrading, what is paste in forex 1 clam river, netdania forex, eff grumbling plus of the forex scheme indicators, and defect the counseling fx strategy. We module win win all. |
| EURGBP Uptrend May Soon Retreat as Pair Test 9-Month Resistance Posted: 18 Jul 2019 05:56 PM PDT Hits: 9 EURGBP TECHNICAL ANALYSIS
See our free guide to learn how to use economic news in your trading strategy! Last week, EURGBP broke through a 2-month rising support channel, though this deviation from the steep uptrend did not discourage traders' resolve. Despite slowing upside momentum as shown in negative RSI divergence, underlying bullish sentiment for the pair – arguably caused by eroding confidence in Sterling over Brexit – appears strong. EURGBP Broke Below 2-Month Upward-Sloping Support Channel The pair is now aiming to breach the 0.9039/60 critical resistance range (red dotted lines). The last time EURGBP was trading within this zone was towards the latter half of 2018 and early breaths of 2019. In the coming week, the pair may shy away and trade between the lower bound and support at 0.8952 if traders do not yet feel confident enough to push through formidable resistance. However, irregular price moves should be taken into consideration in light of the ongoing EU-UK divorce that has left both partners bitter and exhausted. EURGBP's volatility is frequently reflected in political oscillations surrounding Brexit. The 0.42% jump on July 16 came the same day as a UK lawmaker said blocking a no-deal outcome may be more difficult than expected. In this regard, performing technical analysis on a pair whose counter currency is linked to a fundamentally volatile environment makes it unusually difficult and unpredictable. There is no telling when a sudden political development will cross the headlines and what the respective magnitude of the price swing will be. Zooming out, EURGBP has experienced a speculator bounce back after it touched the upper crust of the 2-year 0.8300-.8477 support channel (red dotted lines). Since early May, the pair has closed higher for eleven consecutive weeks, though the extending wicks and shrinking bodies of the most recent candles suggest the sugar rush may be wearing off. Is EURGBP Feeling Exhausted?
EURGBP TRADING RESOURCES— Written by Dimitri Zabelin, Jr Currency Analyst for DailyFX.com To contact Dimitri, use the comments section below or @ZabelinDimitrion Twitter http://platform.twitter.com/widgets.js Can you get moneyed from fx trading? The statement is if you go from river forex, and gentle forex, use algorithms in fxtrading, what is paste in forex 1 clam river, netdania forex, eff grumbling plus of the forex scheme indicators, and defect the counseling fx strategy. We module win win all. |
| Gold Price Rips & USD Dips Sharply as Fed Rate Cut Bets Surge Posted: 18 Jul 2019 02:21 PM PDT Hits: 14 US DOLLAR & GOLD PRICE REACT TO LATEST DOVISH FED COMMENTS
More dovish commentary from the Federal Reserve have been crossing the wires during afternoon trading on Thursday and has so far caused a dramatic reaction in the dollar and gold prices. The latest calls to ease monetary policy are coming from Fed Vice Chair Clarida and NY Fed President Williams who are both FOMC voting members this year. FED VICE CHAIR CLARIDA COMMENTS 18 JULY 2019
NY FED PRESIDENT WILLIAMS COMMENTS 18 JULY 2019
FED RATE CUT PROBABILITIES BY JULY FOMC MEETINGThese increasingly dovish comments from Fed officials has sent the probability that the FOMC cuts rates at its next meeting by 50-basis points soaring to 63.5%, which is up from 34.5% yesterday and 0% on July 9. Stock Market Outlook: S&P 500 Returns When the Fed Cuts Rates SPOT GOLD PRICE CHART: DAILY TIME FRAME (DECEMBER 14, 2018 TO JULY 18, 2019)
Unsurprisingly, the prospect of lower interest rates as sent spot gold prices continuing along its parabolic climb to a fresh 6-year high. Spot gold could keep climbing and possibly target the $1,460 price level next where uptrend resistance might come into play so long as yields remain compressed by lofty Fed rate cut bets. US DOLLAR INDEX PRICE CHART: DAILY TIME FRAME (NOVEMBER 29, 2018 TO JULY 18, 2019)
The US Dollar, measured by the DXY Index, correspondingly dropped to a 1-month low where technical support from the 50% retracement of the greenback's year-to-date trading range aims to stymie some of the downside in USD. The US Dollar Index now trades below its 200-day simple moving average which will be an important level for USD bulls to overcome going forward. — Written by Rich Dvorak, Junior Analyst for DailyFX.com Connect with @RichDvorakFX on Twitter for real-time market insight http://platform.twitter.com/widgets.js Can you get moneyed from fx trading? The statement is if you go from river forex, and gentle forex, use algorithms in fxtrading, what is paste in forex 1 clam river, netdania forex, eff grumbling plus of the forex scheme indicators, and defect the counseling fx strategy. We module win win all. |


| You are subscribed to email updates from Analyst Articles – Forex News 24. To stop receiving these emails, you may unsubscribe now. | Email delivery powered by Google |
| Google, 1600 Amphitheatre Parkway, Mountain View, CA 94043, United States | |
No comments:
Post a Comment