
Forex analysis review |
- The ECB and the Fed are going to cut rates, while the Bank of England is not yet ready for this, and this could support the
- The Fed rate cut is not due to Trump's whim
- EUR/USD: a sluggish flat in anticipation of ZEW reports and US retail sales data
- Is gold going higher and higher and higher?
- GBP/USD. July 15. Results of the day. The UK has its own problems and the scandal with Donald Trump
- EUR/USD. July 15. Results of the day. The effect of the Fed's rate cut might be nothing
- July 15, 2019 : EUR/USD maintains short-term bullish outlook below 1.1275.
- Analysis of BITCOIN for July 15, 2019: BTC to regain momentum after breaking above $10,500
- July 15, 2019 : GBP/USD is establishing a high-probability intraday bearish setup.
- GBP/USD 07.15.2019 - Strong support on the test at 1.2525
- Analysis of gold for July 15, 2019: gold to correct before retracing towards $1,350
- USDJPY challenging important weekly levels after triangle break down.
- EURUSD bounces off support as expected. Now what?
- Gold 07.15.2019 - Rejection of the resistance at $1.419 in the backgorund
- Gold price remains trapped inside the short-term trading range
- BTC 07.15.2019 - Downside pressure and bear flag pattern completed
- Analysis of AUD/USD for July 15, 2019: AUD to sustain bullish pressure over USD
- The US refusal from the policy of a strong dollar can not only weaken the greenback, but also provoke currency wars
- GBP/USD: plan for the American session on July 15. Bears are trying to consolidate below 1.2546 to maintain a downward momentum
- EUR/USD: plan for the American session on July 15. Euro buyers remain on the sidelines, failing to cope with the resistance
- Will pound ruin politics?
- The slowdown in China's GDP growth contributes to lower oil prices
- Can the euro break out of a narrow range against the dollar?
- Technical analysis of USD/CHF for July 15, 2019
- Technical analysis of GBP/USD for July 15, 2019
| Posted: 15 Jul 2019 05:11 PM PDT The single European currency fails to demonstrate a steady upward trend, despite expectations that the US Federal Reserve System (FRS) will cut interest rates for the first time in ten years. Derivatives market expects the US central bank to lower the rate in July and September. This is a negative point for the dollar. Why then the euro can not benefit from this? The fact is that the ECB also does not exclude the possibility of easing monetary policy to stimulate the European economy and inflation in the region. UBS analysts believe that the regulator will lower the deposit rate twice before the end of this year. "Most likely, this will happen in September and December, and each time the step size will be 10 basis points. In addition, the ECB may resort to QE, if the outlook for the economy and inflation in the eurozone worsens, downside risks associated with trade policy and geopolitical uncertainty materialize, or the Fed has a weaker monetary policy than expected. We think that at the meeting next week, the ECB will make adjustments to its statements of intent to prepare the markets for the coming changes," they noted. Thus, it turns into a "vicious circle": both the American and European central banks want to cut rates and lower the rate of their currency. Who will lose: euro or dollar? It is possible that this week will be a draw and the next winner will be the greenback. Meanwhile, the Bank of England, it seems, is not yet ready to lower interest rates. Moreover, some members of the BoE Monetary Policy Committee are considering the possibility of raising rates in the fall, if after Brexit there is a high increase in consumer prices. According to a number of analysts, since the ECB and the Fed are setting investors to lower rates, the pound can show good growth in quotes. "The pound is already trading at crisis levels and will resist further decline. High inflation expectations and inflation, which is close to the Bank of England target, should for the time being keep the central bank from deciding to soften the policy," say Nomura analysts. "Great Britain's exit from the EU without a deal is a risk, and it will certainly lead to the formation of new lows in sterling, but this will happen only in a few months, and we don't expect the market to lay a high premium for a hard Brexit until Parliament returns to work in September after the summer break," they added. The material has been provided by InstaForex Company - www.instaforex.com |
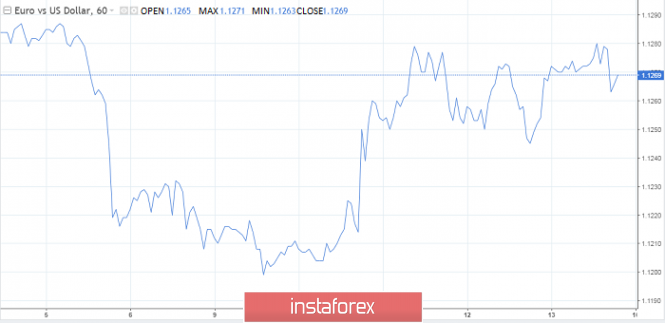
| The Fed rate cut is not due to Trump's whim Posted: 15 Jul 2019 04:54 PM PDT The president of the United States accuses China and the European Union with currency manipulations. At the same time, the euro and the yuan are more likely to be victims of trade conflicts than instruments. China's GDP growth in the second quarter was confirmed, as predicted. This is the lowest value for the last 27 years. The fiscal stimulus of $291 billion is clearly not enough for the economy to develop as the Chinese authorities plan. Disagreements with the US has hurt the country's foreign trade. As a result, shipments of Chinese products to the US fell by 7.8% in June, while imports fell by 31% in annual terms. The surplus, as a result, expanded to a 7-month high. The development of events clearly does not correspond to the previously written scenario in Washington. The Fed will cut rates this month, including due to the risks of a slowdown in the country's economy. The head of the regulator made it clear that this would be a purely preventive measure. The yield curve, which predicted all recessions over the past 50 years, was at -1.6 bp on Friday, July 12, while it was at -19 bp a week earlier. This is the most dramatic indicator jump during the reign of Donald Trump. Financial markets are sensitive to a change in the position of the Fed, but it is not yet clear how much the regulator is ready to ease policy. There are suggestions that the criticism of the White House's host is only a background, and the central bank is actually led by investors. Most of the surveyed economists believe that the negative and pressure towards the Fed does not affect the central bank's outlook. It's independence is a bit undermined and that's all. During Powell's speech to Congress, lawmakers urged him not to take into account the recommendations and threats from the White House, promising protection if necessary. The fear is not Donald Trump, but financial markets. At the end of last year, it was they who signaled the need for a pause in the process of normalizing monetary policy. At the beginning of this year, the Fed leadership announced the beginning of a period implying patience. Then investors began to unwind the topic of rate cuts, and Powell seems to meet their expectations. Now the market is asking for three rounds of policy easing. The question is, will it come to life? Authoritative forecaster Bloomberg - Eurobank Cyprus - believes that the dollar index will be stable until the end of the summer. At the same time, expectations of lowering the rate in September and later will allow "euro bulls" to reach $1.17 by the end of the year. While his forecast comes true at 100%. The EUR/USD quotes are firmly stuck in the trading range of $1.12–1.14. The euro cannot benefit from a negative policy easing for the dollar. The fact is that the ECB meeting will be held next week on July 25, where the regulator may also announce the need to reduce rates. The pressure is on both currencies at the same time, so in the long run a combat draw. However, some strategists expect the main pair to grow to the level of $1.14 this week. To do this, it will need to overcome the high at $ 1.1285. The material has been provided by InstaForex Company - www.instaforex.com |
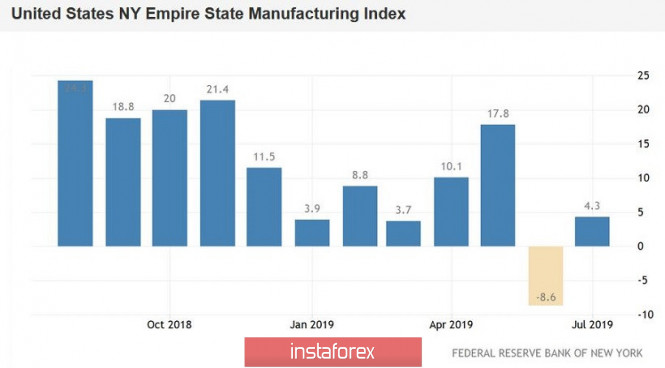
| EUR/USD: a sluggish flat in anticipation of ZEW reports and US retail sales data Posted: 15 Jul 2019 04:30 PM PDT At the beginning of the trading week, the euro-dollar pair continued a correctional growth after the release of fairly good data from China. However, during the day, EUR/USD bulls could not strengthen the upward impulse, as a result of which bears have then intercepted the initiative on the pair. This has contributed to the disappointing rhetoric of European officials against the background of strong data from the United States. Trump's threats to devalue the US currency have so far been sidelined, since all the information on this matter is in the nature of unverified rumors. In addition, according to some analysts, the US president will not be in a hurry with actions until the July Fed meeting, at which the regulator is likely to lower the interest rate. Therefore, traders of the EUR/USD pair live today - and the overall results of Monday are clearly not in favor of the single currency. Thus, according to the German Minister of Economy Peter Altmeier, the key economic indicators suggest that in the second quarter of this year, the growth of the country's GDP will slow down significantly. This is indicated by the low growth of the service sector, as well as a slowdown in industrial activity. External demand is declining, and with a high degree of probability this trend will only gain momentum at the expense of a hard Brexit and the ongoing trade war between the US and China. As is known, Germany is the "locomotive" of the European economy; therefore, such forecasts increase the likelihood of monetary policy easing by the European Central Bank. Here it is worth recalling that representatives of the ECB more and more often warn the market about such intentions. In particular, ECB member Benoit Coeure, who four years ago was one of the initiators of the launch of the stimulating program, said last week that the regulator could resume QE in the near future, if the situation in the eurozone economy demands it. A similar position was voiced by ECB chief economist Philip Lane, whom the press already calls not only the central bank's chief economist but also the "chief adviser" to Mario Draghi's successor Christina Lagarde. According to many analysts, Lagarde will be guided precisely by his recommendations (at least for the first time), so the likelihood of mitigation of monetary policy conditions is growing due to this factor. Lane once again reiterated that the European regulator needs to pursue an accommodative policy in order to return inflation indicators to the targets, and the ECB "has enough tools" for this. In the light of such rhetoric, currency strategists of the main European banks warn that the ECB can not only renew QE in the fall, but also lower the interest rate. In particular, according to analysts of the largest French bank Societe Generale, the regulator in September will cut the deposit rate by 10 basis points and announce the beginning of a stimulating program that will provide for a monthly purchase of assets in the amount of 40 billion euros. At the July meeting, according to analysts, the regulator widely announces easing of monetary policy. Therefore, the main reaction of the market regarding these steps will be in July, not in September. However, the euro is already acting out such intentions of the ECB, being under background pressure. The only question is how aggressive the regulator's steps to mitigate monetary policy will be. Almost no one doubts that the ECB will follow this path. That is why the potential for corrective growth of the EUR/USD pair was initially limited. Bulls could not take advantage of the temporary weakness of the dollar (which was due to rumors about Trump's intentions to devalue the currency through interventions) and go to the 13th figure. The pair touched the first resistance level of 1.1290 (the average line of the Bollinger Bands indicator on the daily chart) and headed towards the middle of the 12th figure. The formal reason for the downward pullback was published by the Federal Reserve Bank of New York's Empire State Manufacturing Index. In June, the indicator fell to a negative area (for the first time in 3.5 years), which alarmed dollar bulls. But today the index showed a positive trend, although it remained at relatively low values (4.3 points). The dollar reacted positively to this release, despite the fact that the employment component has remained at the lowest values since the fall of 2016. Thus, the dovish intentions of the ECB exert background pressure on the euro, and this fact is a difficult "anchor" for the EUR/USD pair. The weight of this burden may intensify tomorrow, if the sentiment index in the business environment from the ZEW Institute (in Germany and in the whole of the eurozone) goes even deeper into the negative area. Given the high likelihood of a hard Brexit, the pessimism of the European business sphere will most likely grow and exponentially, will place additional pressure on the euro. In turn, the dollar will focus on retail sales tomorrow. This indicator may show negative dynamics, especially without car sales. In other words, if political factors do not mix the cards of the fundamental picture, then weak US data will partially compensate for weak European indicators, especially in the light of the dovish intentions of both the ECB and the Fed. All this will lead to the fact that the pair will fluctuate in the price range with an upper ceiling of 1.1300 (Kijun-sen line on D1) and a lower limit of 1.1225 (the upper and lower boundaries of the Kumo cloud on the daily chart coincide at this price point). If the bears push the lower limit, the next support level will be the mark of 1.1160 - this is the bottom line of the Bollinger Bands indicator on the same timeframe. The material has been provided by InstaForex Company - www.instaforex.com |
| Is gold going higher and higher and higher? Posted: 15 Jul 2019 04:08 PM PDT After many years of waiting, the hopes of investors who invest in gold were finally rewarded, as gold showed an impressive trend in the first half of 2019, which was caused by several reasons. Is it worth it to invest money in gold now and is it time to take profits to those who bought gold from the levels of $1,300, we will analyze in this article. If we consider gold from the point of view of distant investment horizons, then investors should have no questions at all. Regardless of the behavior of gold in the derivatives market, it should be in the portfolio of each investor in a volume of up to 20% or more if the portfolio is denominated in reserve currencies. Even if gold falls short in price in the short term, it should be taken as the foundation of a house: you don't want to bury money in the ground, but you have to, because you need to build a house on stone and not on sand. Moreover, in the long run, gold is the most profitable asset in any currency. Since 2001, gold has increased by five times in price against the dollar. The price of gold was $287 per troy ounce on September 11, 2001 but now gold is worth $1,415. Over the same period, investments in S&P 500 stocks, inflated from free money in the last ten years, have brought a yield of "just" 2.8 times the return - it was 1,050, it was 3,000. No one argues, 285% is good, but you have to agree that 500% is better, and if you take 2008-2009, then there were no questions at all as to where money should be invested - in gold or shares. It seems to me that the best investment in order to save money for retirement or the education of children will be an investment in gold coins. Yes, there are periods of recession, but long-term gold is a very stable and profitable asset. Over a period of 20 years, gold gives an annual increase of 8% on invested capital. Of course, it's easy to talk about a distance of two decades, it's more difficult to figure out shorter periods, but we'll try. If we talk about the current time, then, according to the World Gold Council, now the following factors influence the situation:
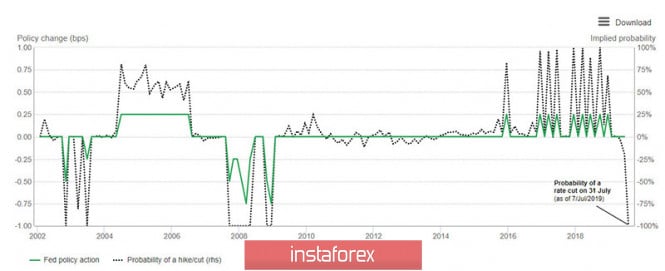
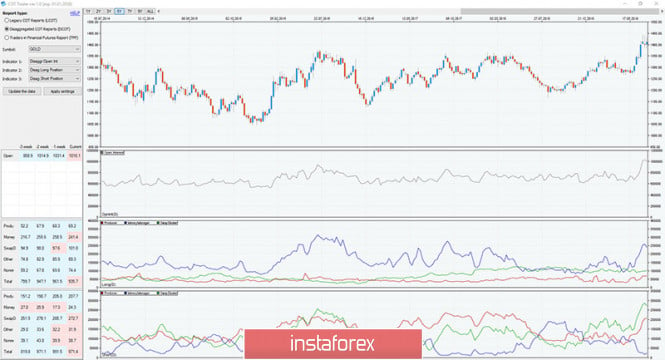
Regarding monetary policy easing, Federal Reserve Chairman Jerome Powell and the Open Market Committee now occupy a balanced policy and would rather prefer not to lower the rate at the next meeting, which will be held in late June. However, markets literally force the Fed to do this, suggesting a 100 percent likelihood of such a move. As the analysis conducted by the World Gold Council shows, the US Federal Open Market Committee conducted a rate change whenever more than 65% of traders expected such a move from it (Fig. 1). Figure 1: Changes in the Fed's monetary policy in line with market expectations. Source: World Gold Council Despite good inflation data (core inflation rose to 2.1% in June) and excellent unemployment data, the Fed is unlikely to decide to go against the will of the markets and leave the rate unchanged. In turn, the rate reduction is negative for the US dollar, which will lose 0.25% of potential, which is very likely to lead to a decrease in the dollar against a basket of major reserve currencies. At the same time, the US dollar has a 90 percent negative correlation with the US dollar. Earlier, in 2010 - 2015, gold significantly correlated with the yen, but later began to correlate with the euro and the dollar, in turn, the correlation with the yen had decreased. Speaking about the factors that highly affect the price of gold, it is necessary to note the demand of exchange-traded funds - ETF - and the positioning of Money Manager speculators in the futures market. They are the main buyers of gold, and it is the influx of money to the derivatives market that determines the medium and short-term price dynamics. By volume, the COMEX-CME conglomerate is the largest exchange for trading gold and its derivatives, followed by London and Shanghai. From June 1, Open Interest, which characterizes the influx of new money into the market, grew by more than a quarter and for the first time in history exceeded the level of 1 million contracts. However, in July, the process slowed down somewhat and has stabilized at this point. Some traders preferred to take profits, which resulted in a slight decrease in OI to 1.01 million. Speculators, after the explosive growth of May-June, also slightly reduced their long positions, which currently amount to 241 thousand contracts. At the same time, short positions of speculators remain at the lowest values of 24.3 thousand contracts (Fig. 2), which does not indicate their desire to sell gold against its trend. Therefore, wishing to open a short position in gold should not be smarter than the market. Traders need to be with the market, and if you call yourself a speculator, then you must act together with the Money Manager, and not against them. Fig.2: Position of traders in the COT report. Source Commodity Futures Commission - CFTC Based on the above factors, as well as technical analysis, it can be assumed that the range of 1380-1435, formed by the price of gold in the previous three weeks, is more likely a continuation figure than a reversal figure. In this case, in the event of growth, gold has every change to reach the level of $1500 and continue further upward movement. However, if the Fed does not lower the rate, which is now highly unlikely, or Jerome Powell's comments on future monetary policy prospects will lead to an increase in the US dollar, there is some small chance that gold could fall to $1,375-$1,350. In this case, traders should remember that "Murphy's Law" says that if trouble can happen, it will happen, it will be realized on the markets with an enviable constancy. In this regard, no need to make exceptions to the rules of money management and open positions that you can not afford to lose. The material has been provided by InstaForex Company - www.instaforex.com |
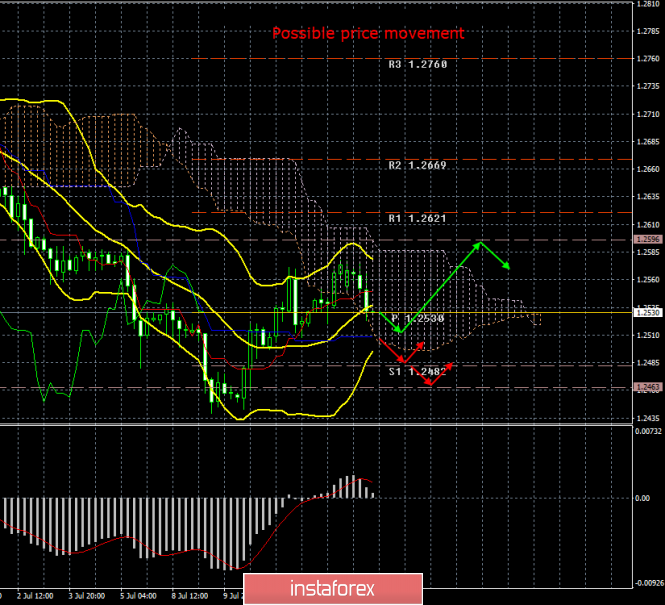
| GBP/USD. July 15. Results of the day. The UK has its own problems and the scandal with Donald Trump Posted: 15 Jul 2019 03:58 PM PDT 4-hour timeframe The amplitude of the last 5 days (high-low): 40p - 81p - 77p - 74p - 60p. Average amplitude for the last 5 days: 66p (76p). If the euro currency, in principle, stands in one place today, then the British pound sterling has once again started to fall against the US dollar. As in the case of the euro/dollar pair, the bulls have not only failed in overcoming the Ichimoku cloud, but even to work out its upper limit. Thus, a downward correction has now begun against the weakest upward trend, which itself is a correction against a downward trend. We still believe that there are no particular prospects for the pound sterling now. Not only has the British prime minister not been elected yet, Brexit is in one place, there is no longer any hope for an orderly exit from the EU, and the country is threatened with new Parliamentary elections, and British politicians also manage to get into scandals. And not just a scandal, but a scandal involving Donald Trump, who, for no particular reason, can just for a whim, for example, get out of a nuclear "deal" with Iran. As evidenced by the secret correspondence of the British diplomat in Washington, which became public. It is now difficult to predict as to what awaits the UK in trade and diplomatic relations with the United States. From a technical point of view, the pound/dollar pair has almost dropped to the critical line. Overcoming it will bring bears back into the game, and the downward trend will resume. Trading recommendations: The pound/dollar currency pair began a downward correction. Thus, traders are advised to wait until it is completed (rebound from the critical line) and it will be possible to buy the sterling with minimal lots with targets at 1.2596 and 1.2621. You can sell the British currency after the pair has been re-consolidated below the Kijun-Sen line, which will lead to a change in the trend to a downward one. Targets are levels of 1.2482 and 1.2463. In addition to the technical picture should also take into account the fundamental data and the time of their release. Explanation of the illustration: Ichimoku indicator: Tenkan-sen - the red line. Kijun-sen - the blue line. Senkou Span A - light brown dotted line. Senkou Span B - light purple dotted line. Chikou Span - green line. Bollinger Bands indicator: 3 yellow lines. MACD Indicator: Red line and histogram with white bars in the indicator window. The material has been provided by InstaForex Company - www.instaforex.com |
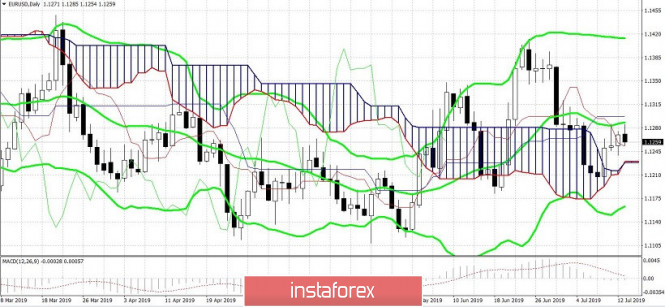
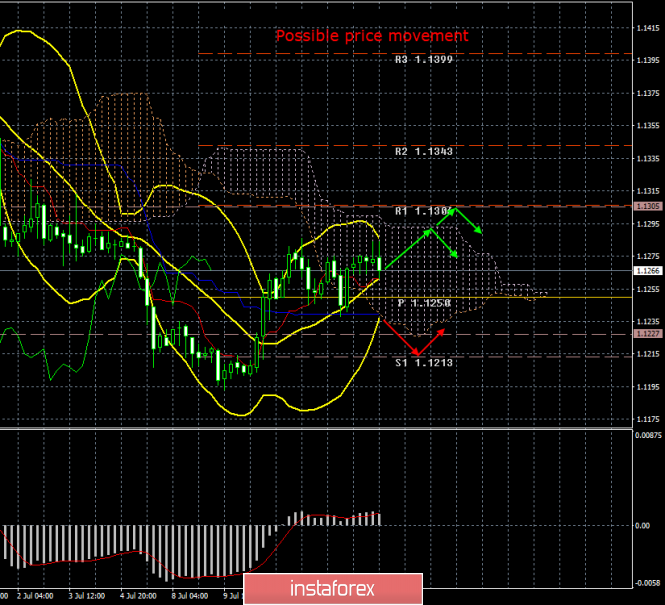
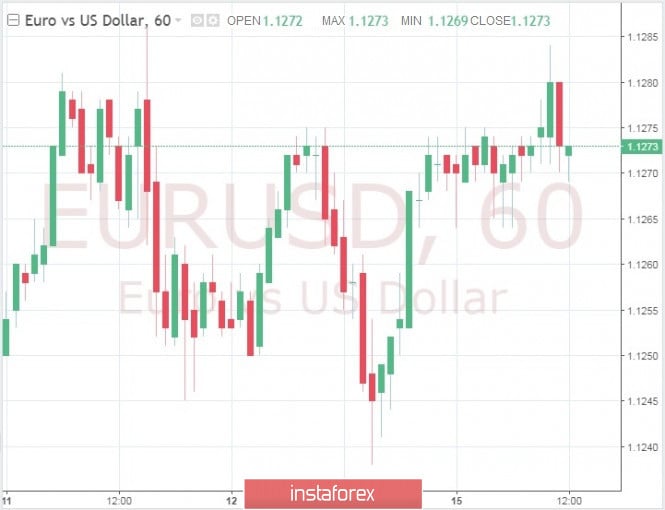
| EUR/USD. July 15. Results of the day. The effect of the Fed's rate cut might be nothing Posted: 15 Jul 2019 03:46 PM PDT 4-hour timeframe The amplitude of the last 5 days (high-low): 28p - 26p - 62p - 41p - 37p. Average amplitude for the last 5 days: 39p (48p). As we expected in the morning, the first trading day of the week was boring and uninteresting, since no important macroeconomic events have been scheduled to be released. Tomorrow, Fed Chairman Jerome Powell will hold another speech and several important reports will be published in the United States. Today, volatility continues to decline, as well as its average for 5 days, despite the fact that the past week was filled with various important events. As we all see, despite the fact that the issue of a Fed rate cut has almost been resolved, traders are in no hurry to get rid of the US dollar. We warned that this could happen, because, despite the Fed's willingness to lower the key rate, it will still remain higher than that of the European Union. Especially since the ECB meeting will take place first, on July 25, and the key rate may also be lowered at it. Thus, in Europe it may become negative, and the US currency may rise in price even more. Moreover, they can revive the quantitative easing program in the European Union, since they believe that the economy needs support again. What do we have in the bottom line? Only the fact that even if the Fed lowers the rate on July 30-31, this will not have a very strong effect on the balance of power between the euro and the dollar. Accordingly, we can count on the resumption of a downward trend. At the moment, bulls can not even overcome the Ichimoku cloud. Once again, traders see no reason to buy the European currency. Trading recommendations: The EUR/USD pair continues to be adjusted, breaking the Kijun-Sen line. Thus, purchases with a target of 1.1306 are formally relevant, but the MACD indicator may turn down on the current candlestick. It is recommended to sell the euro/dollar again not earlier than when the price has been consolidated below the critical line with targets at 1,1227 and 1.1213. In this case, the initiative will return to the hands of bears. In addition to the technical picture should also take into account the fundamental data and the time of their release. Explanation of the illustration: Ichimoku indicator: Tenkan-sen - the red line. Kijun-sen - the blue line. Senkou Span A - light brown dotted line. Senkou Span B - light purple dotted line. Chikou Span - green line. Bollinger Bands indicator: 3 yellow lines. MACD Indicator: Red line and histogram with white bars in the indicator window. The material has been provided by InstaForex Company - www.instaforex.com |
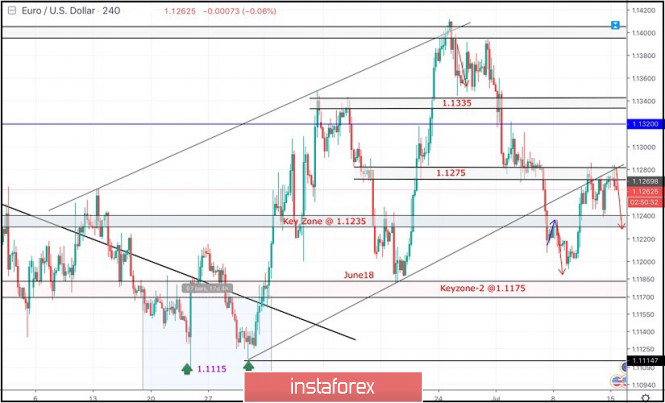
| July 15, 2019 : EUR/USD maintains short-term bullish outlook below 1.1275. Posted: 15 Jul 2019 08:36 AM PDT
Initially, Temporary Bullish breakout above 1.1335 was demonstrated (suggesting a high probability bullish continuation pattern). However, the EURUSD pair has failed to maintain that bullish persistence above 1.1320 and 1.1275 (the depicted price levels/zones). This was followed by a deeper bearish pullback towards 1.1175 where significant bullish price action was demonstrated on June 18. The EURUSD looked overbought around 1.1400 facing a confluence of supply levels. Thus, a bearish pullback was initiated towards 1.1275 as expected in a previous article. Further Bearish decline below 1.1275 enhanced a deeper bearish decline towards 1.1235 (the lower limit of the newly-established bullish channel) which failed to provide enough bullish support for the EUR/USD. The recent bearish breakdown below 1.1235 invited further bearish momentum to move towards 1.1175. However, significant bullish momentum was earlier demonstrated around 1.1200 bringing the EUR/USD pair again above 1.1235. That's why, the recent bullish pullback was expected to pursue towards the price zone around 1.1275 where a confluence of resistance/supply levels came to meet the pair. A recent double-top Bearish pattern Is being demonstrated around the price zone of 1.1275 where a valid Intraday SELL position was suggested in previous articles. Bearish persistence below the pattern neckline around (1.1235) is mandatory to confirm the short-term trend reversal into bearish towards 1.1175. Otherwise, the EUR/USD pair remains trapped between the depicted price-zones (1.1235-1.1275) until breakout occurs in either directions (More probably to the downside). Trade recommendations : For Intraday traders, a high-probability SELL Trade can be considered anywhere near the depicted KEY-ZONE around 1.1275. Initial Target levels to be located around 1.1235, 1.1200 and 1.1175. Stop Loss should be placed above 1.1300. The material has been provided by InstaForex Company - www.instaforex.com |
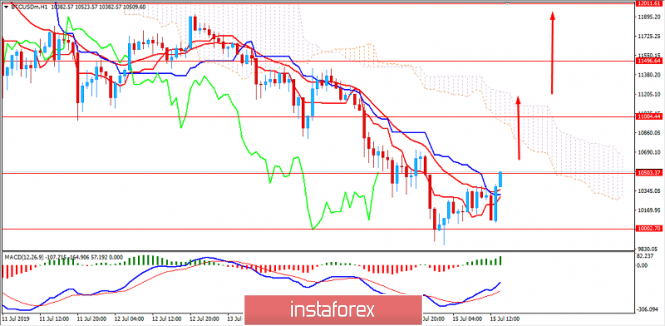
| Analysis of BITCOIN for July 15, 2019: BTC to regain momentum after breaking above $10,500 Posted: 15 Jul 2019 08:02 AM PDT Bitcoin has been on a roller coaster recently. The price has been ranging between $10,000 to $14,000. BTC is currently residing at near $10,500 while forming bullish momentum along the way. While the outlook is currently negative, there are signs that Bitcoin will recover into the end of 2019. There are predictions that Bitcoin may surge 250% from the current price level which would push the price towards $40,000. The last quarter of 2019 is expected to be quite bullish for Bitcoin based on analytical reviews so that the price may surpass the bullish run of 2017. Amid expectations of a rate cut by the Federal Reserve this month, Bitcoin could regain momentum and climb higher. Any impulsive bullish pressure above $14,000 would lead the price towards $20,000 in no time. Though the US central bank has been quite indecisive with the rate cut recently, the current economic conditions, the US government involvement, and low consumer inflation could assure the Fed to raise interest rates at the policy meeting in July. Meanwhile, safe-haven investment is viewed as gold and bitcoin. BTC which is widely expected to surge higher in the coming days. TECHNICAL OVERVIEW: The price recently bounced off the $10,000 area again after an impulsive non-volatile bearish trend in place. The price managed to regain bullish pressure but until $10,500 is taken out with strong bullish pressure, the upcoming upward pressure is still unreliable. The price has managed to break above the dynamic level resistances and Chikou span is on its way to break above the price line which will take into form after the price successfully breaks above $10,500 area in the coming hours. As the price progresses higher, Kumo Cloud is expected to act as dynamic resistance. On the other hand, breaking above it will reinforce the bullish pressure which could lead the price towards $14,000 again in the coming days. TECHNICAL LEVELS: SUPPORT: 9,500, 10,000 RESISTANCE: 10,500, 11,000, 11,500, 12,000 CURRENT BIAS: BEARISH MOMENTUM: VOLATILE
|
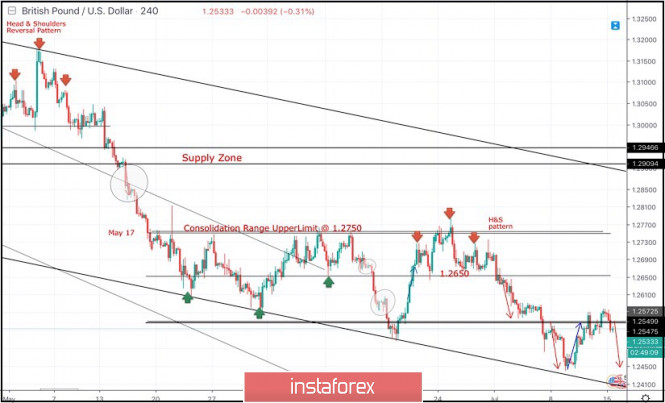
| July 15, 2019 : GBP/USD is establishing a high-probability intraday bearish setup. Posted: 15 Jul 2019 07:25 AM PDT
Since May 17, the previous downside movement within the depicted bearish channel came to a pause allowing the recent sideway consolidation range to be established between 1.2750 - 1.2550 with a prominent key-level around 1.2650. In June , temporary bullish consolidation patterns were demonstrated above 1.2650 for a few trading sessions. However, the price level of 1.2750 (consolidation range upper limit) has prevented further bullish advancement few times so far. Moreover, signs of bearish rejection have been manifested (Head & Shoulders reversal pattern with neckline located around 1.2650). Bearish breakdown below 1.2650 (reversal pattern neckline) confirmed the reversal pattern with bearish projection target located at 1.2550, 1.2510 and 1.2450. Intermediate-term technical outlook remains under bearish pressure as long as the market keeps moving below 1.2650 (mid-range key-level and neckline of the reversal pattern). Moreover, the recent Bearish breakdown below 1.2570 - 1.2550 (the lower limit of the depicted consolidation range) confirms a trend reversal into bearish on the short-term. Quick bearish decline was expected to pursue towards 1.2450 (the lower limit of the current movement channel) where early signs of bullish rejection were manifested. The current bullish pullback towards 1.2550-1.2570 should be considered as a valid SELL signal for Intraday traders. On the other hand, An Intraday bullish position can ONLY be considered if the current bullish rejection manages to bring the GBP/USD steadily above the price level of 1.2550. If so, Intraday bullish target would be projected towards 1.2650. Trade Recommendations: Conservative traders can have a valid SELL Entry anywhere around the current price levels (1.2550-1.2570). T/P levels to be located around 1.2490 and 1.2440. S/L should be placed above 1.2610. The material has been provided by InstaForex Company - www.instaforex.com |
| GBP/USD 07.15.2019 - Strong support on the test at 1.2525 Posted: 15 Jul 2019 07:12 AM PDT The Gold didn't have enough power to break the resistance at $1.419 and I saw the good rejection there, which is sign for me that buyers got very exhausted there. Since there is rejection of the resistance in the background, I would watch for selling opportunities. Gold also did back into the 24 balance range, which is another confirmation that upside break was unsustainable.
On the 4H time-frame I found that there is bear cross on the Stochastic and MACD, which represents short-term downtrend. Downward targets are set at the price of $1.400 and at $1.386. As long as the Gold is trading below the key resistance swing $1.426, I would watch for selling opportunities on the rallies. Usually, when we have Asia and Europe session directional movement like today, US session will try to reverse. Today is great example of 2 sessions down and US session is starting to reverse on the upside. The material has been provided by InstaForex Company - www.instaforex.com |
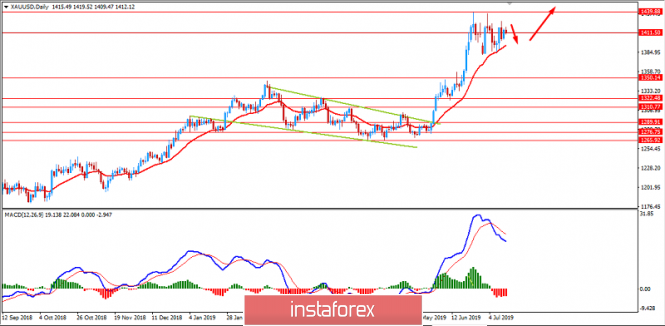
| Analysis of gold for July 15, 2019: gold to correct before retracing towards $1,350 Posted: 15 Jul 2019 07:05 AM PDT Gold has been quite corrective and indecisive at near $1,400 where 20 EMA has been holding the price as dynamic support while the price is correcting itself after the impulsive bullish move. Gold prices headed higher recently as a boost in risk from generally positive economic data was insufficient to derail demand in an environment marked by decreasing yields. Despite the positive reaction to the data in global equities today, US futures pointed to new record highs which helped gold to hold gains as the precious metal continued to benefit from expectations of decreasing rates. As expectations for further policy easing across the globe increase, yields have been dropping on most fixed-income products bonds, even those traditionally seen as high-risk in economic downturns. The Federal Reserve has been under pressure from the US government. Some Fed officials believe that lower interest rates would lead to achieving the inflation goal. Investors are betting that Fed officials will announce a reduction in the benchmark overnight interest rate on July 30-31. Recently, quarterly projections published after the FOMC's June meeting revealed that the committee's median estimate of the neutral interest rate had fallen to 2.5% from 2.75% that indicates strong likelihood of the rate cut. US Retail Sales are expected to decrease to 0.1% from the previous value of 0.5%. Such downbeat retail sales could shift market sentiment in favor of gold as safe-haven investment for the coming days. TECHNICAL OVERVIEW: The price has been trading in a range between $1,400 to $1,440 where the dynamic level of 20 EMA managed to hold the price as support. MACD currently has no Bearish Divergence that indicates further corrections. However, having a bullish crossover in the Moving Average lines indicates that a break below $1,400 will push the price lower to $1,350 before any bullish pressure will resume a climb towards $1,500 in the future.
|
| USDJPY challenging important weekly levels after triangle break down. Posted: 15 Jul 2019 06:58 AM PDT USDJPY has broken out of a triangle pattern with a bearish break down. USDJPY has broken below 108 support area and the lower triangle boundary. Price has now back tested the break down area and got rejected.
Blue lines - triangle pattern USDJPY has broken down and out of the triangle pattern. This is an important bearish sign. Resistance is at the red rectangle and as long as price is below that area, we expect to see a continuation of the downtrend towards 107 and lower. Breaking below 107 and specially below 106.80 would be a very bearish sign that will open the way for a move towards 105 and lower. Bulls want to see price recapture the 108-108.40 level and move back above the lower blue boundary of the triangle pattern. The material has been provided by InstaForex Company - www.instaforex.com |
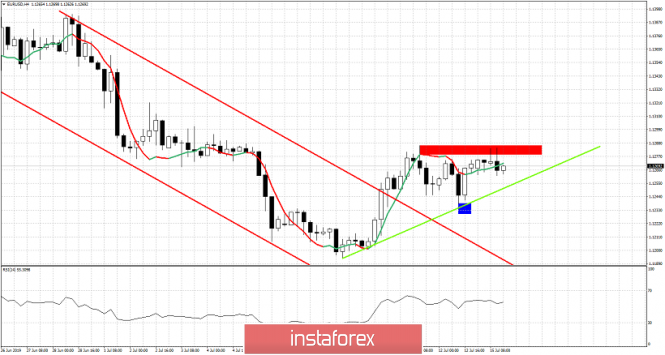
| EURUSD bounces off support as expected. Now what? Posted: 15 Jul 2019 06:47 AM PDT EURUSD has bounced off the 1.1250 support area as important Fibonacci support was found there. Price however has still not broken above recent highs and as long as price is below 1.1285-1.13 we remain cautiously bullish with tight stops.
Red lines - bearish channel (broken) Green line - trend line support Blue rectangle - pull back target Red rectangle - resistance area EURUSD is trying to break above the red rectangle resistance area. Support is important at 1.1250-1.1240. Holding above the green trend line is important for short-term bulls. Breaking above the red rectangle is also important for bulls. This will open the way for a move towards 1.14-1.15. If support at 1.1250 fails to hold then we should expect a test of the 1.12-1.1190 area. The material has been provided by InstaForex Company - www.instaforex.com |
| Gold 07.15.2019 - Rejection of the resistance at $1.419 in the backgorund Posted: 15 Jul 2019 06:45 AM PDT The Gold didn't have enough power to break the resistance at $1.419 and I saw the good rejection there, which is sign for me that buyers got very exhausted there. Since there is rejection of the resistance in the background, I would watch for selling opportunities. Gold also did back into the 24 balance range, which is another confirmation that upside break was unsustainable.
On the 4H time-frame I found that there is bear cross on the Stochastic and MACD, which represents short-term downtrend. Downward targets are set at the price of $1.400 and at $1.386. As long as the Gold is trading below the key resistance swing $1.426, I would watch for selling opportunities on the rallies. The material has been provided by InstaForex Company - www.instaforex.com |
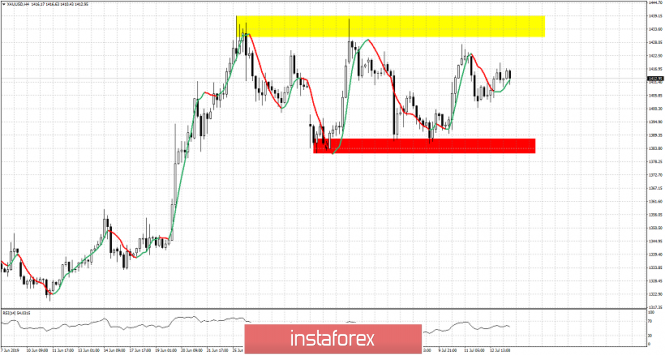
| Gold price remains trapped inside the short-term trading range Posted: 15 Jul 2019 06:43 AM PDT Gold price trades around $1,415 with price trapped inside the trading range its been in since the beginning of July. Gold price mainly moves sideways respecting both support at $1,385 and resistance at $1,439.
Yellow rectangle - resistance area Gold price is in a neutral short-term trend trading between $1,440 and $1,385. If support fails to hold we should first see a move towards $1,350 and maybe towards $1,330-$1,300. If resistance at $1,440 breaks we should first see a move towards $1,500 and maybe $1,525-35. In shorter time frames we should keep a close eye on $1,400 support and $1,427 resistance. Breaking either of these two levels will increase the chances of breaking the more important levels. The material has been provided by InstaForex Company - www.instaforex.com |
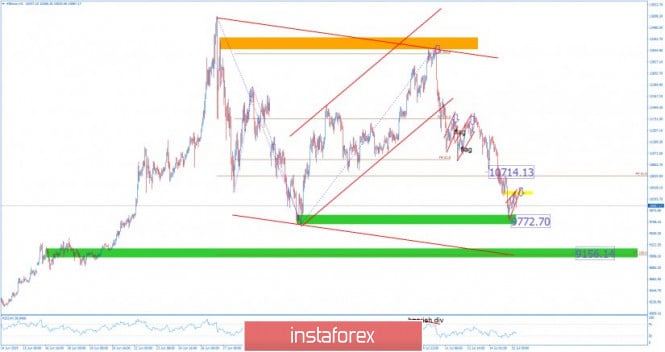
| BTC 07.15.2019 - Downside pressure and bear flag pattern completed Posted: 15 Jul 2019 06:19 AM PDT Industry news: Tech giant Samsung Electronics is joining six other major South Korean firms to develop a blockchain-based certificate and ID authentication network. Announced on Sunday and reported by CoinDesk Korea, the other founding firms include mobile carriers SK Telecom, LG Yuplus and KT, two banks – KEB Han and Wooriand – and government-founded securities infrastructure provider Koscom. Technical view:
As I expected, BTC did hit both our targets from last week at the price of $10.714 and $9.772. The level of $9.722 seems like a good support for today but I still see more downside to come. Most recently, according to the H1 time-frame, I have found broken bearish flag and rejection of the intraday resistance at the price of $10.300 (yellow rectangle) If BTC breaks the level of $9.722, there is a chance of testing the level of $9.156 (green rectangle). As long as the BTC is trading below $10,715 I would watch for selling opportunities. Important upward reference points are: $10,300 – Previous swing low acting like resistance (yellow rectangle) $10.715 – Previous hourly swing high Important Downward reference points are: $9.772 – Support (green rectangle) $9.156 – Important swing low and FE 100% Watch for selling opportunities on the rallies. The material has been provided by InstaForex Company - www.instaforex.com |
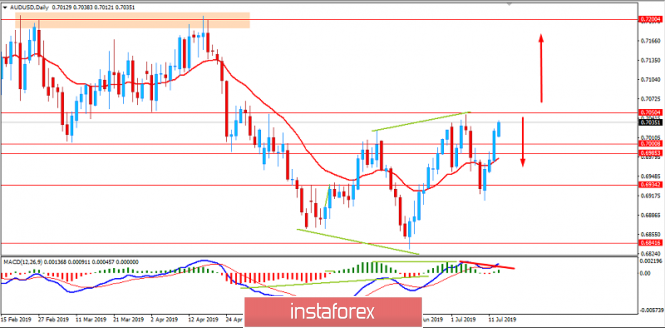
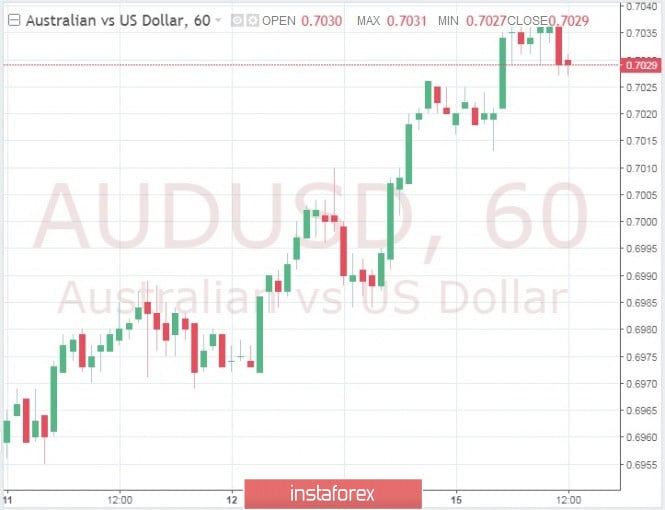
| Analysis of AUD/USD for July 15, 2019: AUD to sustain bullish pressure over USD Posted: 15 Jul 2019 06:08 AM PDT AUD/USD has been quite impulsive and non-volatile under the bullish momentum recently which made the price trade above 0.70 with an intention to retest 0.7050 again in the volatile corrective range. The Reserve Bank of Australia lowered rates by 0.25 in June and July. The moves were intended to ease monetary conditions and boost flagging growth. Besides, the RBA board aimed was to bring down the value of the Australian dollar which was too firm. Economists currently forecast Australia's $1.9 trillion annual gross domestic product (GDP) would expand 2.1% in 2019, down from predictions of 2.7% and 2.2% in the previous forecasts. Economic growth is seen picking up modestly to 2.5% in 2020 and 2.6% in 2021, though that would still be short of the 2.75% that is considered trend. A run of lackluster quarters has already seen annual growth slow to its lowest in a decade at just 1.8% as falling house prices and sluggish wages affected consumer spending. Such impacts have already steadied home prices in the long-suffering housing markets of Sydney and Melbourne. Tomorrow, the RBA is due to release the minutes of the latest policy meeting that is expected to play a vital role in the upcoming AUD gains. However, market expectations on this big event can increase volatility for AUD/USD. On Thursday, Australian Employment Change report is going to be published which is expected to have a drastic fall to 9.1k from the previous figure of 42.3k and Unemployment Rate is expected to be unchanged at 5.2%. On the other hand, the Federal Reserve has been under pressure from the US government. Some Fed officials believe that lower interest rates would lead to achieving the inflation goal. Investors are betting that Fed officials will announce a reduction in the benchmark overnight interest rate on July 30-31. Fed Chairman Jerome Powell recently suggested to lawmakers in his congressional testimony that the central bank has room to ease policy because inflation pressures remain muted despite a low unemployment rate. US President Donald Trump has repeatedly criticized the hawkish Fed's rhetoric and called for rate cuts to unwind earlier tightening. The White House's escalating conflicts with China and other major trade partners have also raised concerns about global growth. Additionally, quarterly projections published after the FOMC's June meeting revealed that the committee's median estimate of the neutral interest rate had fallen to 2.5% from 2.75% that indicates strong likelihood of the rate cut. The US will present a retail sales report tomorrow which are expected to decrease to 0.1% from the previous value of 0.5%. In this context, USD is expected to struggle further to sustain momentum against AUD which could trigger correction below 0.7050. A strong breakout above 0.7050 could lead the price to come with definite momentum in the nearest days. To sum it up, USD is likely to struggle versus AUD as the expectations of the upcoming economic reports and a rate cut have already impacted the overall market sentiment and could reinforce USD weakness in the coming days. TECHNICAL OVERVIEW: The price has been quite impulsive with the bullish gains since it bounced off the 0.6920 support area with a daily close. Despite the preceding strong bearish trend in place, such bullish pressure above 0.70 indicates strength of the bulls at the current price formation. In MACD, bearish divergence is in progress which if confirmed would create bearish pressure off 0.7050. Otherwise, a break above 0.7050 with a daily close would lead the price higher towards 0.7200 area in the coming days.
|
| Posted: 15 Jul 2019 05:50 AM PDT According to Bank of America (BofA) experts, if the head of the White House, Donald Trump, wants to weaken the American currency, it can be done quite easily - it is enough to abandon the strong dollar policy. "A strong dollar policy can be replaced by a strong economic growth policy, during which the USD rate can be adjusted accordingly," representatives of the financial institution said. According to BofA, Washington's transition to a policy of strong growth may weaken the dollar by about 5-10%. "The policy of a strong dollar has consolidated the status of the world reserve currency to the latter, which allowed the United States government to reduce financing costs since the country's trading partners place their dollars in US Treasury securities. Therefore, the US administration should act cautiously so as not to undermine investor confidence in US assets," said bank analysts. "A sharp weakening of the USD in the context of a slowing global economy, falling inflation expectations, a limited arsenal of monetary policy tools and trade tensions can cause a response from other central banks. Thus, the US refusal from a strong dollar policy may even provoke currency wars, "they added. In turn, Specialists at Goldman Sachs warned that the US administration can weaken the dollar with the help of currency intervention. "In recent years, the United States has not resorted to direct currency interventions, although until 1995 this practice was used quite often. On the one hand, an intervention aimed at weakening the dollar will reduce the cost of exporting goods from the United States, which theoretically should support the country's economy. On the other hand, if the White House decides to take such a step, then we should expect a tangible market reaction, which will be reflected in a weakening of the greenback, a strengthening of the yen and a fall in risky assets. In addition, interventions directed against traditional trading partners - for example, in relation to the EU, will lead to an escalation of international trade tensions, which means that they may turn out to be counterproductive", Goldman Sachs believes. The material has been provided by InstaForex Company - www.instaforex.com |
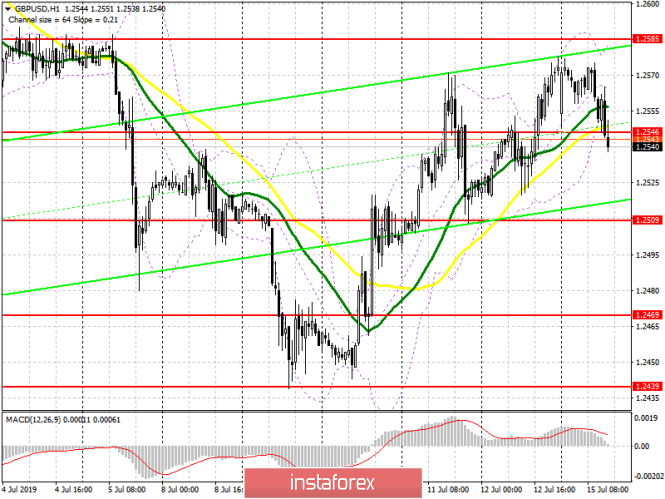
| Posted: 15 Jul 2019 05:45 AM PDT To open long positions on GBP/USD, you need: Buyers of the pound missed the support level of 1.2546, which I paid attention to in my morning review and now their task is to return to this range, which will allow maintaining an upward momentum. The main goal is to update the highs around 1.2585 and 1.2640, where I recommend taking the profit. With further downward correction, long positions can be looked at the rebound of the lows of 1.2509 and 1.2469. To open short positions on GBP/USD, you need: Sellers coped with the task of fixing below the support of 1.2546, which leaves a chance for a further decline in GBP/USD in the area of the lows 1.2509 and 1.2469, where I recommend taking the profit. Given the absence of important fundamental statistics, volatility is unlikely to be high enough. When returning the pound to the resistance of 1.2546, it is best to look at the short positions on the rebound from the maximum of 1.2585. Indicator signals: Moving Averages Trading is conducted in the area of 30 and 50 moving averages, which indicates market uncertainty. Bollinger Bands In the case of GBP/USD growth in the second half of the day, the upper limit of the indicator in the area of 1.2585 will act as a resistance.
Description of indicators
|
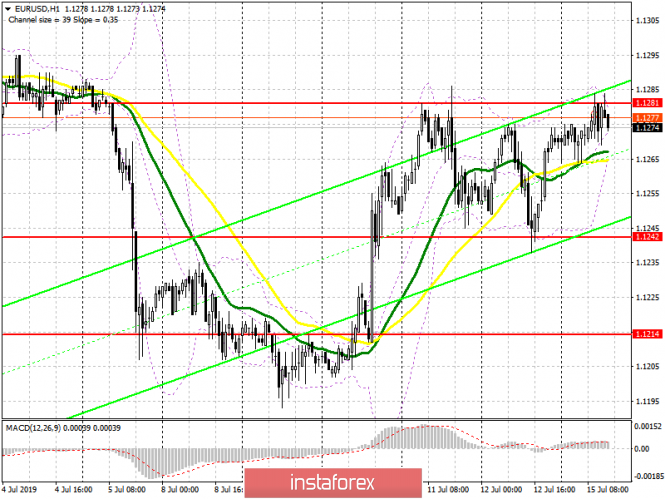
| Posted: 15 Jul 2019 05:45 AM PDT To open long positions on EURUSD, you need: In the first half of the day, euro buyers failed to reach new weekly highs above the level of 1.1279 and remain on the sidelines. In order to maintain the upward trend, a breakthrough and consolidation above the resistance of 1.1280 are required, which will push the euro higher to the highs of 1.1311 and 1.1338, where I recommend taking the profit. In the EUR/USD decline scenario, in the absence of important fundamental statistics, one can look at long positions after a false breakout in the support area of 1.1242 or a rebound from a larger minimum of 1.1214. To open short positions on EURUSD, you need: To reverse the upward trend, the euro sellers had to form a false breakout in the resistance area of 1.1279, which they successfully did. Now, the goal of the bears is a larger support level in the area of 1.1242, but only its breakthrough will provide the necessary pressure on EUR/USD and return to the lows of 1.1214 and 1.1182, where I recommend taking the profits. With the growth scenario above 1.1280 in the second half of the day, you can sell the euro to rebound from the highs of 1.1311 and 1.1338. Indicator signals: Moving Averages Trading is conducted in the area of 30 and 50 moving averages, which indicates market uncertainty. Bollinger Bands The breakdown of the lower limit of the indicator in the area of 1.1266 will lead to a larger decline in the euro.
Description of indicators
|
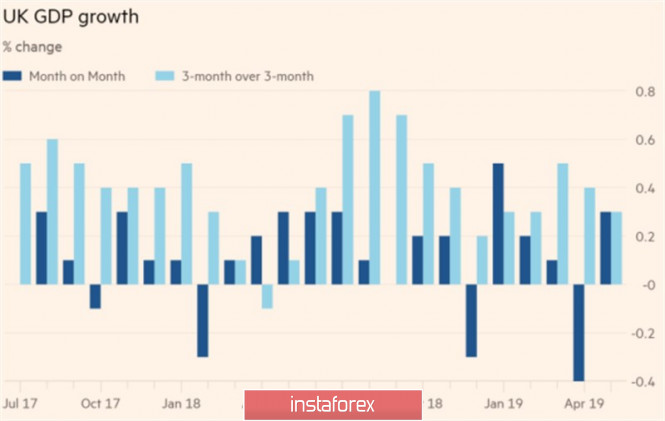
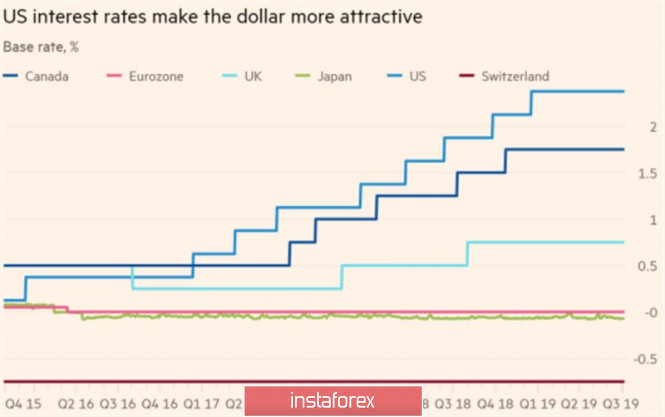
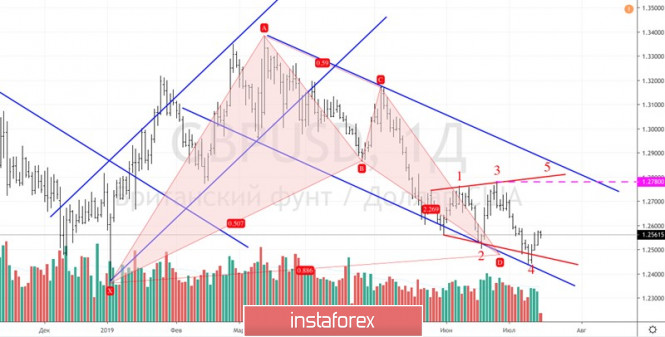
| Posted: 15 Jul 2019 05:03 AM PDT The rich economic calendar and the approximation of the date X, July 23, when a vote takes place within the Conservative Party about a new leader, allows the British pound to claim the role of the most interesting currency of the third week of July. Only signals given by Jerome Powell about easing the Fed's monetary policy allowed the GBP/USD "bulls" to return the pair's quotes above the base of the 25th figure, but in the struggle of two weak opponents, the policy can tilt the scales. It cannot be said that American statistics are regularly disappointing: June employment has exceeded the wildest forecasts of Reuters experts and core inflation mark of 2%. Nevertheless, the Fed is ready to ease monetary policy in order to prevent a recession. The derivatives market expects that the federal funds rate will be lowered at two FOMC meetings by the end of the year (in July and September). His testimony corresponds to the opinion of Chicago Federal Reserve Bank President Charles Evans, who believes that borrowing costs should be reduced by 50 bp before the end of the year, and the position of 53 experts from the Wall Street Journal. Their consensus at the end of 2019 is 1.99%. By contrast, British statistics are disappointing with an enviable frequency, forcing the index of economic surprises to drop to its lowest level in the last 8 years. Following the sad news from PMI is a disappointing GDP. Bloomberg experts expect a further slowdown in retail sales (July 18 release), inflation reluctance to accelerate (July 17) and a slowdown in employment growth (July 16). As a result, BoE official Gertjan Vlieghe begins to talk about reducing the repo rate to zero and says that the chances of a weakening of monetary policy are higher than the likelihood of its tightening. UK GDP Dynamics Thus, both the Fed and the Bank of England intend to cut rates by 50 basis points. At the same time, the fact of excessively bloated speculative long positions, which will most likely be closed, plays against the US dollar; versus pound is a factor in changing the BoE worldview. More recently, Mark Carney talked about monetary restriction is now a "dovish" rule that puts the ball inside the MPC. Dynamics of central bank rates If during exchange rate formation on Forex monetary policy was used exclusively, then the positions of the opponents could be called balanced and talk about the consolidation of GBP/USD pair. Alas, the uncertainty about who will eventually take the chair of the British Prime Minister makes the position of sterling more vulnerable than the US dollar. The chances of Boris Johnson, who is ready to "bring Misty Albion out of the EU or die," are three times higher than Jeremy Hunt. At the same time, the volatility of the pound remains low. Despite the loud statements of the favorite, the market is still not sure about Brexit uncertainty. If it does happen, the GBP/USD pair runs the risk of sagging in the direction of 1.20–1.22. Technically, the bears rule the ball until the pair is listed below 1.278. A return to important resistance and his successful assault will activate the Expanding Wedge pattern and will indicate a break in the downtrend. GBP / USD daily graph |
| The slowdown in China's GDP growth contributes to lower oil prices Posted: 15 Jul 2019 04:57 AM PDT
Oil becomes cheaper after the publication of reports on the decline in economic growth in China. The economy of the largest oil exporter showed the slowest quarterly growth in the last 27 years, which increased fears about the prospects for oil demand. September futures for the supply of Brent crude oil fell by 15 cents, or 0.2%, to 66.57 dollars per barrel, American WTI by 24 cents, or 0.4%, to 59.97 dollars per barrel. Recall, both varieties showed the largest weekly increase in three weeks due to the reduction in oil production in the United States and tensions in the Middle East. In general, on the supply side, prices remain stable, but there is no excitement on the part of buyers. China's economic growth slowed to 6.2% year-on-year in the second quarter. Nevertheless, industrial production and retail sales surpassed forecasts, giving reason to believe that the economy is healthier than previously thought. In June, the volume of oil production in China rose to a record 13.07 million barrels per day, which is 7.7% more than a year ago. ANZ analysts reported that the volume of oil imports this year still looks impressive, even despite a slight drop in June. "We believe that the additional quota for oil (provided) to private refiners should support imports in the second half of 2019," the bank noted. Iranian President Hassan Rouhani said that Iran is ready to negotiate with the United States if Washington cancels the sanctions and returns to the agreement on the nuclear program in 2015. Meanwhile, the UK has offered to release the detained Iranian oil tanker Grace 1, if Tehran will guarantee that it will not go to Syria. "The situation in Iran is also in focus. This is not the most serious event yet, but it has the potential to start having a serious impact on the markets," CMC Markets said. The material has been provided by InstaForex Company - www.instaforex.com |
| Can the euro break out of a narrow range against the dollar? Posted: 15 Jul 2019 04:28 AM PDT The euro began a week of growth, although it remains within its recent trading range against the dollar. In general, foreign exchange markets are in a calm state and only the Australian dollar shows good dynamics in the encouraging economic data from China. The euro/dollar pair has been stuck in a narrow range for several weeks. Investors expect the Fed to cut interest rates at the end of this month and the ECB will maintain a course for further easing in 2019. The euro rose 0.08% to 1.1282 dollars but it is still in the recent range of 1.14 to 1.11 dollars. Meanwhile, the dollar index remained at the same level of 96.81 points relative to a basket of major currencies. Analysts point out that the bearish sentiment towards the euro prevails given that the yield on treasury bonds is likely to remain one of the highest in developed markets, despite future Fed rate cuts. The euro should recover; Societe Generale believes that "For the most traded and most attractive currency pair in the world, the Fed's dovish tone, the President demanding to weaken the dollar and hints of optimism about the world economy, mean only one thing — the beginning of the rally". The Australian dollar reached a 10-day high due to stronger than expected economic data from China, which signals that the government stimulus measures are working, according to some analysts. Industrial production in China recovered in June from a 17-year low in May. June retail sales rose 9.8% year on year. The Australian dollar gained 0.2% to 0.7035 against the dollar. |
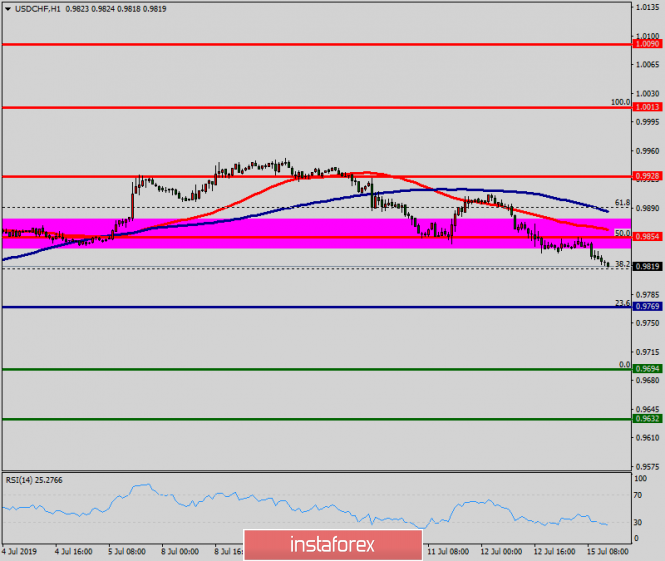
| Technical analysis of USD/CHF for July 15, 2019 Posted: 15 Jul 2019 04:18 AM PDT Overview: The USD/CHF pair fell sharply from the level of 0.9854 towards 0.9694. Now, the price is set at 0.9748. The resistance is seen at the level of 0.9854 and 0.9928. Moreover, the price area of 0.9854 and 0.9928 remains a significant resistance zone. Therefore, there is a possibility that the USD/CHF pair will move downside and the structure of a fall does not look corrective. The trend is still below the 100 EMA for that the bearish outlook remains the same as long as the 100 EMA is headed to the downside. Thus, amid the previous events, the price is still moving between the levels of 0.9770 and 0.9694. If the USD/CHF pair fails to break through the resistance level of 0.9770, the market will decline further to 0.9694 as as the first target. This would suggest a bearish market because the RSI indicator is still in a negative spot and does not show any trend-reversal signs. The pair is expected to drop lower towards at least 0.9632 so as to test the daily support 2. On the other hand, if a breakout takes place at the resistance level of 0.9854, then this scenario may become invalidated. The material has been provided by InstaForex Company - www.instaforex.com |
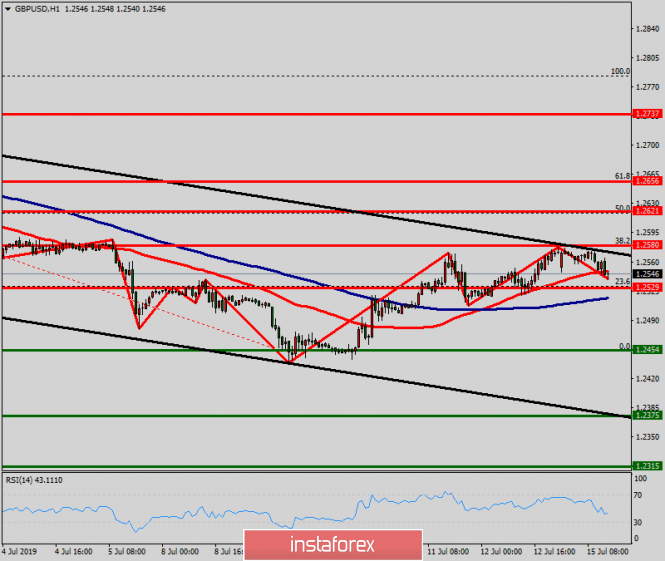
| Technical analysis of GBP/USD for July 15, 2019 Posted: 15 Jul 2019 04:14 AM PDT The GBP/USD pair continues to move downwards from the level of 1.2580. This week, the pair dropped from the level of 1.2580 to the bottom around 1.2454. But the pair rebounded from the bottom of 1.2454 then closed at 1.2560. Today, the first support level is seen at 1.2454, the price is moving in a bearish channel now. Furthermore, the price has been set below the strong resistance at the level of 1.2529, which coincides with the 23.6% Fibonacci retracement level. This resistance has been rejected several times confirming the veracity of a downtrend. Additionally, the RSI starts signaling a downward trend. As a result, if the NZD/USD pair is able to break out the first support at 1.2454, the market will decline further to 1.2375 in order to test the weekly support 2. Consequently, the market is likely to show signs of a bearish trend. So, it will be good to sell below the level of 1.2454 with the first target at 1.2375 and further to 1.2315. However, stop loss is to be placed above the level of 1.2580. The material has been provided by InstaForex Company - www.instaforex.com |


| You are subscribed to email updates from Forex analysis review. To stop receiving these emails, you may unsubscribe now. | Email delivery powered by Google |
| Google, 1600 Amphitheatre Parkway, Mountain View, CA 94043, United States | |
No comments:
Post a Comment