
Forex analysis review |
- GBP / USD. July 21. Results of the week. Jeremy Hunt can unexpectedly win the election.
- EUR / USD. July 21. Results of the week. Euro ends the week again on a minor note.
- Weekly Dollar index analysis
- EURUSD fails to break critical resistance and retests support
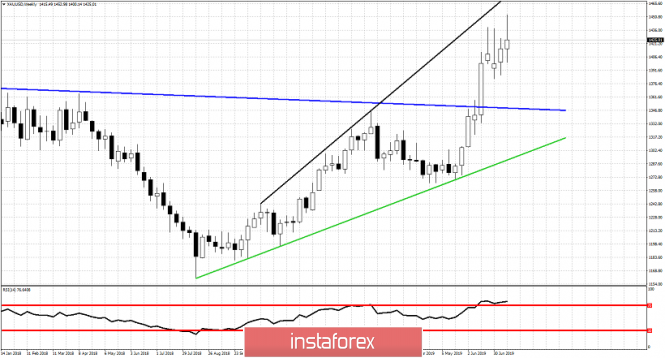
- Weekly Gold analysis
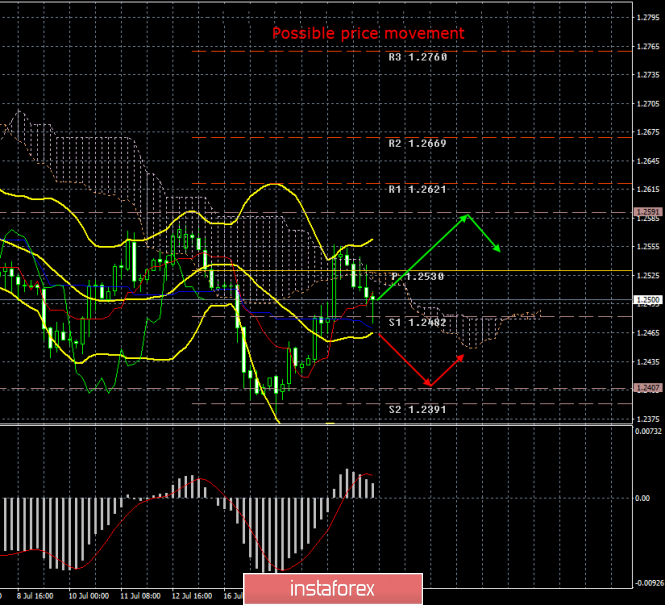
| GBP / USD. July 21. Results of the week. Jeremy Hunt can unexpectedly win the election. Posted: 21 Jul 2019 04:28 PM PDT 4 hour timeframe The amplitude of the last 5 days (high-low): 60p - 67p - 125p - 75p - 134p. Average amplitude for the last 5 days: 92p (80p). The British pound sterling, although it strengthened last week quite strongly, on Friday, July 19, began to correct itself and fell to the Kijun-sen line. The previous local maximum failed to overcome or reach by the pair of pound / dollar. Thus, according to the technical analysis, everything goes to the fact that the downward trend will resume. Next week, the whole world will know who will become the new leader of the Conservative Party and British Prime Minister, which is either Jeremy Hunt or Boris Johnson. According to the results of exit polls, Johnson leads, however, the balance of power between candidates may change after the events of last week, when the British Parliament passed an amendment to the Irish Parliament Act, which does not allow a country to leave the EU without a "deal" without the approval of Parliament itself. Thus, Johnson may unexpectedly lose the election, since he regularly insisted that the country should in any case leave the EU on October 31, even if there were no agreements with Brussels. It was he who was ready to suspend the work of Parliament in order to implement the "tough" Brexit on its own. Now, it turns out that this option is unlikely. A softer and loyal Jeremy Hunt, who allows Brexit to postpone to a later date, which does not persist with the date of October 31, which is ready for dialogue, may suddenly receive the support of the majority of members of the Conservative Party. At least from our point of view, this option cannot be ruled out. Anyway, on July 23, we will find out the name of the new prime minister. The fate of the pound sterling for the coming weeks, at least, will depend on it. Since at the moment, the British currency is inclined to decline again. Bears continue to dominate the market, and there are no good reasons to buy the pound. Trading recommendations: The currency pair pound / dollar began a downward correction. Formally, long positions with targets at levels 1.2591 and 1.2621 remain relevant, after the end of the current round of correction. However, longs are now associated with increased risks. We can buy the US dollar after the pair make a reversal below the line Kijun-sen, which will lead to a change in the downward trend. The first goal is 1.2407. In addition to the technical picture, we should also take into account the fundamental data and the time of their release. Explanation of the illustration: Ichimoku indicator: Tenkan-sen - the red line. Kijun-sen - the blue line. Senkou Span A - light brown dotted line. Senkou Span B - light purple dotted line. Chinkou Span - green line. Bollinger Bands indicator: 3 yellow lines. MACD Indicator: Red line and histogram with white bars in the indicator window. The material has been provided by InstaForex Company - www.instaforex.com |
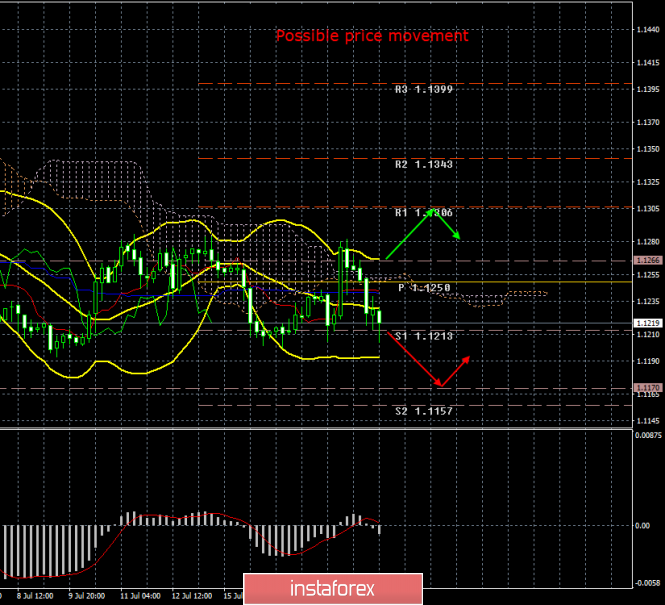
| EUR / USD. July 21. Results of the week. Euro ends the week again on a minor note. Posted: 21 Jul 2019 04:28 PM PDT 4 hour timeframe The amplitude of the last 5 days (high-low): 37p - 31p - 62p - 34p - 75p. Average amplitude for the last 5 days: 48p (41p). We have repeatedly noted that the pound sterling simply has no reason to grow now. Indeed, the strengthening of a particular currency is due to the balance of supply and demand. Since the supply does not change much, the main factor affecting the exchange rate is demand. And in the case of the pound sterling, this demand is absent. However, in the case of the euro currency, the situation is no better. On July 11, 15 and 19, the euro / dollar pair tried to overcome the level of 1.1280 three times, which is not too far from the pair's lows, which does not make it strong, and all three times were unsuccessfully. The euro rejoiced very briefly as that the Fed is preparing to soften monetary policy. After all, the forex market either remembered or drew attention to information relating to the ECB, which in the same way could lower the key rate in the coming months. The only difference is that the Fed will take this step in July, and the ECB, most likely, in September. However, surprises are possible here. The fact remains that nothing has changed in the confrontation of monetary policy. Moreover, in the European Union, they can reanimate the QE economic stimulus program and the TLTRO banking sector support program, which again will put the euro in a more disadvantageous position. And what is the result? As a result, even a reduction in the Fed's key rate is unlikely to support the euro and generate demand for this currency. On Friday, there were no important macroeconomic publications in the US and the EU, and next week the attention of traders will be focused on the ECB meeting. From a technical point of view, the pair is ready to resume the downward trend. Trading recommendations: The EUR / USD pair completed the next round of upward correction. Thus, it is now recommended again to sell the Eurocurrency with targets at levels 1.1170 and 1.1157, since the pair has broken the critical line. We recommend buying the euro / dollar not earlier than fixing the price above the Kijun-sen line with the first target of 1.1306; but with minimal lots, since the bulls remain extremely weak. In addition to the technical picture, we should also take into account the fundamental data and the time of their release. Explanation of the illustration: Ichimoku indicator: Tenkan-sen - the red line. Kijun-sen - the blue line. Senkou Span A - light brown dotted line. Senkou Span B - light purple dotted line. Chinkou Span - green line. Bollinger Bands indicator: 3 yellow lines. MACD Indicator: Red line and histogram with white bars in the indicator window. The material has been provided by InstaForex Company - www.instaforex.com |
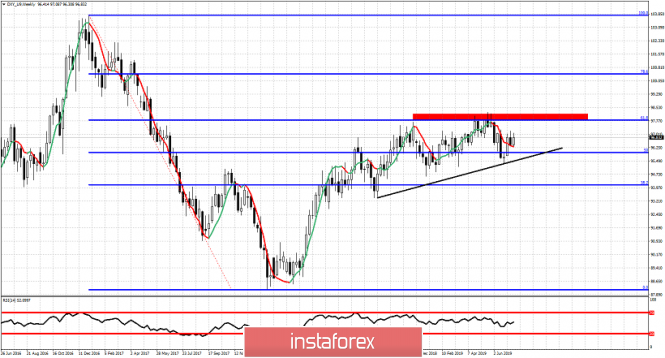
| Posted: 20 Jul 2019 11:29 PM PDT The Dollar index is consolidating between 98 and 95.50 for the last 8 months. Price has reached the 61.8% Fibonacci retracement area of the entire decline from 103.85 to 88.15. This is a high probability turning point of the medium-term trend in the Dollar index.
Black line - important support trend line The Dollar index is trading below the double top at 98-98.25. Price has stopped its rise just below the 61.8% Fibonacci level and my most probable scenario is a bearish reversal from current levels. Confirmation for this scenario will come with a weekly close below 95.60. A weekly close above 98.25 will be a bullish sign and will open the way for a move at least towards 100.40. The material has been provided by InstaForex Company - www.instaforex.com |
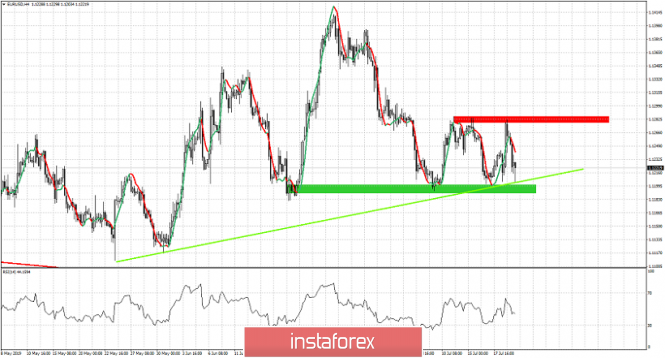
| EURUSD fails to break critical resistance and retests support Posted: 20 Jul 2019 11:24 PM PDT EURUSD price saw another rejection at the 1.1280 area and a strong bearish pull back towards 1.12 support. So far support holds but time is running out. Soon we will have a strong breakout with a clear signal. The end of this sideways move is near.
Green rectangle - support Green line - major trend line support Red rectangle - major resistance EURUSD made a strong move higher as expected towards 1.1280. Price got rejected and a triple top has been formed there. Resistance has been confirmed at 1.1280-1.13 area. Next time EURUSD visits this area we will have a break out...there will not be a fourth time rejection. Support at 1.12 remains valid. Price has reached 1.12 three times and each time price has bounced. Again I do not expect to see price test 1.12-1.1180 for the fourth time. A break below 1.12 will most probably be real next time if it occurs and it will accelerate selling pressures towards 1.11-1.10. Price continues to trade inside this trading range so traders need to be very cautious. I expect this sideways trend to end soon. The material has been provided by InstaForex Company - www.instaforex.com |
| Posted: 20 Jul 2019 11:19 PM PDT Gold price made a new higher high and a new higher weekly close this week. Trend remains bullish although in the short-term price seems to be moving mostly sideways digesting the big rally from May to June.
Blue line - long-term resistance trend line (broken) Green line- long-term support trend line Black line- resistance Gold price is in bullish trend since end of July 2018. Price has broken above the major resistance trend line at $1,350 and so far staying above it is a bullish sign for the longer-term trend. Recent weeks Gold price has been trading between $1,450-$,1390 with selling pressures each time price moves towards $1,450. Gold bulls however continue to support the trend as price does not fall below $1,400. As long as price remains above $1,390-$1,400 we remain short- and medium-term optimistic for a move towards $1,500 and higher. Breaking below $1,400-$1,390 will open the way for a back test of the blue broken trend line that is now support and was previously resistance. Long-term bullish trend is in danger only if price breaks below the green trend line. The material has been provided by InstaForex Company - www.instaforex.com |
| You are subscribed to email updates from Forex analysis review. To stop receiving these emails, you may unsubscribe now. | Email delivery powered by Google |
| Google, 1600 Amphitheatre Parkway, Mountain View, CA 94043, United States | |
No comments:
Post a Comment