
Forex analysis review |
- Control zones USDCHF 07/29/19
- Fractal analysis of major currency pairs on July 29
- Control zones USDCAD 07/29/19
- Control zones NZDUSD 07/29/19
- Control zones GBPUSD 07/29/19
- GBP/USD. July 28th. Results of the week. Boris Johnson's statements on Brexit are surprising
- EUR/USD. July 28th. Results of the week. What does the US GDP figures show?
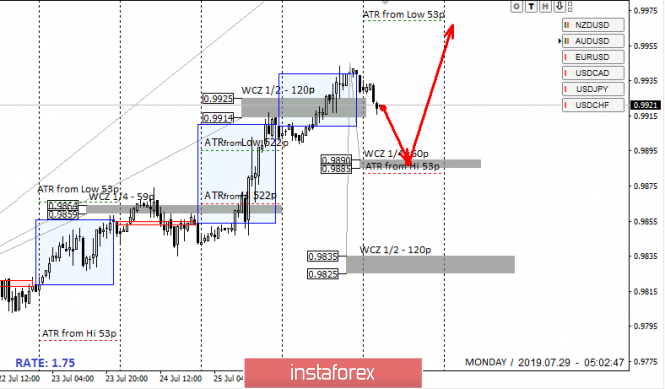
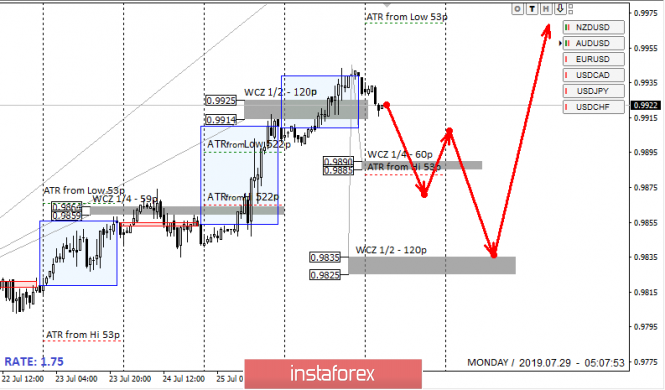
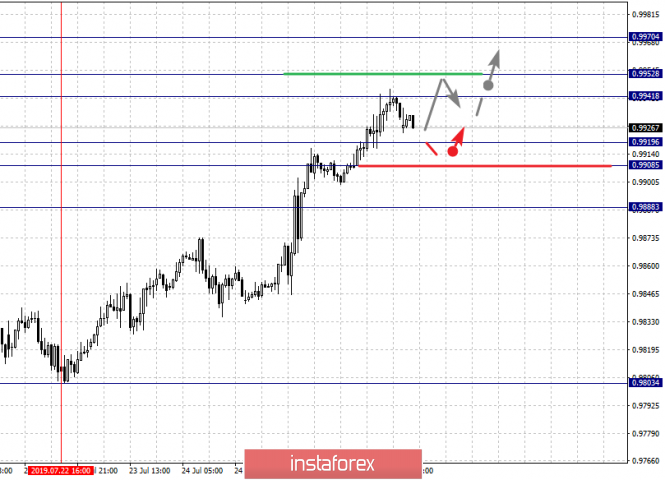
| Posted: 28 Jul 2019 07:15 PM PDT Since the closing of last week's trading occurred above the WCZ 1/2 0.9925-0.9914. The downward momentum can be considered complete. The new phase gives you the opportunity to enter a long position. Today's support is the WCZ 1/4 0.9890-0.9885. The zone is within the average daytime running, so it is a great place to look for a point of entry to purchase. Work within the upward impulse may require a deeper correction. In this case, a local accumulation zone will be formed. The second option, which is a time-stretched entry to purchases, is the test of WCZ 1/2 0.9835-0.9825. One day will not be enough for such a fall, so a decline to the specified zone should be considered as a weekly goal. It is difficult to consider purchases from current levels, since the size of the stop loss will be quite large. Daily CZ - daily control zone. The area formed by important data from the futures market, which change several times a year. Weekly CZ - weekly control zone. The zone formed by important marks of the futures market, which change several times a year. Monthly CZ - monthly control zone. The zone, which is a reflection of the average volatility over the past year. The material has been provided by InstaForex Company - www.instaforex.com |
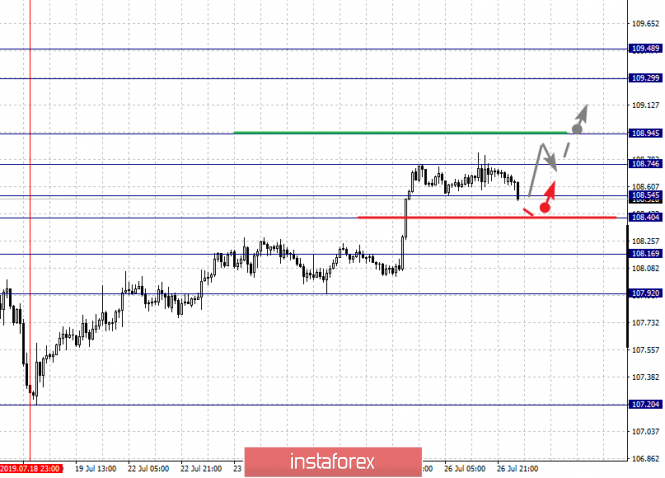
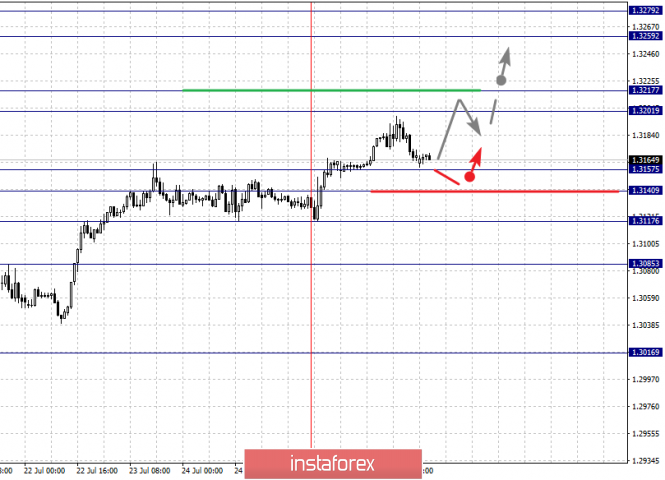
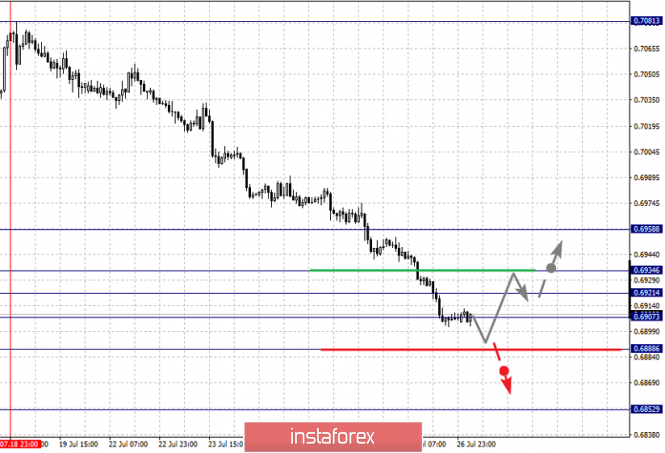
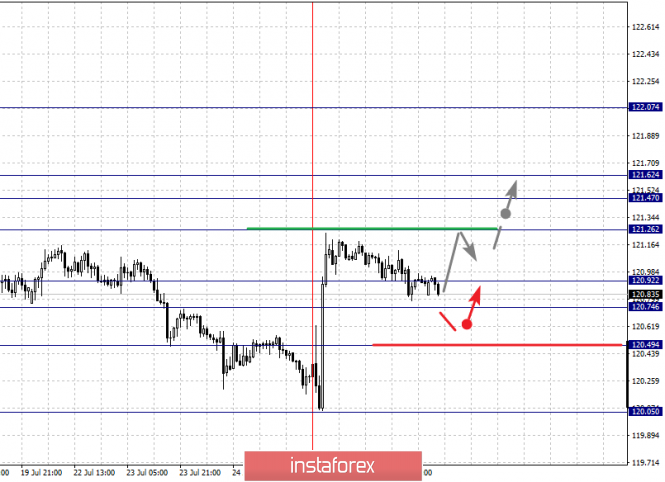
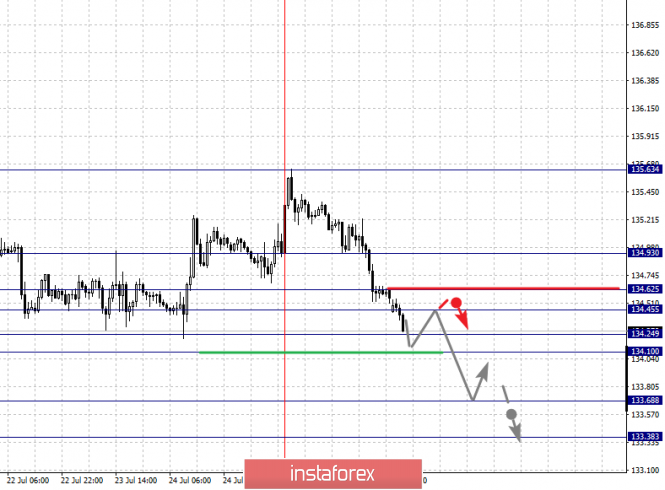
| Fractal analysis of major currency pairs on July 29 Posted: 28 Jul 2019 07:07 PM PDT Forecast for July 29: Analytical review of H1-scale currency pairs: For the euro / dollar pair, the key levels on the H1 scale are: 1.1212, 1.1195, 1.1174, 1.1162, 1.1119, 1.1104 and 1.1073. Here, the price is in the correction zone from the downward structure on July 18. The continuation of the movement to the top is expected after the price passes the noise range 1.1162 - 1.1174. In this case, the goal is 1.1195. Price consolidation is near this level. For the potential value for the top, we consider the level of 1.1212. Short-term downward movement is possible in the range of 1.1119 - 1.1104. The breakdown of the latter value will allow us to expect movement towards a potential target - 1.1073. From this level, we expect a rollback to the top. The main trend is the local downward structure of July 18, the stage of correction. Trading recommendations: Buy 1.1175 Take profit: 1.1195 Buy 1.1197 Take profit: 1.1212 Sell: 1.1119 Take profit: 1.1105 Sell: 1.1103 Take profit: 1.1075 For the pound / dollar pair, the key levels on the H1 scale are: 1.2448, 1.2415, 1.2398, 1.2354, 1.2315 and 1.2294. Here, we determined the subsequent targets from the downward structure on July 19. The continuation of the movement to the bottom is expected after the breakdown of the level of 1.2354. In this case, the target is 1.2315. For the potential value for the bottom, we consider the level of 1.2294. After reaching which, we expect consolidation, as well as rollback to the top. Short-term upward movement is possible in the range of 1.2398 - 1.2415. The breakdown of the last value will lead to a deep correction. Here, the target is 1.2448. This level is a key support for the downward structure. The main trend is the downward cycle of July 19. Trading recommendations: Buy: 1.2398 Take profit: 1.2414 Buy: 1.2417 Take profit: 1.2448 Sell: 1.2354 Take profit: 1.2320 Sell: 1.2315 Take profit: 1.2295 For the dollar / franc pair, the key levels on the H1 scale are: 0.9952, 0.9930, 0.9919, 0.9888, 0.9871 and 0.9850. Here, we are following the development of the ascending structure of July 22. Short-term upward movement is possible in the range of 0.9941 - 0.9952. The breakdown of the latter value will lead to movement to the potential target - 0.9970. From this level, we expect a rollback to the bottom. Short-term downward movement is possible in the range of 0.9919 - 0.9908. The breakdown of the latter value will lead to a prolonged correction. Here, the target is 0.9888. This level is a key support for the upward structure. The main trend is the ascending structure of July 22. Trading recommendations: Buy : 0.9941 Take profit: 0.9950 Buy : 0.9954 Take profit: 0.9970 Sell: 0.9919 Take profit: 0.9909 Sell: 0.9907 Take profit: 0.9888 For the dollar / yen pair, the key levels on the scale are : 109.48, 109.29, 108.94, 108.74, 108.54, 108.40, 108.16 and 107.92. Here, we are following the development of the ascending structure of July 18. Short-term upward movement is expected in the range of 108.74 - 108.94. The breakdown of the last value should be accompanied by a pronounced upward movement. In this case, the target is 109.29. We consider the level of 109.48 to be a potential value for the top. Upon reaching this level, we expect consolidation as well as a rollback to the bottom. Short-term downward movement is possible in the range of 108.54 - 108.40. The breakdown of the last value will lead to a prolonged correction. Here, the goal is 108.16. This level is a key support for the upward structure. Its price passage will have to form the initial conditions for the downward cycle. Here, the potential goal is 107.92. The main trend: the ascending structure of July 18. Trading recommendations: Buy: 108.75 Take profit: 108.92 Buy : 108.95 Take profit: 109.29 Sell: 108.54 Take profit: 108.42 Sell: 108.38 Take profit: 108.16 For the Canadian dollar / Us dollar pair, the key levels on the H1 scale are: 1.3279, 1.3259, 1.3217, 1.3201, 1.3157, 1.3140, 1.3117 and 1.3085. Here, we determined the subsequent targets from the local ascending structure on July 25th. The continuation of the movement to the top is expected after the price passes the noise range 1.3201 - 1.3217. In this case, the goal is 1.3259. For the potential value for the top, we consider the level of 1.3279. After reaching which, we expect consolidation, as well as a rollback to the bottom. Short-term downward movement is possible in the range of 1.3157 - 1.3140. The breakdown of the latter value will have to form a downward structure. Here, the first target is 1.3117. For the potential value for the bottom, we consider the level of 1.3085. The main trend is the local ascending structure of July 25. Trading recommendations: Buy: 1.3217 Take profit: 1.3257 Buy : 1.3260 Take profit: 1.3278 Sell: 1.3157 Take profit: 1.3140 Sell: 1.3138 Take profit: 1.3118 For the Australian dollar / Us dollar pair, the key levels on the H1 scale are : 0.6958, 0.6934, 0.6921, 0.6907, 0.6888 and 0.6852. Here, we follow the development of the downward structure of July 18. Short-term downward movement is expected in the range of 0.6907 - 0.6888. From here, we expect a key turn to the top. The breakdown of the level of 0.6888 will lead to a move to a potential target of 0.6852. But in this case, we expect an unstable trend development. Short-term upward movement is possible in the range of 0.6921 - 0.6934. The breakdown of the latter value will lead to a prolonged correction. In this case, the target is 0.6958. The main trend - the downward structure of July 18. Trading recommendations: Buy: 0.6921 Take profit: 0.6934 Buy: 0.6936 Take profit: 0.6955 Sell : 0.6905 Take profit : 0.6890 Sell: 0.6884 Take profit: 0.6855 For the euro /yen pair, the key levels on the H1 scale are: 122.07, 121.62, 121.47, 121.26, 120.92, 120.74 and 120.49. Here, the price forms the initial conditions for the upward movement of July 25. The continuation of the movement to the top is expected after the breakdown of the level of 121.26. In this case, the goal is 121.47. We expect clearance of the expressed structure to the level of 121.62. For the potential value for the top, we consider the level of 122.07. The movement to which is expected after the breakdown of the level of 121.62. Consolidated movement is possible in the range of 120.92 - 120.74. The breakdown of the last value will lead to a prolonged correction. Here, the goal is 120.49. This level is a key support for the top. The main trend is the formation of the initial conditions for the upward cycle of July 25. Trading recommendations: Buy: 121.26 Take profit: 121.45 Buy: 121.64 Take profit: 122.05 Sell: 120.72 Take profit: 120.54 Sell: 120.45 Take profit: 120.10 For the pound / yen pair, the key levels on the H1 scale are : 134.93, 134.62, 134.45, 134.24, 134.10, 133.68 and 133.38. Here, we are following the formation of the downward structure of July 25. The continuation of the movement to the bottom is expected after the price passes the noise range 134.24 - 134.10. In this case, the goal is 133.68. We consider the level of 133.38 to be a potential value for the bottom. After reaching which, we expect consolidation, as well as a rollback to the correction. Short-term upward trend is possibly in the range of 134.45 - 134.62. The breakdown of the last value will lead to a prolonged correction. Here, the goal is 134.93. This level is a key support for the downward structure. The main trend - the formation of the potential for the bottom of July 25. Trading recommendations: Buy: 134.45 Take profit: 134.60 Buy: 136.64 Take profit: 134.90 Sell: 134.10 Take profit: 133.70 Sell: 133.65 Take profit: 133.40 The material has been provided by InstaForex Company - www.instaforex.com |
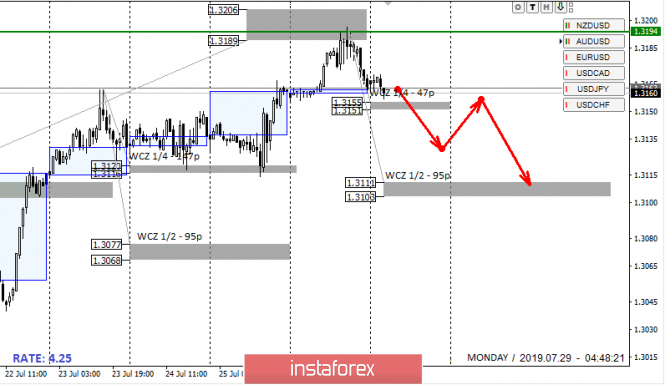
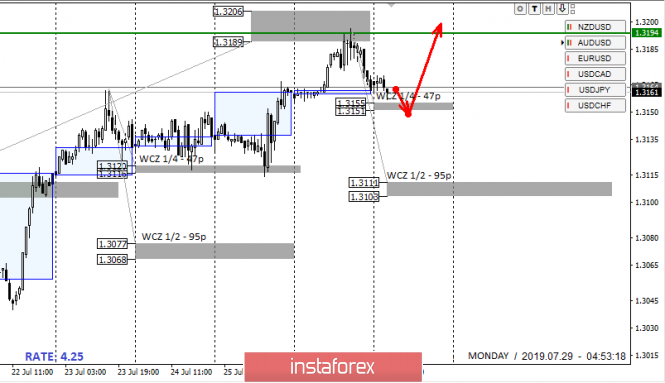
| Posted: 28 Jul 2019 06:55 PM PDT Today's trading takes place near the WCZ 1/4 1.3155-1.3151, which makes it possible to consolidate a part of sales that were opened on Friday. If there is no short position yet, you will need to wait for the breakdown of the specified zone and the closure of the US session below it. This will allow a more conservative entry into the market tomorrow. The next decline target will be the WCZ 1/2 1.3111-1.3103. It is important to understand that sales made from a weekly control zone need to be transferred to breakeven after the test of the WCZ 1/4, since the upward movement is now an impulse. An alternative growth model will become relevant if the pair fails to consolidate below the WCZ 1/4. In this case, a false breakdown pattern of Friday's low will form today. This will provide an opportunity to enter the purchase, the purpose of which will be to update the monthly high. Further growth will depend on the extremum test. Daily CZ - daily control zone. The area formed by important data from the futures market, which change several times a year. Weekly CZ - weekly control zone. The zone formed by important marks of the futures market, which change several times a year. Monthly CZ - monthly control zone. The zone, which is a reflection of the average volatility over the past year. The material has been provided by InstaForex Company - www.instaforex.com |
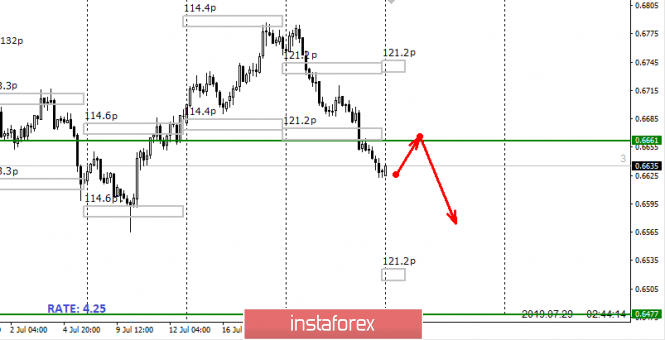
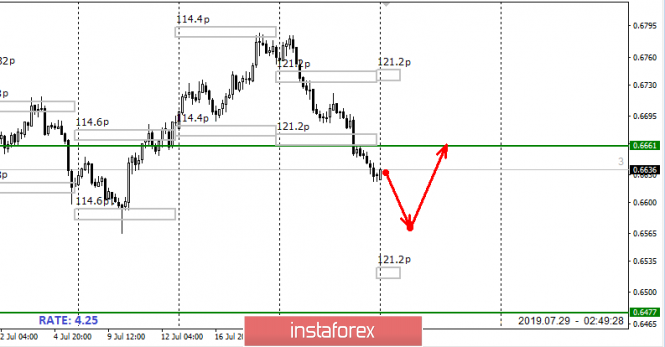
| Posted: 28 Jul 2019 06:31 PM PDT The downward movement is a mid-term impulse. This makes it possible to keep last week's sales open. It is important to understand that the close of trading on Friday occurred below the range of the average weekly move. This suggests an increase in the probability of a return of up to 90%. A high probability of a return may provide better prices for selling. After returning to the framework of last week's average move, a search for a resistance zone will be required. This is necessary to enter a short position in a simple pattern. The alternative option of falling without returning to the middle course has a low probability, so it is better not to make sales from current grades. If the fall continues without a return, then it is necessary to find a significant support level target in order to enter a correctional long position, since the probability of a return is 90%. Daily CZ - daily control zone. The area formed by important data from the futures market, which change several times a year. Weekly CZ - weekly control zone. The zone formed by important marks of the futures market, which change several times a year. Monthly CZ - monthly control zone. The zone, which is a reflection of the average volatility over the past year. The material has been provided by InstaForex Company - www.instaforex.com |
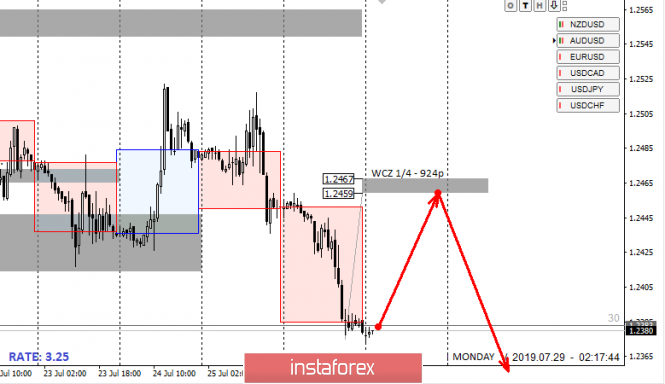
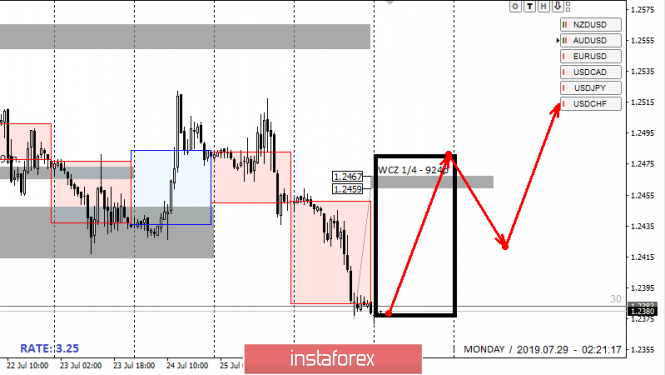
| Posted: 28 Jul 2019 06:21 PM PDT The opening of trading of the current week occurred at the level of a monthly low, which indicates a downward priority. Retention of sales is the basis of a trading plan. Any growth must be perceived as corrective and used for repeated entries in a short position. The closest resistance is the WCZ 1/4 1.2467-1.2459, the test of which obliges you to consider selling patterns. The fall can be continued from the current levels. In this case, selling will not be profitable, since it is not possible to set an adequate stop loss. An alternative model will be developed if growth exceeds Friday's fall. The probability of forming such a model is 30%, which makes it auxiliary. Closing today's trading above the level of 1.2467 will move the movement into the flat phase, where the weekly extremes will take the first place. |
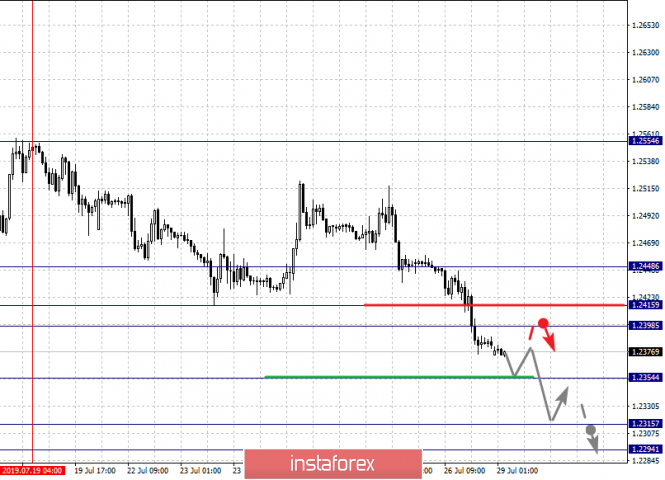
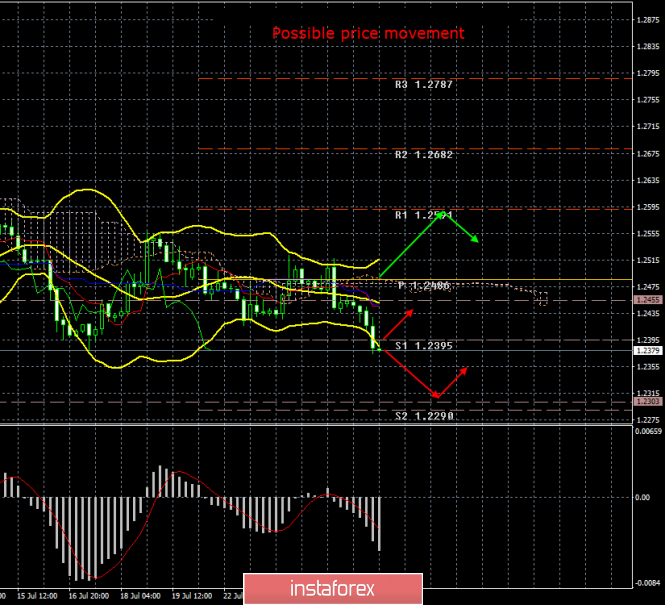
| GBP/USD. July 28th. Results of the week. Boris Johnson's statements on Brexit are surprising Posted: 28 Jul 2019 03:52 PM PDT 4-hour timeframe The amplitude of the last 5 days (high-low): 80p - 58p - 64p - 96p - 81p. Average amplitude for the last 5 days: 76p (86p). Sometimes political games start to look ambiguous and raise many questions. It is obvious that ordinary citizens see only the "tip of the iceberg" of all political processes in any country. At the same time, any government shows the "picture" so that the population clearly understands the vector of political actions. In the UK over the past three years, there have often been questions to the government, which is not something about not being able to bring an end to Brexit, but that they cannot even come to a common opinion on which scenario it should be implemented. One gets the feeling that such a "hanging" state is beneficial for the UK government. How it can be beneficial is only known to the government itself. However, a long time ago, it was clear to any ordinary citizen that Theresa May's deal does not suit the Parliament. That the EU leaders are not satisfied with the proposal to remove the "backstop" mechanism from the current deal. And what do we have in the end? Boris Johnson assumes the post of prime minister and immediately declares that in order to conclude an agreement with the European Union, Brussels must make concessions on the issue of the North Irish border. But the European Union did not take any steps towards new negotiations. Brussels has been saying for several months now that the current version of the agreement is the best that it can offer. Immediately after this controversial speech by Johnson, the European Union once again makes an official statement that there will be no new negotiations. This statement is not made by just "some" member of the European Commission, but by Jean Claude Juncker, its head. And what does Johnson answer him literally in 2 days? Johnson reports that in order to sign a new agreement, the European Union must abandon the "spare mechanism" at the border between Northern Ireland and Ireland. As a result, traders more and more begin to regard the whole situation as some kind of pun, and in the meantime the pound sterling continues to calmly fall, because there is simply nothing left for it. Trading recommendations: The pound/dollar currency pair resumed the downward movement. Therefore, it is now recommended to continue selling the pound sterling with the goal of a support level of 1.2303. After the pair has been consolidated above the critical line, it will be possible to buy the British currency, however, with extreme caution and small lots. The first goal is the 1.2591 level. In addition to the technical picture should also take into account the fundamental data and the time of their release. Explanation of the illustration: Ichimoku indicator: Tenkan-sen - the red line. Kijun-sen - the blue line. Senkou Span A - light brown dotted line. Senkou Span B - light purple dotted line. Chikou Span - green line. Bollinger Bands indicator: 3 yellow lines. MACD Indicator: Red line and histogram with white bars in the indicator window. The material has been provided by InstaForex Company - www.instaforex.com |
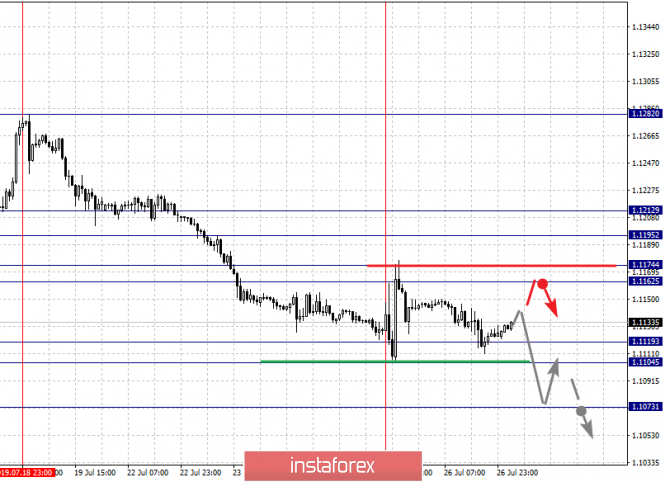
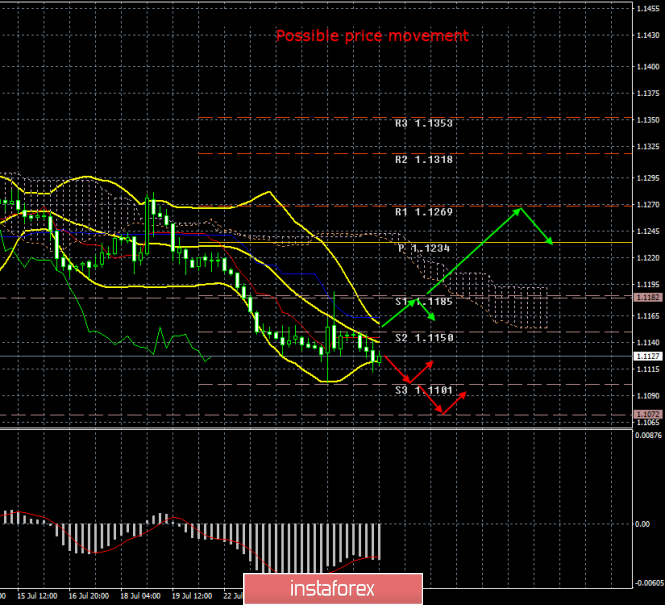
| EUR/USD. July 28th. Results of the week. What does the US GDP figures show? Posted: 28 Jul 2019 03:39 PM PDT 4-hour timeframe The amplitude of the last 5 days (high-low): 78p - 19p - 64p - 29p - 86p. Average amplitude for the last 5 days: 55p (53p). On Friday, July 26, the EUR/USD pair resumed its downward movement, having previously adjusted to the critical line. The ECB meeting was the main event of last week, after which it became clear that the regulator is preparing to reduce rates, restart the quantitative easing program. That is, the current state of the EU economy forces Draghi to go for softening measures. In addition, a preliminary report on US GDP for the second quarter was published on Friday. It turned out that there was a 2.1% growth while the forecast was +1.8%. As we mentioned on Friday morning, it doesn't matter how much GDP growth slows down compared to the first quarter, it's important whether it exceeds the forecast value. It exceeded so the US dollar again received support for the Forex market. In addition, we have repeatedly said that until the ECB begins to tighten monetary policy, it will be difficult for the European currency to expect long-term strengthening, since all US macroeconomic indicators are much higher. Accordingly, even if the "numbers" are falling in the United States, the situation over there still remains better than in the eurozone. Now the Fed may lower the key rate on July 31, but traders are unlikely to actively get rid of the dollar, since this decision was expected by market participants, and the refinancing rate will then be at 2.25%, and in the eurozone it will be at a 0.0% level. Despite expectations of an easing in US monetary policy, the dollar showed no excitement. Technically, the euro/dollar has updated two-year lows this week, respectively, it has all the technical grounds to continue falling. Trading recommendations: EUR/USD rebounded from the Kijun-Sen line. Thus, it is now recommended to re-sell the euro with targets at levels 1.1101 and 1.1072 and maintain open shorts until the MACD reverses to the top. We recommend buying the euro/dollar pair dollar not earlier than when traders overcome the Kijun-sen line with targets at 1.1185 and 1.1269, but with minimal lots, since the bulls remain extremely weak. In addition to the technical picture should also take into account the fundamental data and the time of their release. Explanation of the illustration: Ichimoku indicator: Tenkan-sen - the red line. Kijun-sen - the blue line. Senkou Span A - light brown dotted line. Senkou Span B - light purple dotted line. Chikou Span - green line. Bollinger Bands indicator: 3 yellow lines. MACD Indicator: Red line and histogram with white bars in the indicator window. The material has been provided by InstaForex Company - www.instaforex.com |
| You are subscribed to email updates from Forex analysis review. To stop receiving these emails, you may unsubscribe now. | Email delivery powered by Google |
| Google, 1600 Amphitheatre Parkway, Mountain View, CA 94043, United States | |
No comments:
Post a Comment